$COST is transiting from the Markup to the Accumulation (A)The squeezing and oversold momentum readings suggest the markdown is losing steam and "stopping action" may be occurring. We could be witnessing the area where a Selling Climax or preliminary support forms. I'm not looking for a new all-time high, but a trip to test resistance seems likely.
4COST trade ideas
COSTCO Looking for a bottom to fuel rally to $1250.Last time we looked at Costco (COST) was 6 months ago (January 21) when we gave the most optimal buy signal exactly at the bottom of the Channel Up at the time, easily hitting our $1045 Target:
Since then, the stock has entered a new Accumulation Phase in the form of a Triangle and this week broke below its 1W MA50 (blue trend-line), which is where its previous bottom (Higher Low) was formed.
The last similar Triangle pattern was formed straight after the May 16 2022 market bottom and once it broke upwards it led to a massive rally. Even the 1W RSI sequences between the two fractals are similar.
Our Target is $1250, just below the 1.786 Fibonacci extension.
-------------------------------------------------------------------------------
** Please LIKE 👍, FOLLOW ✅, SHARE 🙌 and COMMENT ✍ if you enjoy this idea! Also share your ideas and charts in the comments section below! This is best way to keep it relevant, support us, keep the content here free and allow the idea to reach as many people as possible. **
-------------------------------------------------------------------------------
💸💸💸💸💸💸
👇 👇 👇 👇 👇 👇

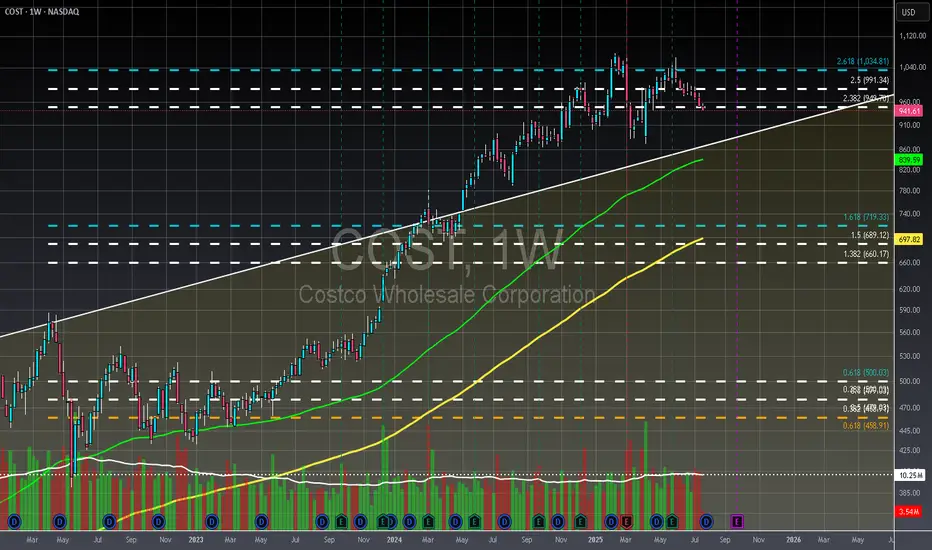
COST - Weekly - OverboughtCostco is currently trading outside a monthly channel it has been in since 1992, which could signal strong demand or overzealous traders. If Costco fails to break the $1034 Fibonacci level, considered the golden target for bulls, a reversal is likely, potentially leading to a return to the 100-period weekly moving average. Despite these trading observations, Costco's financials are robust, showing consistent year-over-year revenue growth and stable net income over the past four years, reinforcing its strong reputation. Major investors in Costco include Vanguard, State Street, and Morgan Stanley.
Not financial advice, always do your due diligence
Leave a like👍 and/or comment💬.
We appreciate and value everyone's feedback!
- RoninAITrader
Costco has broken down from a rising trend Costco has broken down from a rising trend with increased volume and a significant price drop exceeding 3%.
The trendline has not been retested after the breakdown, but a retest is not required.
The price has support around 910 and 875.
There is a declining RSI(21) and negative volume balance over the past month.
The price is trading below a green Ichimoku cloud, and Senkou Span B has crossed above Senkou Span A in the forward-looking cloud, indicating weakening momentum ahead.
From a technical standpoint, Costco appears negative in the medium term (one to six months).
This analysis does not represent a long-term forecast.
Fundamental analysts remain largely positive on the stock.
Disclaimer: I recently exited my position in Costco. The position had shown weak performance, and I am also reducing exposure to the USD.

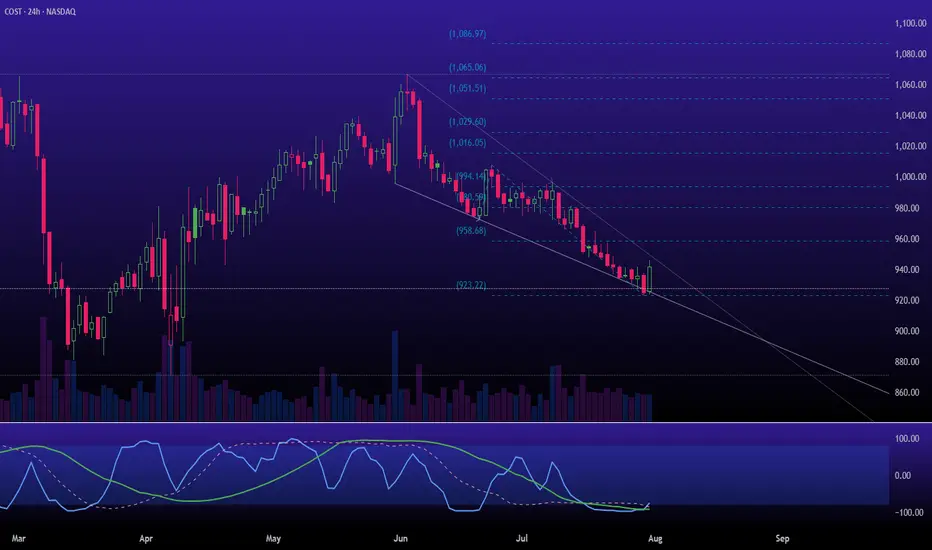
Costco Wave Analysis – 16 July 2025
- Costco broke the support area
- Likely to fall to support level 940.00
Costco recently broke the support area located between the pivotal support level 970.00 and the 50% Fibonacci correction of the upward impulse from April.
The breakout of this support area accelerated the C-wave of the active ABC correction (2).
Costco can be expected to fall to the next support level 940.00 (target price for the completion of the active C-wave).

Potential Top in CostcoCostco Wholesale has been quietly limping, and some traders may see downside risk in the big-box retailer.
The first pattern on today’s chart is the June low of $973.90. COST made lower highs while trying to hold that level but is now sliding below it. That may be viewed as a potentially bearish triangle breakdown.
Second, the 8-day exponential moving average (EMA) is under the 21-day EMA. MACD is also falling. Both of those signals may be consistent with short-term downtrends.
Third, COST made a lower high in June compared with February. Compared with the broader market’s breakout, such price action may reflect a lack of buying interest.
Finally, the 100-day simple moving average has turned meaningfully lower for the first time in over two years. That may suggest a weakening longer-term trend.
TradeStation has, for decades, advanced the trading industry, providing access to stocks, options and futures. If you're born to trade, we could be for you. See our Overview for more.
Past performance, whether actual or indicated by historical tests of strategies, is no guarantee of future performance or success. There is a possibility that you may sustain a loss equal to or greater than your entire investment regardless of which asset class you trade (equities, options or futures); therefore, you should not invest or risk money that you cannot afford to lose. Online trading is not suitable for all investors. View the document titled Characteristics and Risks of Standardized Options at www.TradeStation.com . Before trading any asset class, customers must read the relevant risk disclosure statements on www.TradeStation.com . System access and trade placement and execution may be delayed or fail due to market volatility and volume, quote delays, system and software errors, Internet traffic, outages and other factors.
Securities and futures trading is offered to self-directed customers by TradeStation Securities, Inc., a broker-dealer registered with the Securities and Exchange Commission and a futures commission merchant licensed with the Commodity Futures Trading Commission). TradeStation Securities is a member of the Financial Industry Regulatory Authority, the National Futures Association, and a number of exchanges.
TradeStation Securities, Inc. and TradeStation Technologies, Inc. are each wholly owned subsidiaries of TradeStation Group, Inc., both operating, and providing products and services, under the TradeStation brand and trademark. When applying for, or purchasing, accounts, subscriptions, products and services, it is important that you know which company you will be dealing with. Visit www.TradeStation.com for further important information explaining what this means.

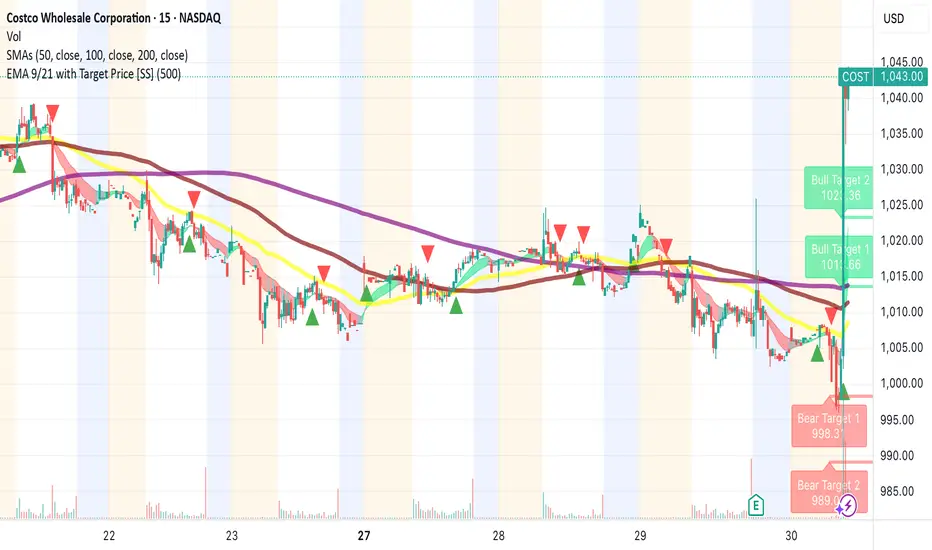
Costco is in the Wyckoff distribution phaseThis Week (July 8 - 11):
Support: The immediate floor is at $965. Below that, the low from the initial sell-off around $955 is critical.
Resistance: The 20-day moving average (that green line) at ~$992 is the first ceiling. If it gets frisky, look for sellers to appear at $1,030.
Next Month (July):
Support: If $955 breaks, this whole structure fails. The next major stop would be the April lows around $872. That's the edge of the cliff.
Resistance: The all-time high of $1,067 is the ultimate party zone that the bouncers (sellers) are not letting anyone back into right now.

Costco: Strong Membership Model Suggests Bullish Upside Current Price: $987.02
Direction: LONG
Targets:
- T1 = $1,016.00
- T2 = $1,032.00
Stop Levels:
- S1 = $957.00
- S2 = $940.00
**Wisdom of Professional Traders:**
This analysis synthesizes insights from thousands of professional traders and market experts, leveraging collective intelligence to identify high-probability trade setups. The wisdom of crowds principle suggests that aggregated market perspectives from experienced professionals often outperform individual forecasts, reducing cognitive biases and highlighting consensus opportunities in Costco.
**Key Insights:**
Costco's membership-driven model continues to thrive in a challenging economic climate, characterized by inflationary pressures and uncertain economic outlooks. Consumers are increasingly drawn to the value and cost-saving advantages offered through bulk purchases and exclusive benefits. This positions Costco as a defensive retail stock, appealing to investors seeking stability in turbulent markets. Furthermore, its strong customer loyalty and ability to generate predictable revenue streams make it attractive during periods when discretionary spending tightens.
Costco is also leveraging technology, particularly trends like AI, to streamline operations and improve supply chain efficiency. This strategic use of innovative tools ensures competitive pricing, mitigates potential supply issues, and enhances profit margins. Traders should keep a watchful eye on how these advancements influence quarterly results and broader investor sentiment.
**Recent Performance:**
Costco has been trading near historical highs, delivering resilience even amid broader economic challenges. At $987.02, the stock exhibits strong momentum, supported by favorable financial metrics such as consistent revenue growth and a growing membership base. This performance reflects the company's robust fundamentals and its ability to thrive despite macroeconomic headwinds.
**Expert Analysis:**
Industry analysts are largely bullish on Costco due to its distinct positioning in the retail sector. Unlike many peers, Costco benefits from a focus on essential goods and services, making it less vulnerable to sudden changes in spending patterns. Experts are optimistic about its pricing power, scale advantages, and ability to expand margins through operational innovation, which together enhance its growth trajectory. While some external risks such as rising interest rates and energy costs persist, Costco's defensive characteristics provide substantial protection against volatility in the broader market.
**News Impact:**
Recent economic data points to tightening discretionary spending, which works in Costco's favor given its focus on essential goods. Inflationary conditions further amplify the appeal of the company's bulk purchasing model, while its ability to control operational costs protects margins even in less favorable environments. Meanwhile, ongoing global supply chain concerns and trade tariffs could create modest headwinds, but Costco's scale and efficiency offset these risks to a significant extent.
**Trading Recommendation:**
Costco's strong fundamentals and consistent growth make it an attractive candidate for a long position. The stock demonstrates stable demand and earnings resilience, even in challenging economic environments, backed by its membership model and operational innovations. The outlined price targets offer an excellent risk-reward ratio, with upside expected from continued execution success and strategic initiatives. Investors seeking defensive growth should consider entering long positions at current levels.

COST Daily Chart Analysis: Key Levels, and Price StructureCostco Wholesale Corporation (COST)
Historical Context and Trend Channel:
From September 2024 through early 2025, COST was observed trading within a well-defined upward channel (indicated by the grey shaded areas). This channel represented a consistent bullish trend during that period. However, the price subsequently broke below the lower boundary of this channel around March 2025, suggesting a shift in the established trend.
Key Price Levels Identified:
Strong Support Level (870 to 880): Marked by the light blue shaded zone, this level has historically acted as a robust floor for the price, demonstrating strong buying interest on multiple occasions.
Good Level (930 to 940): The orange shaded area indicates an intermediate support zone. Should the immediate support fail, this level could come into play as the next area of interest for potential buyers.
1st Support (970 to 980): This green shaded area represents the most immediate support level based on recent price action. The price has recently found support within this range.
Key Resistance (1010): The horizontal red line with circled points highlights a critical overhead resistance level. This level has seen prior rejections, making it a significant hurdle for any sustained upward movement. It also appears to act as a potential "neckline" for current price formations.
Target (1060 to 1070): The red shaded zone at the top represents a significant resistance area and a prior peak. If the "Key Resistance -1010" is overcome, this zone could become the next potential target.
Recent Price Action and Pattern Observations:
Following the break from the long-term uptrend channel, COST rallied to form a peak around the "Target 1060 to 1070" zone in May. The subsequent decline from this peak, followed by a bounce and another attempt at the "Key Resistance -1010" level, suggests the formation of a potential "M" top or double top pattern if 1010 holds. More recently, the price has pulled back to test the "1st Support 970 to 980" zone. The current price action around 988.07 indicates that COST is trading between this immediate support and the "Key Resistance -1010" level. The chart illustrates two potential paths (dotted blue lines):
1. A move upward, challenging and potentially breaking above the "Key Resistance -1010" to target the 1060-1070 zone. This would align with a potential bullish "W" pattern formation if the 1st support holds.
2. A decline to retest the "Good Level 930 to 940" before a potential rebound.
The "Key Resistance -1010" level remains pivotal. A sustained break above it could signal further upside, while rejection from this level could lead to a retest of lower support zones.
Disclaimer:
The information provided in this chart is for educational and informational purposes only and should not be considered as investment advice. Trading and investing involve substantial risk and are not suitable for every investor. You should carefully consider your financial situation and consult with a financial advisor before making any investment decisions. The creator of this chart does not guarantee any specific outcome or profit and is not responsible for any losses incurred as a result of using this information. Past performance is not indicative of future results. Use this information at your own risk. This chart has been created for my own improvement in Trading and Investment Analysis. Please do your own analysis before any investments.

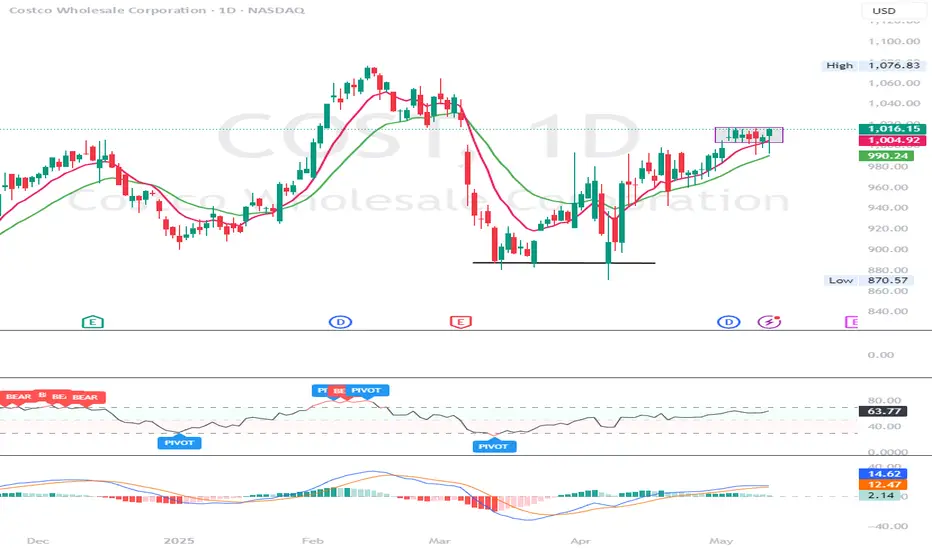
Costco, finally.... greenNASDAQ:COST finally seems to be turning around
if it closes above the 21 EMA and 50 SMA on the daily, it can go back to ATHs
will initiate a position at 1000 and stop at 990/980 depending on size
current targets are 1020 & 1035

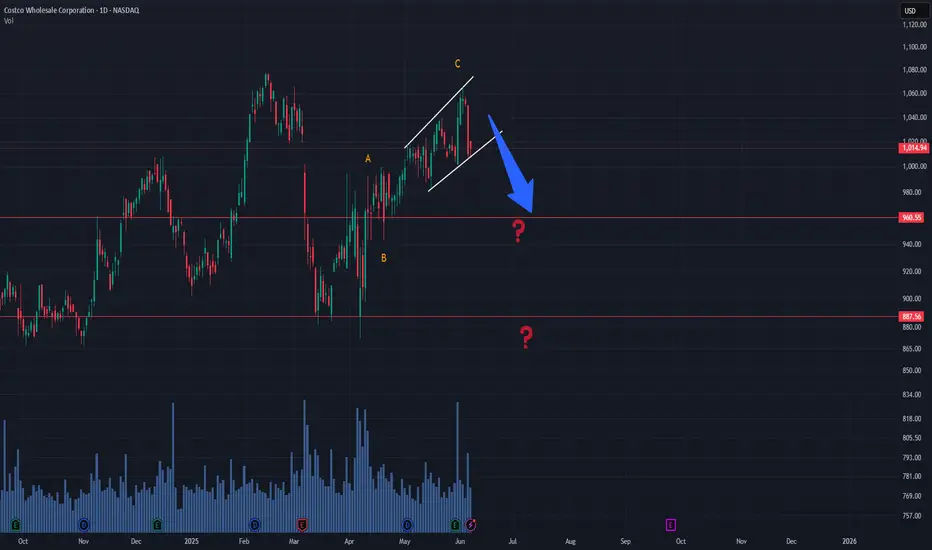
COST ABC Structure CompletedThe ABC correction may have completed, with the final C leg forming inside a diagonal structure. A sharp drop started from $1,066. Traders should wait for a potential corrective reaction before entering a short position.
It's important to note that as long as the diagonal channel remains intact, the zigzag structure can still extend. A clear break below the diagonal would confirm bearish continuation toward the $960 zone.
Costco Wave Analysis – 5 June 2025
- Costco reversed from the resistance zone
- Likely to fall to support level 985.00
Costco recently reversed down sharply from the resistance zone located between the key resistance 1080.00 (which stopped the previous impulse wave 5) and the upper weekly Bollinger Band.
The downward reversal from this resistance zone stopped the earlier weekly impulse wave 5 from April.
Given the strength of the nearby resistance zone and the bearish divergence on the weekly momentum indicator, Costco can be expected to fall to the next support level 985.00.

COST Short – Double Top Rejection with Bearish CCI SignalNASDAQ:COST
📅 Entry: June 5, 2025
📉 Price: 1,055
✋ Stop: 1,078
🎯 Target: 1,013
⚖️ Risk-Reward: 1:2
✅ Status: Target hit earlier than expected
🧠 Trade Idea:
COST tested a major resistance zone at 1,078 — aligning with:
A historical horizontal resistance
The top boundary of a rising channel
Meanwhile, the CCI indicator turned downward, signaling weakening momentum.
A strong bearish daily candle confirmed the entry.
📌 Price dropped quickly to the 1,013 target, completing a clean 1:2 short setup.

Costco (COST) Breakout Alert! Ready to Soar? Costco (COST) Breakout Alert! Ready to Soar?
Hey traders! Check out this bullish setup on Costco Wholesale (COST) . The stock just broke out above key resistance at $987.72 after a solid consolidation phase, with a clear target of $1,052.87 (+4.91% potential gain). The risk-reward ratio here is a juicy 2.47, with a stop at $919.88 to protect against downside.
Why I’m Excited:
Strong momentum with higher highs and higher lows.
Ichimoku Cloud support below, showing bullish trend continuation.
Buy signals (green triangles) aligning perfectly with the breakout.
Trade Plan:
Entry: $1,003.41 (current price)
Target: $1,052.87 (+4.91%)
Stop Loss: $919.88 (-1.99%)
What do you think—bullish or bearish on COST? Drop your thoughts below, like if you’re in on this trade, and share with your trading crew! Let’s get the convo going!
#Costco #Bullish #Breakout #Trading #Investing

Costco readyNASDAQ:COST looks ready to move up to 1100
closed the gap from last earnings
bullish engulfing candle on the weekly and is breaking out of this 3 week range now
if it raises prices like NYSE:WMT did, might see a boost

“Strategic Closure: ZS and COSTCO Delivered as Expected”Today we closed two well-timed trades: Zscaler (ZS) and Costco (COST).
Both were selected using our 20-point technical and fundamental criteria, with entries planned around earnings and macroeconomic momentum (including today’s GDP release).
✅ ZS gave us a solid return of ~$74, boosted by strong revenue growth and an optimistic outlook.
✅ COSTCO, a low-volatility play, added ~$21 to our account thanks to its stable uptrend and reliable fundamentals.
💵 Total gain: ~$95 in under 48 hours.
No leverage, no gambling — just clean execution and strict risk management.
⚠️ This is not financial advice. Just part of my journey as a disciplined trader. I log the wins and the losses. One trade at a time. 🧠📊
"Costco in Focus: Two Catalysts, One Smart Entry"📌 Strategic Entry in Costco (COST): Solid Stock with Immediate Catalysts
Today I entered Costco (COST) by purchasing shares based on our structured methodology of 20 key criteria — combining technical strength, strong fundamentals, and strict risk control. This decision is further supported by two major short-term catalysts.
🔍 Why Costco – and Why Now?
✅ Meets our full 20-point checklist:
Strong uptrend (above MA50 & MA200)
Healthy RSI, not overbought
Consistent volume supporting price action
Fundamental strength: steady growth, recurring revenue via memberships
Clear risk management: no leverage, capital exposure <6%
📈 Catalyst #1: Earnings Today (May 29)
Analysts expect EPS of $4.24 and revenue of $63.1B. Historically, Costco tends to outperform expectations, which may trigger a bullish move.
🌎 Catalyst #2: U.S. GDP Release (Today at 8:30 AM EST)
With forecasts around +2.2%, confirmation would support a strong consumer environment — ideal for retail leaders like Costco.
🧠 Our Execution Plan:
Buying the shares directly (no options, no leverage) to avoid inflated IV risk.
Target zone: $1,040–$1,070 short term.
Trailing stop in place to protect gains post-earnings.
📊 Bottom Line:
This is not speculation — it’s structure. Costco offers a rare alignment of solid fundamentals, technical confirmation, and immediate macro + micro catalysts.
Strategy on. Emotions off.
📌 Disclaimer:
This content is for informational and educational purposes only. It does not constitute financial advice, investment recommendations, or a solicitation to buy or sell any securities. Always do your own research or consult with a licensed financial advisor before making investment decisions.

$COST earnings short, possible uptrend selloff(Sorry for mobile charts/posts)
NASDAQ:COST Hello, looking at multiple time frames on Costco I am going to take a stab at a short. This name isn’t unfamiliar with big moves so an 8% to 10% move could take place here on earnings forecast. Granted, they could not divulge any details but I think that wouldn’t be good and amidst the tariff rhetoric which has been the narrative for retail names could add headwind. 6/6 $900p is what I will take a stab at. 1 contract will suffice as there could be a good R/R especially if you hedge. If you look at the Monthly chart this thing is bought up heavily. I am going to try and get a good entry so I’m not risking what I may feel is too much on an earnings “lotto.” $100-$150 on a contract will be good in my book.
WSL

Costco Wave Analysis – 20 May 2025- Costco broke resistance level 1020.00
- Likely to rise to resistance level 1080.00
Costco recently broke the resistance level 1020.00, which stopped the previous waves 1 and (b), as can be seen from the daily Costco chart below.
The breakout of the resistance level 1020.00 accelerated the active impulse waves 3 and (3).
Given the clear daily uptrend, Costco can be expected to rise to the next resistance level 1080.00 (former monthly high from February and the target price for the completion of the active impulse wave 3).

COST - breakout above $1020 steady uptrendCOST - stock in an steady uptrend but now consolidating and holding support well. Looking for calls on this one above $1020 for a breakout move higher. Next resistance at $1050 and $1075. Stock is strong on indicators. Stock has earnings end of the money could see $1110 pre earnings.
COSTCO: 4 touches/rejections. Can we pop over gap?Costco looks loaded.
4 touches along the resistance, looks like a big wedge forming. Next touch can be a break out to upside, fill gap and move with momentum upside.
OR
Green ray for the entry to downside. We got data tomorrow as well..
Do your DD! Not FA but let me know what you think!

Base Case Costco 810. Total company revenues were up 6% compared to a year ago. The Profit Margin of 2.9% was better than the longer-term average of 2.5%. A 90x multiple applied to a Sales Growth Rate of 9% would imply a share price 810. Costco's narrative revolves around execution. Considering the company continues to execute and deliver top-line growth, the stock will be rewarded in some form.

$COST Rising WedgeCost perfectly tagged the upper line of the rising wedge that we have seen play out over the past couple of weeks. I opened some puts at the top today in hopes that it breaks to the downside of this wedge for a target around $900. This would also complete the right shoulder of H&S on daily chart.
