CISCO - buy zone (gray) Hello traders,
Description of the analysis:
CISCO support zones ideal for timing long positions (gray). Trade what you understand, trade carefully and sparingly according to the business plan.
About me:
Hi, my name is Jacob Kovarik and I´m trading on stock exchange since 2008. I started with a capital of 3000 USD. My first strategy was based on OTM options. (American stock index and their ETF ). I´ve learnt on my path that professional trading is based on two main fundaments which have to complement each other, to make a bussiness attitude profitable. I´ve tried a lot of techniques and many manners how to analyze the market. From basic technical analysis to fundamental analysis of single title. My analytics gradually changed into professional attitude. I work with logical advantages of stock exchange (return of value back to average, volume , expected volatility , advantage of high stop-loss, the breakdown of time in options, statistics and cosistent thorough control of risk). At the moment, my main target is ITM on SPM index. Biggest part of my current bussiness activity comes from e mini futures (NQ, ES). I´m trader of positions. I´m from Czech republic and I take care of a private fund ($4.000.000 USD). During my career I´ve earned a lot of valuable experience, such as functionality of strategies and what is more important, control of emotions. Professional trading is, in my opinion, certain kind of mental training and if we are able to control our emotions, accomplishment will show up. I will share with you my analysis and trades on my profile. I wish to all of you successul trades.
Jacob
4CSCO trade ideas


Short Cisco till 30 USDForce index indicates that the last couple 1 hours sessions do not have a strong volume support behind. Approaching the the pricing where there is even lower volume, the stock is bound to fall through until it hits the first support . RSI indicates that is oversold , nevertheless, there is no evident sign that the indicator will be bouncing back out of that territory. Overall, the volume has played a big part in this analysis

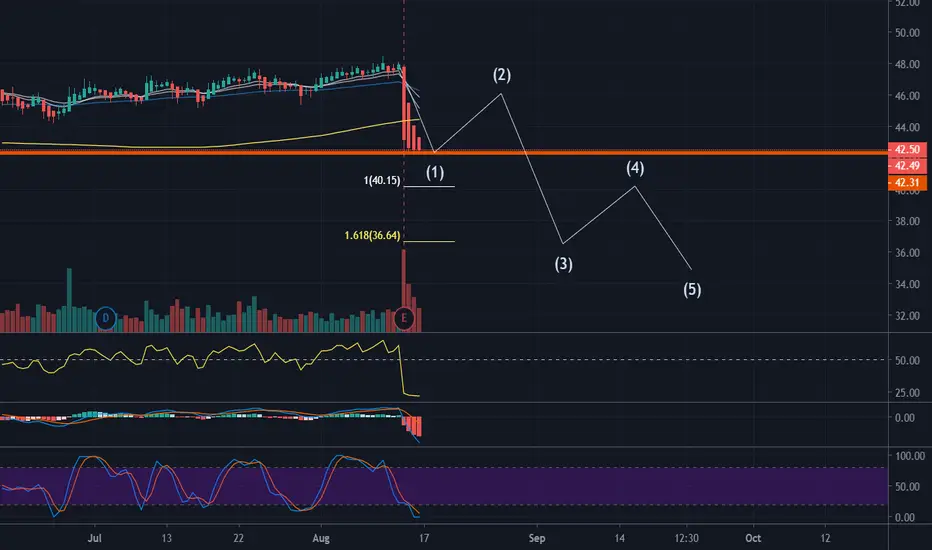
Cisco: NO likey, no beunoBearish.... bearish impulse wave will look like this... unless they get good PR to stop the bleed
Daily and weekly suggest its not over yet...
Cisco Long Here... Should be fairly straightfoward..Go Long Here. Included my personal stop & target. $CSCO

CSCO- Good Buy CurrentlyFA:
Higher earnings than expected but still a 12% yearly fall.
Service Sector of Business Has grown much larger than the Hardware side
If COVID is to ease in the next 6-9 months, the forecast is positive for CSCO
TA:
Approaching Support Level after strong retracement
Downside is far less than upside if an entry was made in this area.
Fibonacci Retracements follow the S&R Lines.
-Megalodon
Please SHARE/LIKE & Comment and PS:Please follow responsible trade management, this is not financial advice

Trend change for Cisco SystemsA large gap down breaks the upward sloping trend line, causes the GoNoGo Trend to flag a new color and pushes the GoNoGo Oscillator further into negative territory.
The GoNoGo Trend has changed for Cisco Systems, painting an amber, neutral bar, showing us that the “Go” trend has for now, ended.
At the same time, the move has caused the GoNoGo Oscillator to crash below the zero line, signaling that momentum has not just cooled, it has turned against the technology services company.

V Bottom Ascending Triangle Earnings today AMC Possible stop under 41.3
Earnings this afternoon
Not a recommendation
Expecting a Solid Q3 Earnings ReportCisco has consistently beaten estimates for the past few Quarters and I expect the upcoming one to be no different. This alone should be enough to bump it up to a target of 50$. All technical indicators also support this price target.


Ascending triangle on CSCOCSCO looks to have a bullish trend leading up to its Aug 12 earnings report

CSCO bullish move before earningsUpcoming Events:
Earnings Aug 12 after market close
Overview:
CSCO is apart of S&P 500 Index. The index is currently closing the gap from Feb. Closing this gap could lead to greater than normal moves to upside or downside
CSCO appears to have established a short term range and is showing bullish signs of breaking that range
Entry:
Target price: 47.67
RSI >50
Volume cross average
Stop Loss:
Previous day candle low 47.04
Target Profits (Scale out):
Based on previous resistance points
1st 48.27
2nd 48.89
3rd 49.53

CISCOCISCO is entering overbought territory on the RSI and hitting its key resistance. Could see a dump then a chance to buy or a dump/sideways movement
MACD indicators are close but have not changed direction or touched yet
SD of 1.5 has been broken on todays chart but price action shows uptrend

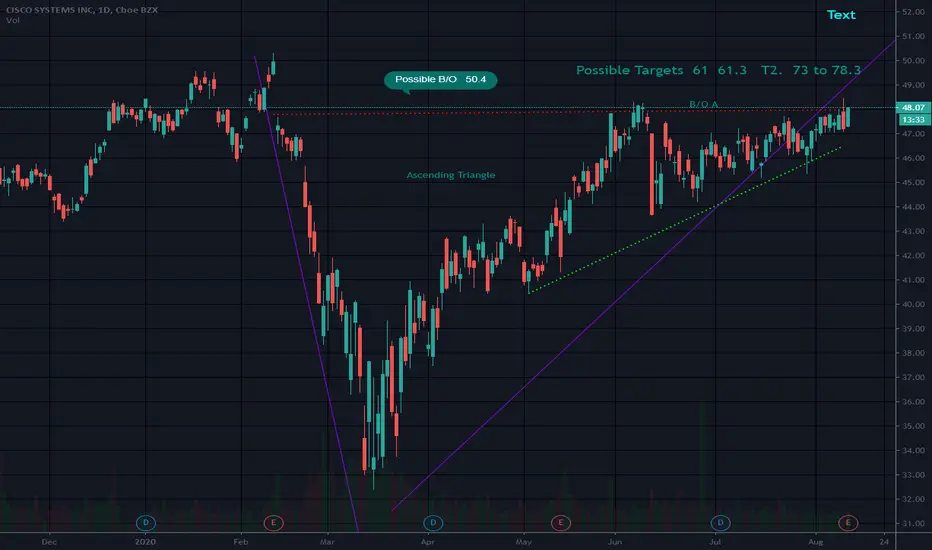
CSCO: Ascending TriangleAscending Triangle
Pros
Descending volume
R/R ratio above 13
PPS above 50MA and 200MA
250RSI above 50
Cons
ATR descending
200MA Flat
If confirmed
PT1 = 49,21
PT2 = 52,06
PT3 = 54,08
PT4 = 56,65
PT5 = 58,12
PT6 = 63,52


Technical view of cisco Hello every one
Cisco stock is moving in a short-term sideway direction.
With low volumes.
Between 48.5 and 44 levels.
Therefore it is possible to trade between the two levels.
Good luck .


#weekendchartreading $CSCO #cisco decision time comingchart to watch for coming week.
The lines speak from themselves
A breakout or a breakdown coming ??
What do you think ?
