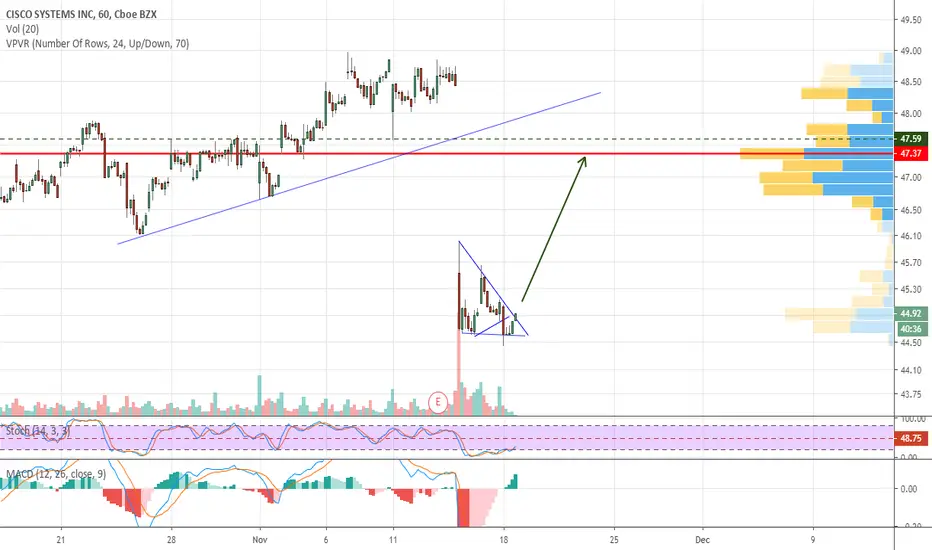
Bull flag for the retracement/ back testOversold. Overall market is unstoppably bullish with the Fed's non QE POMO policy. Looking for a bounce up to about the 47.37 VBP line. I expect it up to $48 by next week.
4CSCO trade ideas
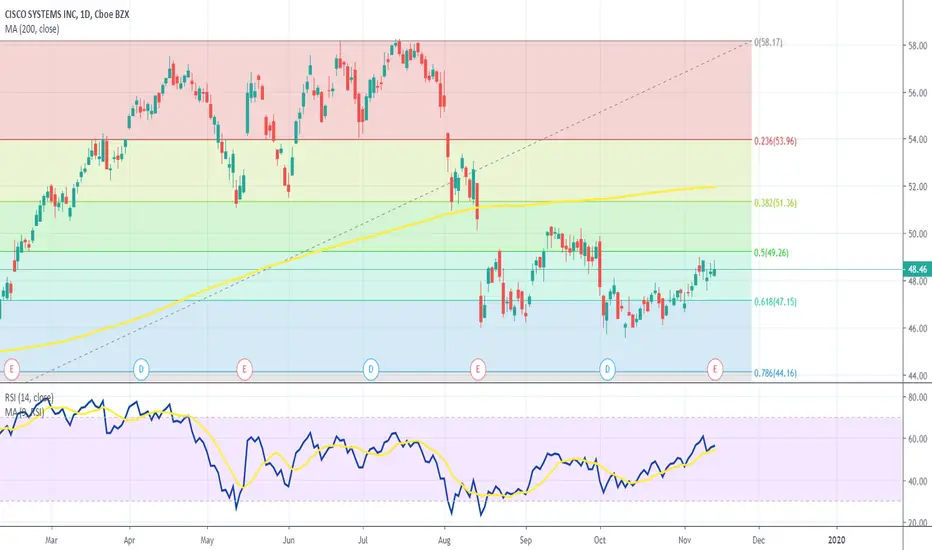
Cisco: Buy opportunity for 54.00.Cisco nose dived on last week's closing sessions with 1D turning aggressively bearish (RSI = 34.865, MACD = -0.320, Highs/Lows = -2.0286). The stock may be well below its July's High but there is a technical pattern that presents the current 45.00 level as an optimal medium term buy opportunity.
In 2012 we had a similar price action, which following a Death Cross on 1D, made a bottom on a symmetrical Higher Low Support and initiated the new multi-month buy sequence. We are on an identical price action at the moment and with the RSI hitting the same bounce level we believe Cisco is near a bottom (even symmetrical as seen on the chart). 54.00 appears to be a reasonable long target for the first months of 2020.
** If you like our free content follow our profile (www.tradingview.com) to get more daily ideas. **
Comments and likes are greatly appreciated.

Cisco long opportunityJust drew support and resistance levels and looks like it's a perfect time for opening long CSCO position.


CSCO Trade ZonesOrange is shorter term resistance zone
Red is longer time resistance zone
Yellow is shorter term support zone
Greens are longer term support zone
Orange/red zones are good exit ranges for longs, or short entry zones.
Yellow/Greens are good entry points for longs, or short targets.
Theres a lot of trade possibilities off these levels here but a lot of it depends on how it plays out going forward.

CSCOSystem T Performances: Annual Compound Profit 40%, Win Rate 55%, Risk/Reward Ratio 1:2, 20 Years of Backtesting Data, Over 100 Markets.
* Click Like and Follow to Support My Work!
---
Hi Traders,
I'd like to introduce the System T, a computerized trading system that analyzed and backtested the 20 years history data of over 100 markets.
This post is my sharing of how I think about systematic trading and the signals generated by the System T.
(This is my opinion only, NOT the financial advice.)
I think that for the system to open a trade and manage risk, it only needs a buy signal & a stop-loss signal clearly on the chart.
Once the system finds a good trend, it will ride it as long as possible. The stop-loss will be adjusted accordingly to the new price movement.
(Remember to follow this trade idea and follow my profile to get updates about the stop-loss adjustment and sell signal based on the latest price and market conditions daily.)
System T performances above will give you an idea of how it performs in the last 20 years.
Notice that this result was achieved only if I strictly followed the rule: "Only and Always Buy & Sell based on the System Signals".
Don't sell when there is no sell signal as we all want to follow the good trends til the end like everything in life does. \(^-^)/
Also, my system is extremely diversified through over 100 markets so that it only risks less than -1% of the total capital per trade.
Thank you and good luck!
---
DISCLAIMER:
I am NOT a financial advisor, and nothing I say is meant to be a recommendation to buy or sell any financial instrument.
My views are general in nature and I am not giving financial advice. You should not take my opinion as financial advice. This is my opinion only.
Do your own due diligence, and take 100% responsibility for your financial decisions.
Trading and investing are risky! Don't invest money you can't afford to lose, because many traders and investors lose money. There are no guarantees or certainties in trading.
- Content is for education purposes only, not investment advice.
- Trading involves a high degree of risk.
- We’re not investment or trading advisers.
- Nothing we say is a recommendation to buy or sell anything.
- There are no guarantees or certainties in trading.
- Many traders lose money. Don’t trade with money you can’t afford to lose.


Is CISCO exhausted from selling pressure?LONG - CSCO
SL: 46.60 (Suggested by our algorithmic systems)
SL: 45.24 (Safer option, personal suggestion)
TP: 49.60
Reasons behind this idea:
1. Resistance trendline is subjectly broken.
2. Clear bullish divergence on MACD indicator.
3. Bullish divergence on Stochastic indicator.
Caution: Earnings Report is due in a few days.
---------- Chart Drawings ----------
Red Dotted Line: Broken Resistance Trendline
Purple Line: Suggested Stoploss by our algorithmic systems (under testing)
Pink Line: Personal Stoploss Recommendation
Green Line: Suggested Take Profit
Green Arrow: Bullish Divergence
Please trade responsibly and good luck!


CISCO - DAILYHi, today we are going to talk about CISCO
We observe a D1, some important points. The details are highlighted above.
Thank you for reading and leave your comments if you like.
Join the Traders Heaven today, for more exclusive contents!
Link bellow!
Disclaimer: All content of Golden Dragon has only educational and informational purposes, and never should use it as financial advice

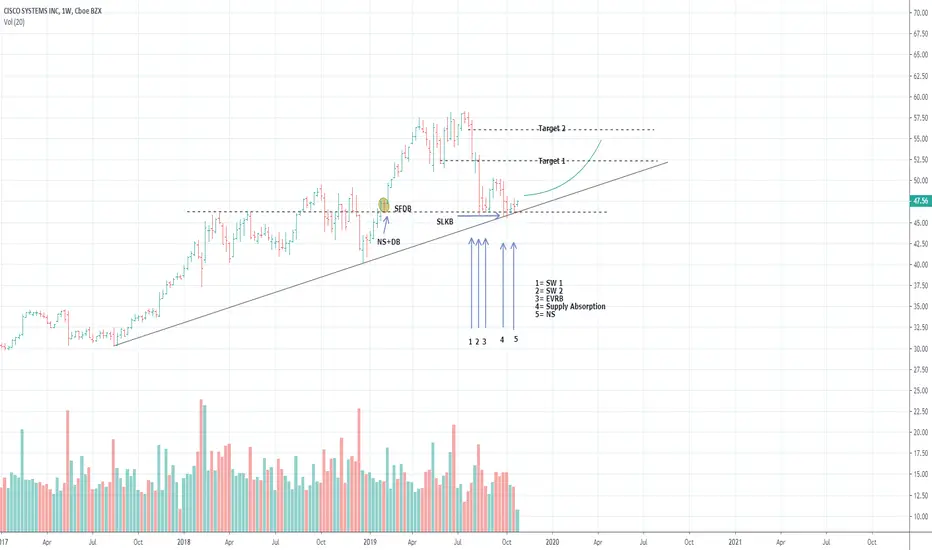
Cisco Showing StrengthAs per the Chart
Abbreviations;
ND=No demand
NS= No supply
DW= Demand Wave
RFSB= Resistance from Supply Bar
SFDB support from Demand Bar
SLK= Stop Loss killer
SLKB= Stop Loss Killer Bottom
DB= Demand Bar
SB= Supply Bar
EVRB= effort vs Result Bottom
My Mentors and Inspiration
Volume Analysis - Oleg Alexandrov
Money and risk Management - Dmitriy Lavrov-

Good trade for a 4% Return on CSCO Great buy on a reputable company CSCO for an easy 4% return. Received confirmation on the 15 minute chart for a push up to $50.00.


CSCO Heavy Dark Pool Quiet Rotation™The increase in Dark Pool Quiet Rotation™ as Buy Side Institutions lower inventories of CSCO shares has weighed heavily on the stock price in the past few weeks. This does not bode well for the CSCO earnings report.

CSCO - DAY TRADEHi, today we are going to talk about CSCO and in a Day Trade opportunity.
We observe a 15m chart, some important points such as supports and resistances (and levels of strength) to the Day Trade. The details are highlighted above.
Thank you for reading and leave your comments if you like.
Join the Traders Heaven today, for more exclusive contents!
Link bellow!
Disclaimer: All content of Golden Dragon has only educational and informational purposes, and never should use it as financial advice

$CSCO Cisco has hit major support, Reversal trade.Entry level $47 = Price Target $57 = Stop loss $45.
P/E 18
Yield 2.98%
Average analysts price target $55.57 | Overweight.
Cisco is exposed to security and the roll out of 5G, the 2 hottest sectors, which should drive growth in this old tech stalwart for the next decade.
Its well valued and Safe.
Company profile
Cisco Systems, Inc. engages in the design, manufacture, and sale of Internet Protocol based networking products and services related to the communications and information technology industry. The firm operates through the following geographical segments: the Americas, EMEA, and APJC. Its product comprises of the following categories: Switches, Routers, Wireless, Network Management Interfaces and Modules, Optical Networking, Access Points, Outdoor and Industrial Access Points, Next-Generation Firewalls, Advanced Malware Protection, VPN Security Clients, Email, and Web Security. The company was founded by Sandra Lerner and Leonard Bosack on December 10, 1984 and is headquartered in San Jose, CA.

$CSCO SHORT TARGETING 44 REMAINED BEARISH COULD DROP TO 40Broke raising channel for second time . should be deep bearish but we put close goal at 44 which around 5 % drop check previous analysis


CSCO Stalls at Resistance with Rising RotationCSCO had heavier Dark Pool Quiet Rotation™ in recent weeks. A High Frequency Traders Gap Down on Spiking Volume occurred earlier. The stock is holding near the gap down area.
