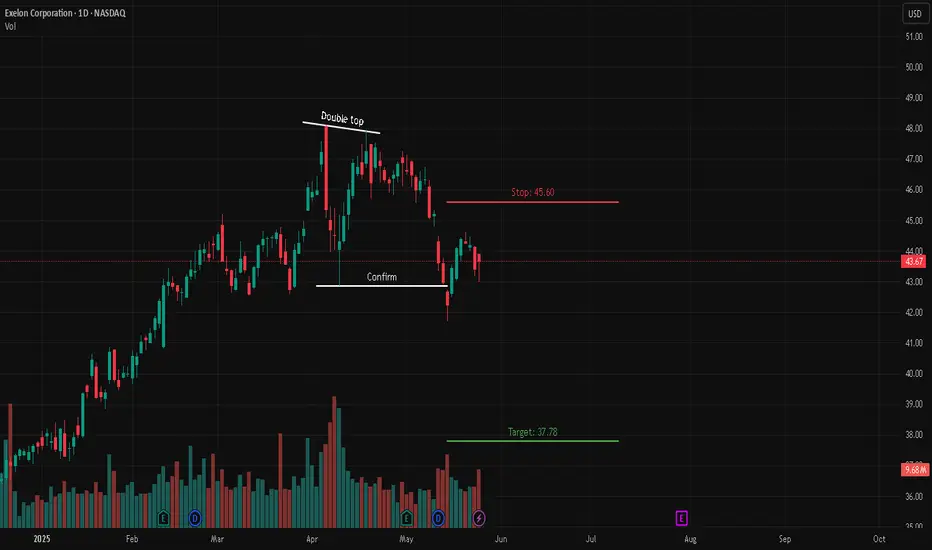
Exelon Corporation (EXC) – Double Top Breakdown📉 Short Setup
🔍 Description:
Exelon Corporation (NASDAQ: EXC) has formed a Double Top pattern , signaling a bearish reversal. The price has broken below the neckline, confirming downside pressure. Current consolidation below the breakdown point suggests continuation lower, with a clear risk-de
Next report date
—
Report period
—
EPS estimate
—
Revenue estimate
—
2.495 EUR
2.38 B EUR
22.24 B EUR
1.01 B
About Exelon Corporation
Sector
Industry
CEO
Calvin G. Butler
Website
Headquarters
Chicago
Founded
1999
FIGI
BBG00PG1KVM9
Exelon Corp. is a utility services holding company, which engages in the energy distribution and transmission businesses. It operates through the following segments: Commonwealth Edison Company, PECO Energy Company, Baltimore Gas and Electric Company, Potomac Electric Power Company, Delmarva Power and Light Company, and Atlantic City Electric Company. The company was founded on February 4, 1999 and is headquartered in Chicago, IL.
Related stocks
$EXCGreen: Entry Point
Blue: Start of Week
Red: End of Week
Thumbs Up: Trade Available for Week
Numbers: Price Targets
*For share traders only. Not meant for options.

EXC LONG POSITIONHi traders,
As we can see from the chart on a weekly basis , there is a formation of a falling wedge starting from middle of 2022 . The price is inside the falling wedge formation and we are expecting the break out . The target is shown on the chart .Enter the long position only if the breakout occu

EXC - EXELON - time to look for long nowDear traders,
Id like to share this idea in order to take long positions
30- 33$ is is a good price range to look for buying opportunities.
Additionally RSI is clearly oversold and prices already went down quite aggressive.
best,
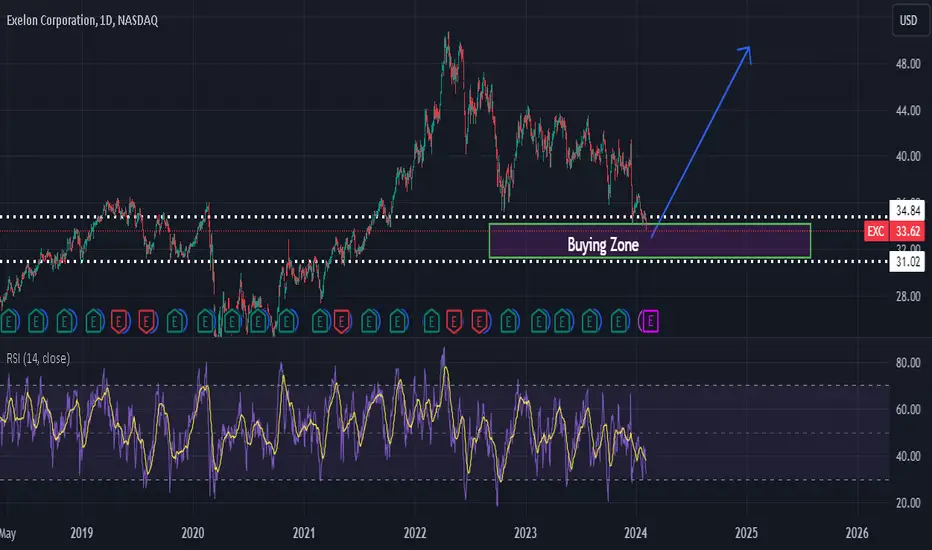
EXC - Exelon - longDear traders,
Looking for buying positions in Exelon are a good option if you are up to hold them in your portfolio, is is in a nice price area around 30 -35$.
buy and hold
best all,

Exelon CorporationExelon Corporation is one of the nation's largest electric utilities. The company has one of the industry's largest portfolios of electricity generation capacity, with a nationwide reach and strong positions in the Midwest and Mid-Atlantic.
Exelon (Nasdaq: EXC) is a Fortune 250 company and the nati

EXC: completing the V-shape correction?1. V-Shape Correction:
A standout feature in the recent price movement is the V-shape correction. This formation often indicates a sharp reversal in trend. After a swift drop, the price has recovered with equivalent vigour, suggesting a possible change in sentiment among traders and investors.
2. 2

Excelon Corporation longExcelon Corporation (EXC) is traded bellow down slopping resistance, however horizontal support is being respected since beginning of 2023. Price is approaching a support line marked on a chart.
Entry point: Consider entering a long position when the price reach recommended entry price: 39.35.
Stop

Exelon Complex Inverted H&S PatternExelon is seeing gains with the energy sector as oil moves higher this week. Price has formed a complex inverted H&S pattern with price recently coming up off a second right shoulder and is currently testing the neckline. Price is currently trading above all MAs(8,21,34,50,100,200) and the shorter

EXC Long after huge down momentumNASDAQ:EXC is coming to a strong resistance level at about 39.00. In the past, we often had reversals in this zone. After the big momentum, the probability of a correction is high.

See all ideas
Summarizing what the indicators are suggesting.
Neutral
SellBuy
Strong sellStrong buy
Strong sellSellNeutralBuyStrong buy
Neutral
SellBuy
Strong sellStrong buy
Strong sellSellNeutralBuyStrong buy
Neutral
SellBuy
Strong sellStrong buy
Strong sellSellNeutralBuyStrong buy
An aggregate view of professional's ratings.
Neutral
SellBuy
Strong sellStrong buy
Strong sellSellNeutralBuyStrong buy
Neutral
SellBuy
Strong sellStrong buy
Strong sellSellNeutralBuyStrong buy
Neutral
SellBuy
Strong sellStrong buy
Strong sellSellNeutralBuyStrong buy
Displays a symbol's price movements over previous years to identify recurring trends.
EXC4997163
Baltimore Gas and Electric Company 2.9% 15-JUN-2050Yield to maturity
7.15%
Maturity date
Jun 15, 2050
EXC5234879
Commonwealth Edison Company 2.75% 01-SEP-2051Yield to maturity
7.07%
Maturity date
Sep 1, 2051
EXC4882345
Baltimore Gas and Electric Company 3.2% 15-SEP-2049Yield to maturity
6.99%
Maturity date
Sep 15, 2049
EXC4996639
PECO Energy Company 2.8% 15-JUN-2050Yield to maturity
6.97%
Maturity date
Jun 15, 2050
EXC4953842
Commonwealth Edison Company 3.0% 01-MAR-2050Yield to maturity
6.95%
Maturity date
Mar 1, 2050
EXC5141390
PECO Energy Company 3.05% 15-MAR-2051Yield to maturity
6.93%
Maturity date
Mar 15, 2051
EXC4880173
PECO Energy Company 3.0% 15-SEP-2049Yield to maturity
6.89%
Maturity date
Sep 15, 2049
EXC5254544
PECO Energy Company 2.85% 15-SEP-2051Yield to maturity
6.88%
Maturity date
Sep 15, 2051
EXC5142432
Commonwealth Edison Company 3.125% 15-MAR-2051Yield to maturity
6.83%
Maturity date
Mar 15, 2051
EXC4908181
Commonwealth Edison Company 3.2% 15-NOV-2049Yield to maturity
6.73%
Maturity date
Nov 15, 2049
EXC4394477
Baltimore Gas and Electric Company 3.5% 15-AUG-2046Yield to maturity
6.68%
Maturity date
Aug 15, 2046
See all 4EXC bonds
Frequently Asked Questions
The current price of 4EXC is 37.275 EUR — it has increased by 0.01% in the past 24 hours. Watch EXELON stock price performance more closely on the chart.
Depending on the exchange, the stock ticker may vary. For instance, on EUROTLX exchange EXELON stocks are traded under the ticker 4EXC.
4EXC stock has risen by 0.40% compared to the previous week, the month change is a 2.17% rise, over the last year EXELON has showed a 9.96% increase.
We've gathered analysts' opinions on EXELON future price: according to them, 4EXC price has a max estimate of 44.27 EUR and a min estimate of 31.50 EUR. Watch 4EXC chart and read a more detailed EXELON stock forecast: see what analysts think of EXELON and suggest that you do with its stocks.
4EXC reached its all-time high on Jan 31, 2022 with the price of 51.250 EUR, and its all-time low was 28.200 EUR and was reached on Mar 23, 2020. View more price dynamics on 4EXC chart.
See other stocks reaching their highest and lowest prices.
See other stocks reaching their highest and lowest prices.
4EXC stock is 0.01% volatile and has beta coefficient of −0.01. Track EXELON stock price on the chart and check out the list of the most volatile stocks — is EXELON there?
Today EXELON has the market capitalization of 37.81 B, it has decreased by −0.51% over the last week.
Yes, you can track EXELON financials in yearly and quarterly reports right on TradingView.
EXELON is going to release the next earnings report on Jul 31, 2025. Keep track of upcoming events with our Earnings Calendar.
4EXC earnings for the last quarter are 0.85 EUR per share, whereas the estimation was 0.81 EUR resulting in a 4.87% surprise. The estimated earnings for the next quarter are 0.31 EUR per share. See more details about EXELON earnings.
EXELON revenue for the last quarter amounts to 6.21 B EUR, despite the estimated figure of 6.03 B EUR. In the next quarter, revenue is expected to reach 4.57 B EUR.
4EXC net income for the last quarter is 839.30 M EUR, while the quarter before that showed 624.99 M EUR of net income which accounts for 34.29% change. Track more EXELON financial stats to get the full picture.
Yes, 4EXC dividends are paid quarterly. The last dividend per share was 0.36 EUR. As of today, Dividend Yield (TTM)% is 3.55%. Tracking EXELON dividends might help you take more informed decisions.
EXELON dividend yield was 4.04% in 2024, and payout ratio reached 61.98%. The year before the numbers were 4.01% and 61.67% correspondingly. See high-dividend stocks and find more opportunities for your portfolio.
As of Jul 26, 2025, the company has 20.01 K employees. See our rating of the largest employees — is EXELON on this list?
EBITDA measures a company's operating performance, its growth signifies an improvement in the efficiency of a company. EXELON EBITDA is 7.72 B EUR, and current EBITDA margin is 34.31%. See more stats in EXELON financial statements.
Like other stocks, 4EXC shares are traded on stock exchanges, e.g. Nasdaq, Nyse, Euronext, and the easiest way to buy them is through an online stock broker. To do this, you need to open an account and follow a broker's procedures, then start trading. You can trade EXELON stock right from TradingView charts — choose your broker and connect to your account.
Investing in stocks requires a comprehensive research: you should carefully study all the available data, e.g. company's financials, related news, and its technical analysis. So EXELON technincal analysis shows the neutral today, and its 1 week rating is sell. Since market conditions are prone to changes, it's worth looking a bit further into the future — according to the 1 month rating EXELON stock shows the sell signal. See more of EXELON technicals for a more comprehensive analysis.
If you're still not sure, try looking for inspiration in our curated watchlists.
If you're still not sure, try looking for inspiration in our curated watchlists.