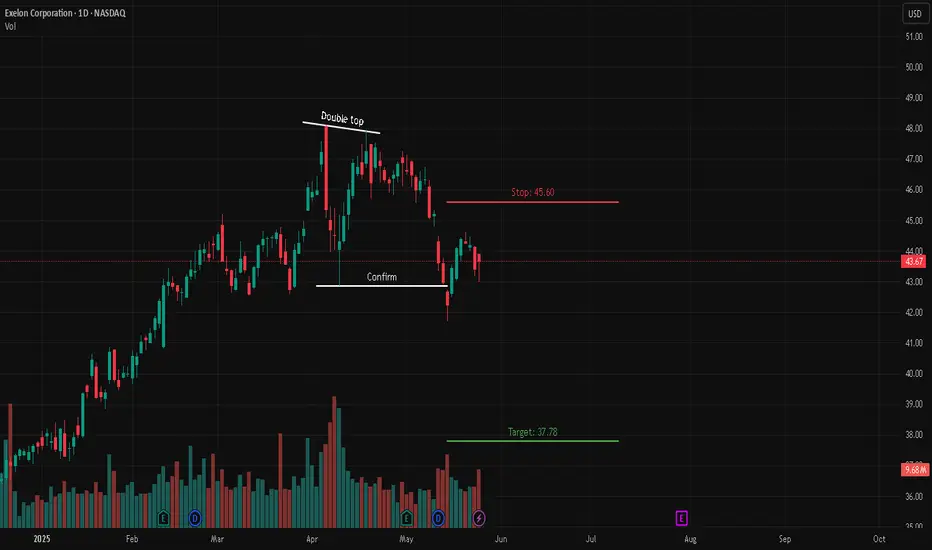
Exelon Corporation (EXC) – Double Top Breakdown📉 Short Setup
🔍 Description:
Exelon Corporation (NASDAQ: EXC) has formed a Double Top pattern , signaling a bearish reversal. The price has broken below the neckline, confirming downside pressure. Current consolidation below the breakdown point suggests continuation lower, with a clear risk-defined setup.
📊 Trade Details:
🔹 Entry: Below neckline confirmation
🔴 Stop Loss: 45.60
🟢 Target: 37.78
📌 Confirmation:
Neckline break on increased volume confirms bearish intent. If price reclaims and holds above the neckline, the setup could be invalidated.
Trade safe! 📉🚨
4EXC trade ideas
$EXCGreen: Entry Point
Blue: Start of Week
Red: End of Week
Thumbs Up: Trade Available for Week
Numbers: Price Targets
*For share traders only. Not meant for options.

EXC LONG POSITIONHi traders,
As we can see from the chart on a weekly basis , there is a formation of a falling wedge starting from middle of 2022 . The price is inside the falling wedge formation and we are expecting the break out . The target is shown on the chart .Enter the long position only if the breakout occurs.

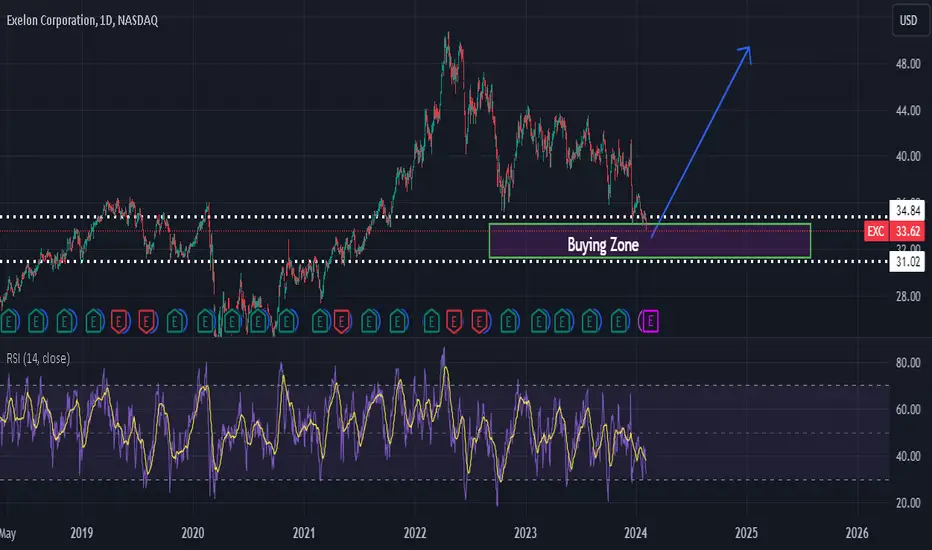
EXC - EXELON - time to look for long nowDear traders,
Id like to share this idea in order to take long positions
30- 33$ is is a good price range to look for buying opportunities.
Additionally RSI is clearly oversold and prices already went down quite aggressive.
best,
EXC - Exelon - longDear traders,
Looking for buying positions in Exelon are a good option if you are up to hold them in your portfolio, is is in a nice price area around 30 -35$.
buy and hold
best all,

Exelon CorporationExelon Corporation is one of the nation's largest electric utilities. The company has one of the industry's largest portfolios of electricity generation capacity, with a nationwide reach and strong positions in the Midwest and Mid-Atlantic.
Exelon (Nasdaq: EXC) is a Fortune 250 company and the nation’s largest utility company, serving more than 10 million customers through six fully regulated transmission and distribution utilities:
1. Atlantic City Electric (ACE)
2. Baltimore Gas and Electric (BGE)
3. Commonwealth Edison (ComEd)
4.Delmarva Power & Light (DPL)
5. PECO Energy Company (PECO)
6. Potomac Electric Power Company (Pepco).
More than 19,000 Exelon employees dedicate their time and expertise to supporting our communities through reliable, affordable, and efficient energy delivery, workforce development, equity, economic development, and volunteerism
Exelon is a critical company that contributes to the prosperity of all sectors of the American economy through connecting and powering businesses.

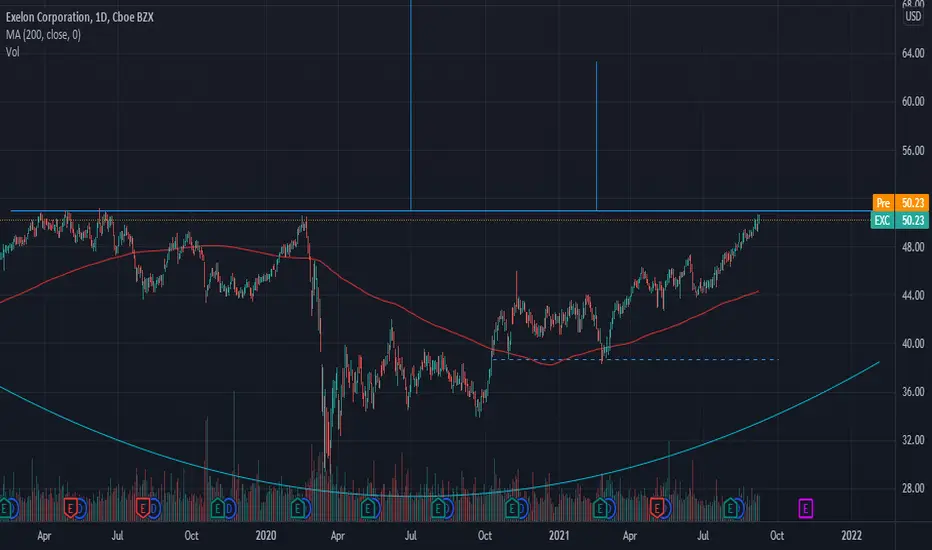
EXC: completing the V-shape correction?1. V-Shape Correction:
A standout feature in the recent price movement is the V-shape correction. This formation often indicates a sharp reversal in trend. After a swift drop, the price has recovered with equivalent vigour, suggesting a possible change in sentiment among traders and investors.
2. 200-Day Moving Average:
The stock has had significant interactions with the 200-day moving average, a vital indicator for gauging long-term trends. Currently, the price is below this average, which could act as a resistance level in the immediate term.
3. Fibonacci Retracement Levels:
Currently, the stock is oscillating near the 50.0% retracement level. The area around the 61.8% retracement is marked as "increase exposure around 41.00," indicating that this could be a strategic level to monitor for trade entries or adjustments.
4. Target and Stop Levels:
A bullish target is set at $42.00, presenting a potential upside of +5.4%. On the flip side, a stop is suggested at $39.00, indicating a potential risk of -2.1%. With a win/loss ratio of 2.8:1, the potential reward outweighs the potential risk by nearly threefold, presenting a favourable scenario for those with a bullish outlook.
Conclusion:
Exelon Corporation's chart paints a picture of recovery following a sharp decline. The V-shape correction, combined with interactions at key Fibonacci levels, suggests potential opportunities for traders. However, the 200-day moving average might act as a near-term resistance.

Excelon Corporation longExcelon Corporation (EXC) is traded bellow down slopping resistance, however horizontal support is being respected since beginning of 2023. Price is approaching a support line marked on a chart.
Entry point: Consider entering a long position when the price reach recommended entry price: 39.35.
Stop loss: Place stop loss below support line. Recommended stop loss value : 38.70.
Take Profit 1: 42.70.

Exelon Complex Inverted H&S PatternExelon is seeing gains with the energy sector as oil moves higher this week. Price has formed a complex inverted H&S pattern with price recently coming up off a second right shoulder and is currently testing the neckline. Price is currently trading above all MAs(8,21,34,50,100,200) and the shorter MA's are crossing above the longer MAs indicating a shift to bullish price trend.
The lower PPO indicator is showing the green PPO line rising above the purple signal line which is also rising, and indicates short-term bullish momentum. Both lines trending above the 0 level indicates intermediate to long-term bullish momentum.
The lower TDI indicator shows a rising green RSI line which just recently crossed above the 60 level and indicates a short-term bullish trend. The green RSI line is above the purple signal line and is currently trading outside of the upper Bollinger Band which is a bullish signal and you want to stay long while the RSI line is above the upper Bollinger Band... but caution is warranted because price tends to correct after the RSI falls back below the upper band.
Should price break up above the neckline it would be bullish going forward and start to validate the complex inverted H&S pattern. At current levels we'd be watching for a close and open above the neckline around the $43 area. Taking a measured move from the head to neckline we get $11. This $11 would then be added to breakout level of $43 which gives us a projected price target near $44.
My buy price on this trade is $42.17.
My stop-loss is currently set at $39.55.
Risk/loss on the trade is roughly -4%.
Potential gain is roughly +22%.

EXC Long after huge down momentumNASDAQ:EXC is coming to a strong resistance level at about 39.00. In the past, we often had reversals in this zone. After the big momentum, the probability of a correction is high.

EXC 40 WMA and resistance rejectionHey folks, Merry Christmas! Here is a nice little present for you :)

Exelon/ComED/ConED: Targeting 1.618 Completion of Bearish AB=CDComED is on the edge of completing the 1.618 extension of this Perfect Bearish AB=CD:
So long as it can hold above the 1.13 everything should be fine. I will be playing this via options by buying some calls in the $40s that are a couple months out and when the 1.618 is hit i will consider flipping my position.

$EXC (30 Minute Levels)We can see if $EXC goes down it is headed for weekly support...potential pressure point.

$EXC (Weekly Timeframe)Leader from the Utilities Group (strongest downtrending group today) - The moving averages appear what I like to call "stacked" in the bears favor. A look at the volume shows it extremely low at this time with recent major points of inflection to favor the short side of volume.

$EXC with a Bullish outlook following its earnings #Stocks The PEAD projected a Bullish outlook for $EXC after a Negative over reaction following its earnings release placing the stock in drift C with an expected accuracy of 100%.

$EXC with a Bullish outlook following its earnings #Stocks The PEAD projected a Bullish outlook for $EXC after a Positive over reaction following its earnings release placing the stock in drift B with an expected accuracy of 60%.


$EXC with a Bullish outlook following its earnings #Stocks The PEAD projected a Bullish outlook for $EXC after a Positive over reaction following its earnings release placing the stock in drift B with an expected accuracy of 75%.

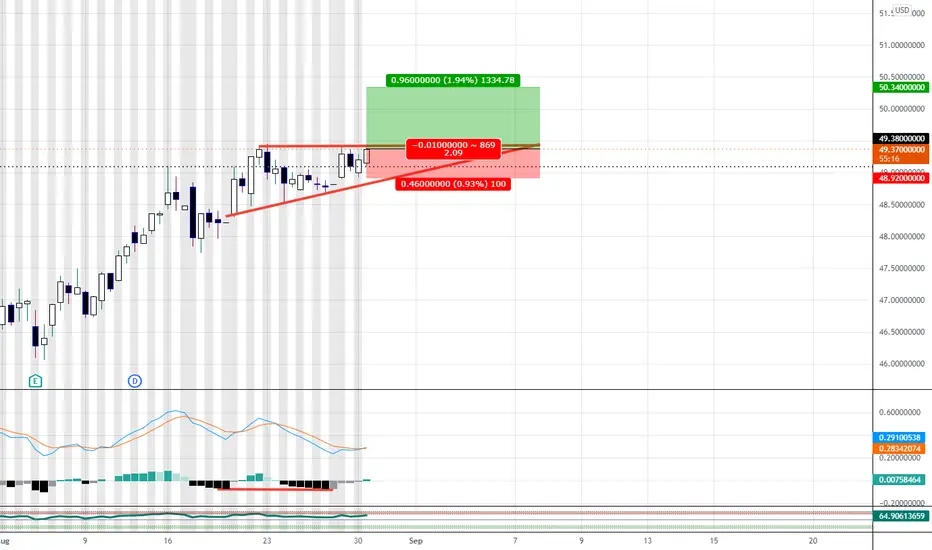
Long On EXCThe upper timeframe Trend is bullish
I should have bought the stock 4th of March as it has broke out the previous high, but i think now I have a better price and a better stop loss.
The pre-market price is at 44.07 so i will put a stop order at 44.08
My stop loss is at 42.2 under the 50 SMA, my take profit will be at 51 a weekly major resistance

US Stock In Play: $EXCUtilities name are usually not a go-to for swing traders as there is tendency of choppy price action around its MA, and low ATR%
$EXC however, behaves superbly as an utility stock with history of trading consecutive up days on several occasion in 2021 alone. ATH currently

Exelon Making New HighsExelon has room to run upwards and shows bullish momentum. New highs are being made, I bought some $55 calls expiring Nov 19, costin 17c per contract.

EXC Close to breakoutEXC getting closer to breakout
30 Month Long Base
Decent Volume
Last dip held by 200 DMA
Pays out dividends