F hold support or break F has bounced off this 11.14 several times. Cannot seem to get much off this spot. Do you see strong support or a wall that keeps getting hit and eventually breaks? I see it breaking support and filling the gaps below. an entry below $6 in the future may be a good zone to buy. Thoughts?
4F trade ideas

FORD $F | Longer Term Demand Zone Ford, a Popular American AutoMaker has been having a struggling stock performance since its 2021 rally. This stock has continued to rally upwards and melt back down towards this $11-$12 area. What we are witnessing now is a retest of these same levels that previously sent the stock back upwards with volume.
I am keeping my eye on Ford at these levels as historically this stock bounces from this demand zone. This demand zone is heavy, as highlighted in green, and will also be having support from a diagonal trendline around the $11.40 level helping support prices of $F.
With this large area for support considering the Demand Zone & the diagonal trendline retest, I believe that this area of price levels gives a solid Risk/Reward Entry on a Long Position on $F.
A break below this trendline would be a good exit point, as the stock could probably dump underneath heavily. With this Risk/Reward entry point, a swing position can be attractive or a LT entry. I am just pointing out these levels, as I think it can be an interesting area to watch the stock react to, and thought I'd share!
Happy Trading!

long entryIf this breakout above the wedge holds, we have confluence with the MACD bullish crossover as well as a bullish DMI crossover on the horizon.
Please use a stoploss, and wait to make sure that the daily candle closes above the wedge.
Thanks,

One Hurdle Before UptrendF has bounced from a major support level. It's oversold. There were two minor RSI failure swings. Lowest low was 22. Next low was 26.06. The current low is 26.34. RSI oscillator has crossed RSI average. According to Squeeze Momentum indicator, bearish momentum is getting weaker. F needs to break the neck of W formation to start an uptrend.
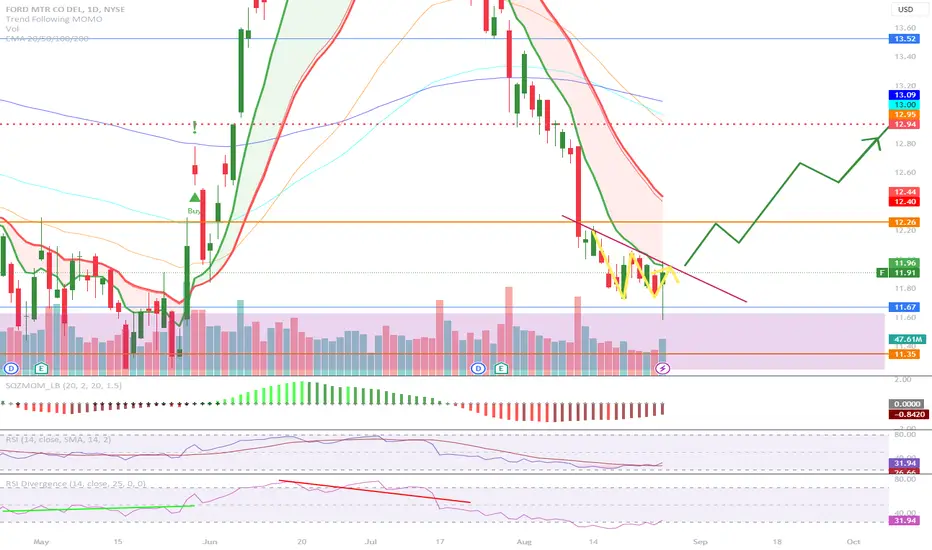
ford longdemand
lows
higher low
trendline break
indices correlation
dollar weakness
gap fill
11 dollars

Ford, F - 16%-27% Potential Upside This is a weekly chart. Lets face it. Ford is Not an Exciting stock to be in. At it's current low valuation it may be setting up now for another trend reversal within the Bearish Descending Triangle that its trading in. That may give hope to some as the potential move if it touches support around $11.00 and moves up to $14.00 would be 27% upside, if you buy the bottom. It could however find it's support around $12.00 and move to $14.00 for 16%. This should play out in the next 3-4 month's, by year end. Be mindful of the current pattern, it is a Bearish Continuation Pattern so it could possibly break through at $11 and go lower. The Bullish Hopefulls would see it breakthrough the top trendline of the pattern and move above $14 that would generate a new Uptrend and could gain some momentum in 2024. The MFI is forming a Bullish Divergence showing the current trend may be starting to weaken and the TSI is also breaking down so a short term reversal is near. The Bullish MA Cross that recently formed is the first time since August of last year and in July the Keltner Channel Cross is also the first bullish signal from this indicator in over 2 years so with the Indicators overall a Buy in the near future should be a good move overall. Last comment is that Ford's way of burning through cash to support their EV endevours is the main factor affecting the share price. Something needs to change in a Big Way to Break this Bearish Cycle. Weekly there are 350-500 million shares trading hands, I would like to find out what the Short Interest is as tht could be a catalyst to help bring them up off the bottom when the Short's need to cover.

F target $13.63ishThis actually came to me last night when I asked for a stock with good risk reward potential. It was a bit of a bummer when I finally saw it gapped down and dumped down to 6%, but was neat that it came to me.
I actually "heard" "fordham". I thought maybe Ford, but then felt a little more sure when I saw a horse neck/mane/head and decided it was a mustang. Anyway, my attention went to the downside on it. I intuitively got something on it for Wednesday as well as the number $11.38 and date Sept. 12.
I have more faith in my dowsing, so this morning checked the target and got $13.63. It isn't coming up for air much, so I think there will be follow through, but I'd watch out when it gets in the 13.xx zone.
F Oversold - Bullish SetupF was in a downtrend from Jan to July 22. After a breakout in July, reached a high of 16.5 in mid-Aug 22. Thereafter a second downtrend started which ended in May this year. The second breakout reached a high of 15.3. Both these breakouts happened when the stock hit 11.3. In the current downtrend, stock has broken the support of 12.3. F is oversold but not highly oversold. It may again reach the support of 11.3 with RSI below 40 before climbing up to 13.5. If it breaks the resistance of 13.5, likely to reach its price target of 14.6 by early 2024, else by mid-2024.

A brutal movement in the price action of FORD
During my thorough analysis of FORD's 4-hour price action, an intriguing revelation emerged: a hidden bullish divergence, a distinct pattern that warrants attention. This intriguing phenomenon is characterized by the following indicator values:
- A price of $11.29 accompanied by a Relative Strength Index (RSI) of 38.96.
- Another price point at $11.99 coupled with an RSI reading of 18.84.
The RSI was more oversold at 11.99 $ then it was at 11.29 $ indicating that this was an overall uptrend and we now that if something is oversold, it should continue up and there you have your confirmation for your uptrend continuation making this a good place to enter.
Also please note that I would usually use the RSI on a 1H time frame to find these divergences, but here we have been able to detect them on a higher time frame such as the 4H which means that this is a more higher and accurate signal compared to the other regular one which makes these a more confident trade!

FORD watching for a reversal from deep oversold LONGFORD on the one hour chart has been trending down with dynamic support from
anchored VWAP lines. However the zero lag MACD is showing some bullish divergence
with upgoing MACD and signal lines in parallel from a cross under the histogram
which converted red to green. There was an associated spike in volume in the range of 3x
the mean. The last earnings report only a few weeks back had a significant beat on the top line.
I will place FORD on my watch list for next week. I likely will take a long trade on
Mondday 8/14 with planned targets on the chart based on VWAP standard deviation line levels.
I am especially interested to see if FORD will go on a bull run and fill the volume void
from 14.25 to 15. If profits are taken off 40%, 40% ane 20% this trade could realize 20%
in profit.

FORD 37% Upside ?In my opinion, Ford's next run could be decent if we do in fact have a bull flag here. If the EV sector turns around this could be a no brainer. I'm watching for volume to come back in and sustain momentum to the upside before going to heavy. Not financial advice, DYOR.

FFord Motor Company is an American multinational automobile manufacturer headquartered in Dearborn, Michigan, United States. It was founded by Henry Ford and incorporated on June 16, 1903. The company sells automobiles and commercial vehicles under the Ford brand, and luxury cars under its Lincoln brand.

$F - what next?NYSE:F This pullback could reach the $11 area, which should offer strong support, as the price has rebounded from it multiple times in the past.
If that support fails, the next level to watch is $9.70.
The stock is expected to remain under pressure until UAW negotiations favor automakers. Currently, no position.
Ford bounce at $12?Just something I noticed. This line seems like a strong support. This trend goes way back where you can see it was a resistance before it switched. The only major disruption to the trend was the pandemic. Is this an opportunity?


F: Breakout Incoming?I usually hate triangles but I'm playing this as a turtle soup setup and I like that market looks like it wants to fill the gap back upside before a leg down. I'm hoping/expecting we gap through this trend line liquidity and that'll be my confirmation that we can make it back upside. Already positioned in this one for 2 weeks out personally.

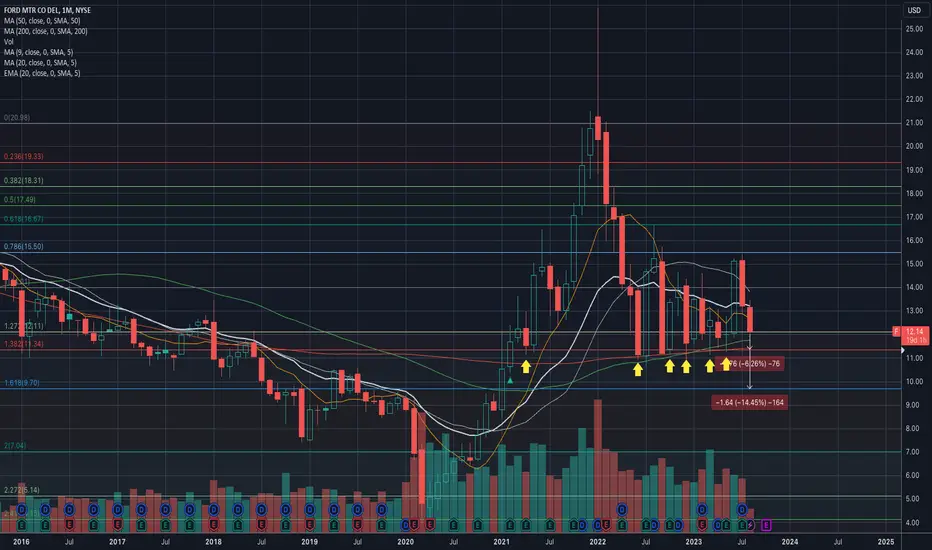
Ford - A Cautious Post-ER Long ScalpFord is one of the richest charts among all of the U.S. equities to chew and savour for an analyst.
The reason is, its relevant price action to today spans some 22 years, and we can only see it on the monthly:
Notably, $26~ was a curious place for price action to stop and reject 18 months ago, leaving monthly hallmarks of potential targets
And looking at the weekly:
The rejection was so gappy, closed in ranges not seen on the monthly, but left open ranges not seen on the weekly.
And yet in 18 months, the flat bottom formed under $12 is no cause for bullish continuation. "Support" as retail traders are taught to believe in, is made to be broken.
Therefore, this chart would absolutely never be a long, in my opinion, except that price action you can only see on the daily has created a set of goalposts.
And those goalposts are at the $15.42 level, which formed a perfect double top composing the July high.
Before we begin, I want to warn you that trading the markets right now come with significant geopolitical risks surrounding China.
The International Rules Based Order is frequently going off about "de-risking" from China, but not "decoupling," and the meaning of this is pretty significant.
You should note that the propaganda machine is always targeting "China" but not "The Chinese Communist Party."
Don't you think it's strange that despite the CCP's 100 years of murdering significantly more of its own people than Hitler did in general that the global Party doesn't take advantage of the CCP's heinous human rights abuses and totalitarianism to take it down?
Instead, they're always going after China, its 5,000 year old culture, and its 1.4 billion pre-Wuhan Pneumonia population?
It's because the IRBO wants to take control of China as the CCP falls. They won't take control of it directly, because they're not Chinese, but will install a puppet from Taiwan.
And this is where "War With Taiwan" garrling comes from. It's not that Xi Jinping is going to invade Taiwan, but that the IRBO intends to take control of China with Taiwan as a proxy.
But Xi can always weaponize the 24 year persecution of Falun Gong, started by former Chairman Jiang Zemin on July 20, 1999, to protect himself and China, because Wall Street and the World Government have been extensively visiting Shanghai (Shanghai Gigafactory what?) to train Marxism.
And training Marxism in Shanghai means depositing collateral with the CCP.
Xi has never persecuted Falun Gong. Instead, Xi has even protected Falun Gong from the Jiangling thugs in Hong Kong, and that was the real purpose of the National Security Law and the installation of John Lee as Chief Executive.
Notable that Lee was banned from attending the San Francisco APEC conference in November by Joe Biden, in that light, wouldn't you say?
So, back to trading.
Generally, the market makers will not leave this kind of double top in play, because short sellers love to go bigly short under them because "it's strong resistance," before taking new lows.
It's noteworthy that Ford is only a ~$50 billion company. Compare that to Tesla and decide which company is over/undervalued.
And all of that is just theoretical, but when we combine it with the fact that Friday's earnings were actually pretty good, but Ford dumped, and back into the box that preceeded its breakout, making it a classic breakout-retrace long, we have a trade setup.
So here's the idea.
Unfortunately, I believe that there is extremely high probabilities that the indexes are topping to end July or to begin August, which I go over here:
# SPX - The Sound of a Shattering Iceberg
Ford would probably get drug down in a 200+ point SPX correction.
That means that while we have significant bullish upside targets, at the $18 and $22 levels, all of the long term price action considered, we probably have to raid the bottom under $10 before Ford can really and truly rally during an index recovery.
So what we have is a long from where we are on Friday, +/- $12.80, with a target of $16.
This is a pretty nice range to collect.
Rather than use a strict price based stop, what I would like to say is that if Ford does not trade up and away from this $13 level within the next two weeks, it would indicate that big money is up to something else, and a long trade is either not valid or too risky to bother with.
Conversely, if you're bold and brave, shorts/puts over $15.50 with a target under $10 before 2024 may equal an even better payout and risk reward setup.
This trade is something of a coinflip that I only have moderate confidence in. What I have confidence in is that the MMs will not leave $15.50 in tact before they really dump it.
I also don't believe they'll leave these perfect flat bottoms in tact before they pump it.
So, be careful, and good luck. Plays like this are a lot better than gambling on the latest dumpster fire coin (AMC, SPWR, lol) spread on Marxist messenger Reddit.

FORD fell after good earnings - now reverses LONGFORD on the 2H chart double topped in mid July and then descended as it had reached
the second deviation line above the mean anchored VWAP. It continued the fall had a bit
of pre-earnings run up and then paradoxically fell with very decent top and bottom line
earnings. If you know why please let me know. After earnings and the fall, FORD reached
the long-term mean VWAP and reversed as can be seen on lower time frames. I see this
as a VWAP bounce, the favorite place for institutional traders to make their trades. A volume
profile and its POC line find the highest trading volumes of the time interval. the MACD
and Price Momentum Oscillators are confirmatory with reversal signals. I will take a long
trade here. The stop loss will be 13 below VWAP. Targets are 14 (25%) 14.5 (50%) and 14.85
(25%). This is a simple trade with $0.25 risk which will be eliminated once price gets
to $13.5 making it risk and stress-free. I have an options trade in mind. Comment if
you want my specifics.

Technical and digital analysisWe notice that we are in a complex correction, and we notice that there is a buying momentum that increases, while the selling momentum decreases, and we see that there is a divergence

Ford is ready to growa prolonged triangle finished in May 2023, then there was an impulsive wave up followed by a correction that can be near its end soon. Expecting the second leg up from 13 to 17

F Ford Motor Company Options Ahead of EarningsIf you haven`t bought F here:
Analyzing the options chain and the chart patterns of F Ford Motor Company prior to the earnings report this week,
I would consider purchasing the $14.35 strike price Puts with
an expiration date of 2024-1-19,
for a premium of approximately $1.47.
If these options prove to be profitable prior to the earnings release, I would sell at least half of them.
Looking forward to read your opinion about it.

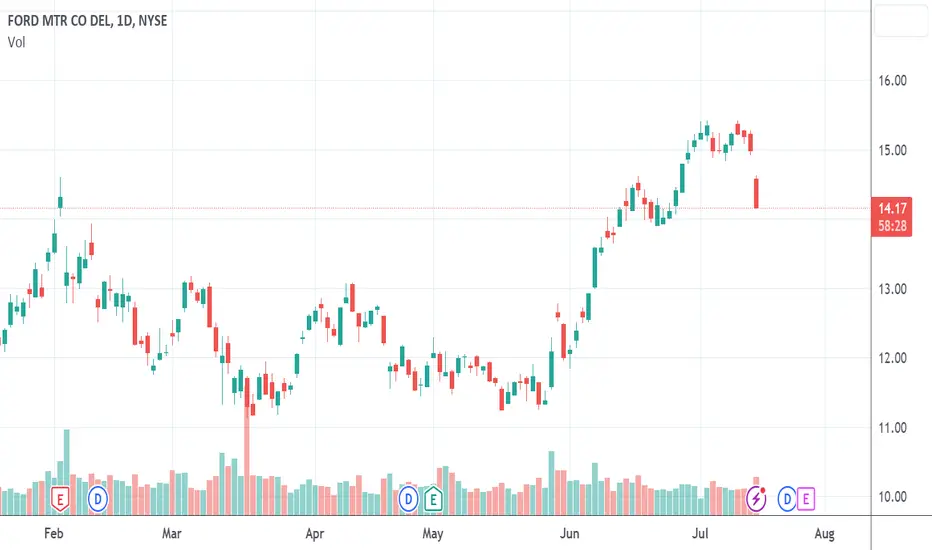
F - Long Position IdeaHi everyone, I entered F with a price average of 13.16$. I don't plan to add any more shares to my current position; however, I believe that F has presented us with a good scalp/swing trade with the current chart. First of all, I'm liking the bounce off of support at around 13.10$. The fact that it found support and immediately reversed to 13.3$ says there is buying pressure. F has gapped down in today's session from 13.7$ to 13.04$, a considerable gap down. Prior to this trading session, we have seen the price per share decline a whole dollar in the span of this trading week. In general, I believe that Ford could possibly retest 13.52$ and even break above it. This is just an idea for a small scalp that I am currently involved in myself. EPS and Revenue estimates were both beats; however, the price dropped due to EV concerns within the company. I believe that there is room for upside, limited upside, but there is certainly money that can be made off of this dip. I did the same for LUV and EBAY, which were all good dip buys off of earnings reports. As seen on the RSI, F was oversold on today's session as it gapped down at the open. With that being said, this is just a long idea that looked decent to me. Have a good weekend and good luck trading everyone!

F CSPs sold 2, 3 DTE at $13.5, $13Two F CSPs sold with 3-DTE and 2-DTE at $13.5, $13 respectively.
Premium == +23, +9
Total Premium == $32
DCA == $13.25
If price close Friday > 13.5, then % == 1.2%:
Else let CSPs excersize and convert to sell CC 1week, 1-week, 2-week, 3-weeks, 5weeks....
