GS @ 15 min @ just a little bit - daily (3 GAP`s left behind)Basic horicontal lines (support/resistance) are:
242.42 high of last week
235.54 low of this week
225.73 opening price & low of last week
GS opend this week around last weeks highs and created weekly lows around basic upside, before breaked out slightly today. Noticable, at in my opinion, are the facts, that GS created 3 GAP`s. 3 Upside GAP´s are suggesting me, that many traders are scared not be long also. Usually GAP`s got the property to be closed - in a superior upside trend. And that`s the reason why i adon`t wanna ignore all 3. I am relative surely that the market will let all 3 left behind, while next week at least. But market pressure like yesterday is always possible - even if the fundamentals are suggesting still higher prices. How ever, use the GAP`s still as an entry, guys :) i bought today some CFD`s at 241.50 :agree:
241.62 & 240.27 3rd GAP (before todays outbreak)
238.20 & 237.50 2nd GAP (after fals breakout while monday)
236.72 & 235.54 1st GAP (thursday opening, last week
price targets (based on development last days) could be
243,22 last alltime high & 3rd GAP
246,64 last alltime high & 2nd GAP
248,12 last alltime high & 1st GAP
superordinate prices targets (on higher time frames) are still
249,30 last week alltime high & low of this week
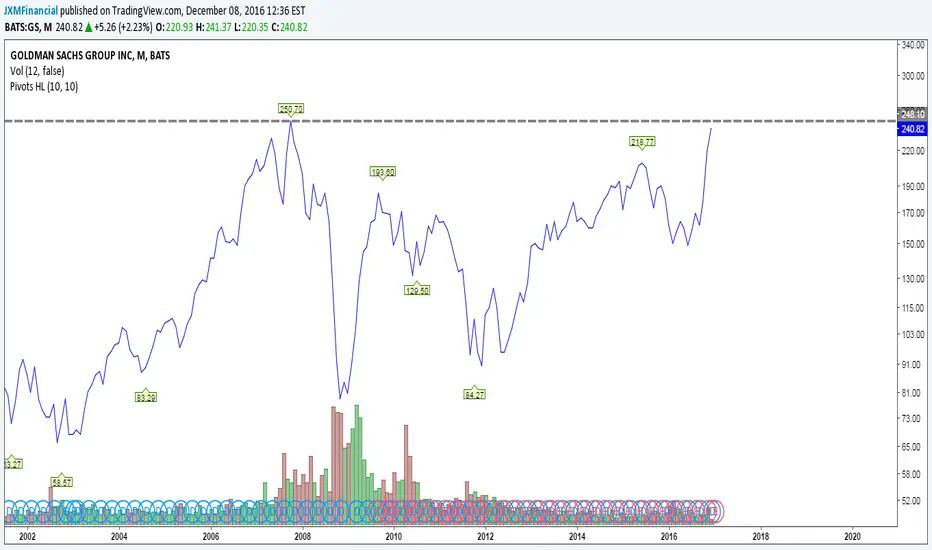
250,70 all time high from october`07
259,11 last weeks high & low difference
JPM for example breakedout for a long minutes, hours, days.
From tis point of view, don`t get panic if the price raises too much at once.
Of course, it`s all relative - not only compared to other bank or financial shares!
But in historical context - even before so called financial crises `07 - the numbers we`re not better as the political (trump, reds, fiscal policy) or even financial market environment (low rates - cycles is slightly starting) :)
Take care
& analyzed it again
- it`s always your decission ...
(for a bigger picture zoom the chart)
This is only a analysis (for swing traders) - no recommendation !!!
Buying/Selling or even only watching is always your own responsibility ...
Best regards
Aaron
4GS trade ideas


LAST RECO ON GS - SHORT AT THE MONEY PUTS w 1 day to GoTough to swallow but GS trading over 241 aq t time of reco..
That's right. If you have been having a great year and are as frustrated and stupid as one can get when a position goes 180 on you -- BUY 237.5 PUTS expiring tomorrow, DEC9 at .73
The god damn stock can add 10 points in a couple hours p and has practically been doing so for a month. The reason I did the bear call spread before this is there are a ton of open interest in calls under us here - and I say these market makers work it backwards to neutralize a few strikes tomorrow.
Plus --enjoy a moment to pay as little premium as you ever will this quarter in an option that's almost at the money (key word - almost) as technically we are 3.5 points away right now - but c'mon. .73? I bought 20, call it my last hail Mary is i have 4 weeks to let these other puts work. I'm not adding furher after this - and still believe these trades will work. In fact - the chances of a 10 to 20 point pullback in a day at some point in next few weeks is over 70pc...
This is for aggressive traders who. presumably, have some profits they are willing to PLAY - CALL IT CRAPs, as at least I think you have max ODDS ON THIS THROW.

SHORT GS AND TAKE 3 POINTS!!The call premiums are crazy on GS - but so is this run, and shorting it srtraight w puts is killing me. I know - it is deadly to start saying "I'm gonna getcha" but this rally is ahead of itself even by crappy analysts who are making balsy calls like ' OK - I'll change my target from 189 to 245" - yes - 2 Days ago!. Wow. Pay the man.
SO _ one thing that does happen on these weekly rolls w this volatility is about 1.5 pts of premium gets sucked out between late Friday afternoons and early Monday Am. I just:
BEAR CALL SPREAD : SELL DEC 16 235 Calls, BUY Dec 16 240 Calls. PICK UP 3.5 ponits RR 2:1 risk $175

Short GS again! KEEP buying powder dry to add (scenario below)HUGE OPPORTUNITY FOR AGGRESSIVE, WELL-FUNDED TRADERS. Start Shorting today Tues 12/6 and keep shorting if you buy off on scenario below. I feel this is now a rare opportunity - but hold onto your Tums bottle all the same. GS is 231 with 20 mins. to go today, and it's been holding - but in a narrower range than usual. The RSIs (especially the default 14 pt IA AND HAS BEEN OBSCENELY OVERBOUGHT and it has ben my experience that the longer this RSI remains over 80, the harder and choppier the fall. Macd has signaled - as have the oscillators .
I love trading GS and made one short reco last week which worked out well in the first hour of trading. We are setting up for another pullback for the following reason: the stock has gone parabolic (you do not need me to tell you that!) and parabolas have two sides! Why so much gas in Goldman? Aside from Goldman Grads being in just about every federal and world banking arm, they surround the presidents - and Goldman kicks ass in their bond trading department -- WHEN there is bond volatility. Indeed, this year is setting up for that positive aspect for GS, along with huge deals and the obvious deregulation spark that lit up the financials. Goldman stands to have a great year - but we are a tad ahead of ourselves here - for a logical reason, but it is far from a fundamentally or technically sound reason...
But this insane run since the election may have started on fundamentals - but has shifted to Window dressing by the big retail Mutual Funds(at this moment - AND I FINALLY sense the gas drying up). Am I brilliant? Clearly not - but I have noticed a shift in IBD's "New Buys (by the top 1/3rd best Mutual funds )- and out of 99 funds active in GS, over weeks it has gone from mostly buying to now - out of 99 funds - 55 buyers and 45 net sellers. The smart nimble guys got in and took as much as a 50% upside bite ( or chomp) and now are taking profits and getting the hell out.
The stock has garnered so much attention, the remaining "big boys" who cater to the masses are just dressing up positions for the one time of year when their investors may actually look at the positions carefully - and managers don't want to be asked why or how they dont own GS -- God forbid. BUT BUT BUT..
Today, with the market firing to the upside several times - Goldman has stopped participating - where practically every other day , a few points in the S&P translated to points in GS as funds wanted in before losing more upside potential. Today, however, was important in that a few analysts changed their targets (I think one guy revised his from 189 to 245). HSBC came out and initiated with a 250 target. THIS SAYS THAT EVEN THE LATECOMERS TRYING TO SHOW A GOOD RESEARCH CALL ARE NOT SEEING MUCH MORE UPSIDE HERE.
Start building put positions by whatever style you use - but I would suggest leveraging the hell out of 25% of your trading money on this by rolling into the front week in the < $1.00 range. Use the rest for put or call spreads or whatever your style is -- but the spreads have been especially lucrative when you anticipate the premium deflation that results when the next week becomes the front week (a long way of saying do this on Friday close or Monday 1st 30 mins and you will make money 4 out of 5 times in this environment. I would keep a couple of near positions - and i have built positions out as far as 4 weeks.
It is remotely possible - and I say remotely - that Goldman holds up until the first of January. Hell - they could be doing a deal and decide to prop themselves up as much as possible because stock is currency somewhere in some enormous transaction - with Goldman, strange things definitely happen behind the curtain. But everything i see points to some real heart-thumping pullbacks once the pullbacks start - we could see some amazing jolts of easily 10 to 20 points, on multiple occasions, so trade them all individually if possible) on the downside, so try to hang in. Good luck

The Trump buy is overGoldman is extremely overbought here and touching 2008 highs. It will take a leap down


GS AnalogOverlaid the Fall of 2007 analog on GS. History doesn't repeat, but it rhymes...
Putting together evidence as to whether this is 2007-08 or whether Feb 2016 was Mar 2009. The ultimate question.


Goldman will correct itself then continue on its way back up@JordanFreeman we'll see who's right homie


Wait for Long Put "GS"In terms of valuation compared to itself,
the stock price is in the expensive zone and
the yield is quite low.
In terms of Technical, the price goes near last peak.
As an option trader, it is very interesting to look for Long put "GS" opportunity.

GS (Goldman Sachs) Short IdeaShort Goldman Sachs!
Overbought AF!
RSI overbought too
88.6 Fib level on the daily/Weekly
Gaps up in the markets that are potentially going to get filled. Just look at Google before and after $800

GS inverse head and shoulders could be donejust want to show the inverse head and shoulders pattern is complete on GS. I am short a little with options due to very extended daily RSI.

SELL SETUP We have a wolfe wave pattern in development.
it would be a good idea to try to sell with magnificent RR ratio.
Good luck

Sideward with room the topIn the long run it is a sidewar trend. We have just built a bottom and lookin forward to test the upside now.


High Profit Short Level On Goldman Sachs $GSThere is an absolutely awesome short level on Goldman Sachs Group Inc (NYSE:GS) at $180.00 to short. This comes from institutional traders I know and I confirmed it on the stock chart. Check out the trend line below and notice how if Goldman Sachs jumps up to $180 it will tag the trend line which is resistance. That is where I will pull the trigger on a short. Great trade setup here, just need some patience until the stock gets up to that level.
Jenny
Verified Trader @ VerifiedInvesting.com


