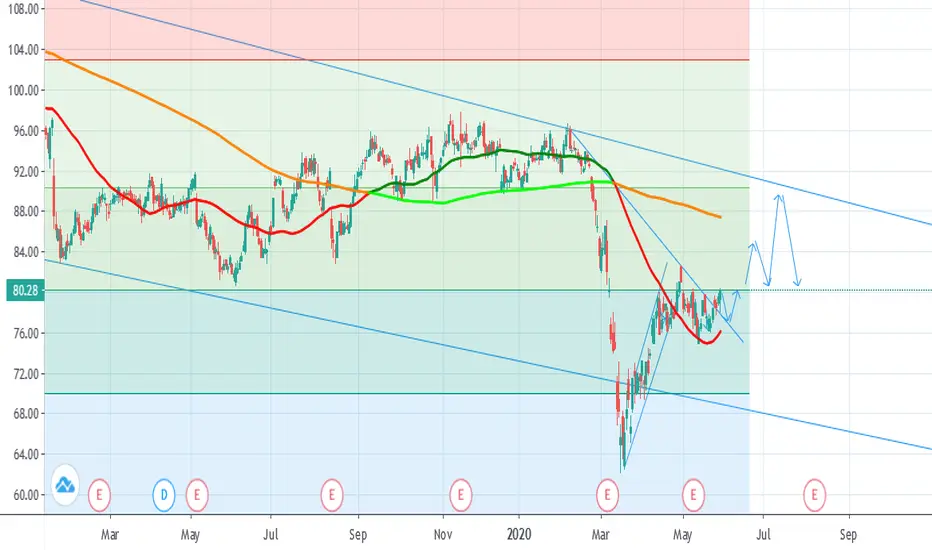
RiskMastery's Red Flag Stocks - HENOY EditionWelcome to RiskMastery's Red Flag Stocks - Stocks with bearish potential.
In this edition, we'll be looking at OTC:HENOY ...
I believe this code is at a point of potential volatility.
If price can hold below $19.61 ... Bearish potential may be unlocked.
My key downside targets include
Next report date
—
Report period
—
EPS estimate
—
Revenue estimate
—
4.78 EUR
2.01 B EUR
21.59 B EUR
148.87 M
About HENKEL AG&CO. KGAA
Sector
Industry
CEO
Carsten Knobel
Website
Headquarters
Dusseldorf
Founded
1975
ISIN
DE0006048432
FIGI
BBG00HL0TV99
Henkel AG & Co. KGaA engages in the production, sale, and distribution of home and beauty care products. The firm also provides adhesive technology solutions. It operates through the Adhesive Technologies and Consumer Brands segments. The Adhesive Technologies segment sells adhesives, sealants, and functional coatings for consumers, craftsmen, and industrial applications. The Consumer Brands segment offers branded products for consumers and professional applications for the hairdressing business that includes products for hair care, styling and coloring, as well as detergents and fabric softeners. The company was founded by Fritz Henkel on September 26, 1876 and is headquartered in Dusseldorf, Germany.
Related stocks

HEN3 • Henkel • XETRA LONG TF H1#HEN3 • Henkel • XETRA LONG TF H1
TP = 69.24, SL = 67.74
The trend continues, the nearest support level according to my calculations TP 69.24

OIZC BUYPeace be upon you, there is a high probability of the stock rising. with an ascending channel. It also broke 64, which is an important support. And the price retested it twice + having the moving average 200 which is a strong support. as in the picture

HEN3 Henkel looking for entry pointAssuming we are correction a large impulse, this could lead us to around 76=38,2% fibo level
Adding at these levels to surf the 3rd wave for targeting 122 on the long term
last big correction of the movement 17,5-->129,90 also ended at the 38,2% fibo level more or less

Henkel sollte weiter korrigierenMoin!
Henkel sollte nach der Elliot Wave Theorie die korrigierende C-Welle noch etwas weiter ausbauen, bevor sich eine gute Einstiegsmöglichkeit ergibt.

Khan's Chart-Requests 03 - $HEN3 | $HENKYContinued downtred, but stron buying-volume at €78 - i would take that as Support-Area and cut below.
You could start a small position at current levels, i feel more confident if we re-concuwe EMA 20 / MId-Band

Henkel LongtradeHey guys
I think this is going to go its way to the 5th wave. Ichimoku gives huge support to that!
Entry: just now
Stop loss: 85,80€
Take Profit: 88,60€ - 91,30€
Much fun with that trade!
Leave a comment!


See all ideas
Summarizing what the indicators are suggesting.
Neutral
SellBuy
Strong sellStrong buy
Strong sellSellNeutralBuyStrong buy
Neutral
SellBuy
Strong sellStrong buy
Strong sellSellNeutralBuyStrong buy
Neutral
SellBuy
Strong sellStrong buy
Strong sellSellNeutralBuyStrong buy
An aggregate view of professional's ratings.
Neutral
SellBuy
Strong sellStrong buy
Strong sellSellNeutralBuyStrong buy
Neutral
SellBuy
Strong sellStrong buy
Strong sellSellNeutralBuyStrong buy
Neutral
SellBuy
Strong sellStrong buy
Strong sellSellNeutralBuyStrong buy
Displays a symbol's price movements over previous years to identify recurring trends.
HENK5301962
Henkel AG & Co. KGaA 1.75% 17-NOV-2026Yield to maturity
5.61%
Maturity date
Nov 17, 2026
XS2057835808
HenkelAG&Co 1,25% 30/09/2026Yield to maturity
4.45%
Maturity date
Sep 30, 2026
XS240795582
HENKEL 21/32 MTNYield to maturity
3.33%
Maturity date
Nov 17, 2032
XS253021934
HENKEL 22/27 MTNYield to maturity
2.31%
Maturity date
Sep 13, 2027
See all 4HEN3 bonds
Curated watchlists where 4HEN3 is featured.


Frequently Asked Questions
The current price of 4HEN3 is 67.56 EUR — it has decreased by −0.21% in the past 24 hours. Watch HENKEL VZ stock price performance more closely on the chart.
Depending on the exchange, the stock ticker may vary. For instance, on EUROTLX exchange HENKEL VZ stocks are traded under the ticker 4HEN3.
4HEN3 stock has fallen by −1.17% compared to the previous week, the month change is a 1.50% rise, over the last year HENKEL VZ has showed a −14.07% decrease.
We've gathered analysts' opinions on HENKEL VZ future price: according to them, 4HEN3 price has a max estimate of 95.00 EUR and a min estimate of 67.00 EUR. Watch 4HEN3 chart and read a more detailed HENKEL VZ stock forecast: see what analysts think of HENKEL VZ and suggest that you do with its stocks.
4HEN3 reached its all-time high on Nov 3, 2017 with the price of 123.48 EUR, and its all-time low was 57.54 EUR and was reached on Jun 16, 2022. View more price dynamics on 4HEN3 chart.
See other stocks reaching their highest and lowest prices.
See other stocks reaching their highest and lowest prices.
4HEN3 stock is 0.21% volatile and has beta coefficient of 0.61. Track HENKEL VZ stock price on the chart and check out the list of the most volatile stocks — is HENKEL VZ there?
Today HENKEL VZ has the market capitalization of 28.17 B, it has decreased by −0.90% over the last week.
Yes, you can track HENKEL VZ financials in yearly and quarterly reports right on TradingView.
HENKEL VZ is going to release the next earnings report on Aug 7, 2025. Keep track of upcoming events with our Earnings Calendar.
4HEN3 earnings for the last half-year are 2.58 EUR per share, whereas the estimation was 2.58 EUR, resulting in a 0.00% surprise. The estimated earnings for the next half-year are 2.76 EUR per share. See more details about HENKEL VZ earnings.
HENKEL VZ revenue for the last half-year amounts to 10.77 B EUR, despite the estimated figure of 10.74 B EUR. In the next half-year revenue is expected to reach 10.51 B EUR.
4HEN3 net income for the last half-year is 977.00 M EUR, while the previous report showed 1.03 B EUR of net income which accounts for −5.15% change. Track more HENKEL VZ financial stats to get the full picture.
Yes, 4HEN3 dividends are paid annually. The last dividend per share was 2.04 EUR. As of today, Dividend Yield (TTM)% is 3.04%. Tracking HENKEL VZ dividends might help you take more informed decisions.
HENKEL VZ dividend yield was 2.41% in 2024, and payout ratio reached 42.63%. The year before the numbers were 2.54% and 58.91% correspondingly. See high-dividend stocks and find more opportunities for your portfolio.
As of Aug 2, 2025, the company has 47.15 K employees. See our rating of the largest employees — is HENKEL VZ on this list?
EBITDA measures a company's operating performance, its growth signifies an improvement in the efficiency of a company. HENKEL VZ EBITDA is 3.93 B EUR, and current EBITDA margin is 17.68%. See more stats in HENKEL VZ financial statements.
Like other stocks, 4HEN3 shares are traded on stock exchanges, e.g. Nasdaq, Nyse, Euronext, and the easiest way to buy them is through an online stock broker. To do this, you need to open an account and follow a broker's procedures, then start trading. You can trade HENKEL VZ stock right from TradingView charts — choose your broker and connect to your account.
Investing in stocks requires a comprehensive research: you should carefully study all the available data, e.g. company's financials, related news, and its technical analysis. So HENKEL VZ technincal analysis shows the strong sell today, and its 1 week rating is sell. Since market conditions are prone to changes, it's worth looking a bit further into the future — according to the 1 month rating HENKEL VZ stock shows the sell signal. See more of HENKEL VZ technicals for a more comprehensive analysis.
If you're still not sure, try looking for inspiration in our curated watchlists.
If you're still not sure, try looking for inspiration in our curated watchlists.