IBM's Cloud & Consulting Momentum Presents Bullish Setup Current Price: $285.87
Direction: LONG
Targets:
- T1 = $294.00
- T2 = $305.00
Stop Levels:
- S1 = $279.50
- S2 = $276.00
**Wisdom of Professional Traders:**
This analysis synthesizes insights from thousands of professional traders and market experts, leveraging collective intelligence to id
Key facts today
Next report date
—
Report period
—
EPS estimate
—
Revenue estimate
—
5.45 EUR
5.82 B EUR
60.62 B EUR
928.40 M
About International Business Machines Corporation
Sector
Industry
CEO
Arvind Krishna
Website
Headquarters
Armonk
Founded
1911
FIGI
BBG000QFTZ71
International Business Machines Corp. is an information technology company, which engages in the provision of integrated solutions that leverage information technology and knowledge of business processes. It operates through the following segments: Software, Consulting, Infrastructure, Financing, and Other. The Software segment combines hybrid cloud platform and software solutions to help clients become more data-driven, and to automate, secure, and modernize their environments. The Consulting segment focuses on integrating skills on strategy, experience, technology and operations by domain and industry. The Infrastructure segment offers solutions for hybrid cloud and is the foundation of the hybrid cloud stack. Infrastructure is optimized for infusing AI into mission-critical transactions and tightly integrated with IBM Software including Red Hat for accelerated hybrid cloud benefits. The Financing segment refers to the client and commercial financing, facilitating IBM clients’ acquisition of IT systems, software, and services. The company was founded by Charles Ranlett Flint and Thomas J. Watson Sr. on June 16, 1911 and is headquartered in Armonk, NY.
Related stocks
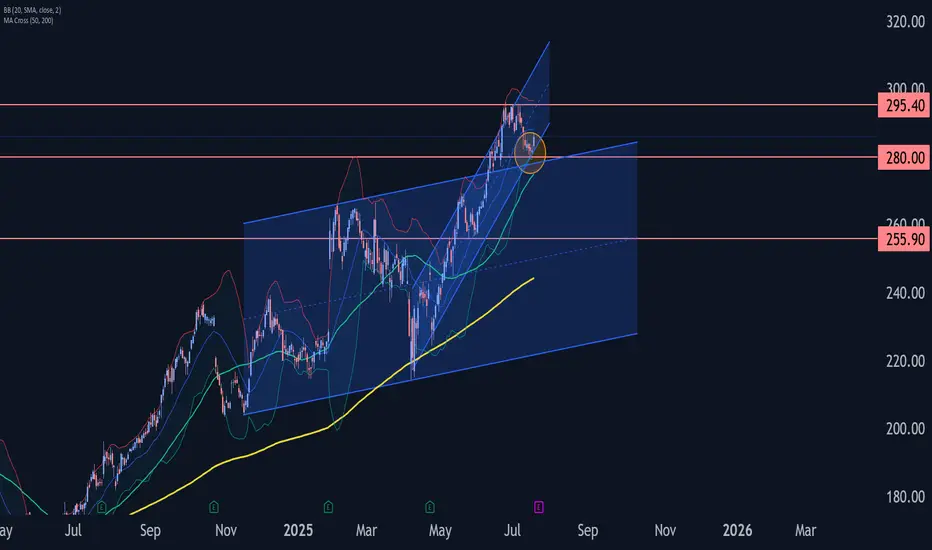
IBM Wave Analysis – 18 July 2025
- IBM reversed from support zone
- Likely to rise to resistance 295.40
IBM recently reversed up from the support zone between the support level 280.00, upper trendline of the recently broken weekly up channel from 2024 and the support trendline of the more recent up channel from April.
This suppo
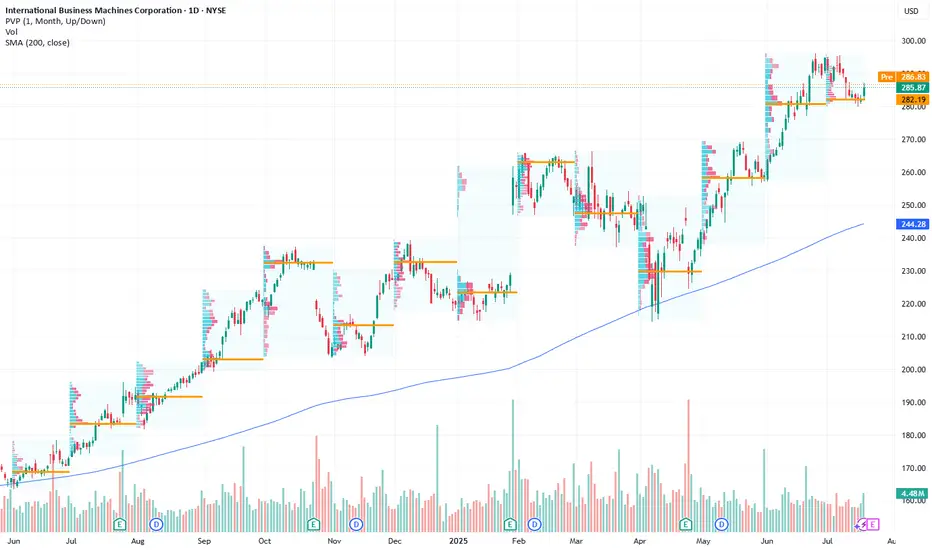
IBM eyes on $282.88: Golden Genesis fib a Key Support to uptrendIBM has been in a strong uptrend but looking top-ish.
It has pulled back to a Golden Genesis fib at $282.88
Look for a bounce but perhaps after a couple orbits.
.
See "Related Publications" for previous charts like this BOTTOM CALL:
Hit the BOOST and FOLLOW for more such PRECISE and TIMELY chart

IBM: SHA-ttering ExpectationsAs we move through 2024, NYSE:IBM continues to demonstrate its strength as a technology powerhouse, particularly in cloud computing, AI, and cybersecurity. With a legacy rooted in innovation, IBM's deep history in encryption technologies and its forward-looking strategies make it a compelling buy

Surprising ups and downs in global indicesJune brought contrasting moves across global stock markets: while the U.S. and Asia posted gains, Europe struggled under pressure. Rising tensions between Iran and Israel, political instability in the EU, and shifting rate expectations fueled volatility. In search of stability, investors turned to U

IBM: Still BullishAfter the increases over the recent weeks, we still place IBM within the magenta wave (3) and expect a bit more bullish headroom in the short term. However, in our medium-term alternative scenario, we would see a larger pullback with the green wave alt. . Such a detour is considered 30% likely and

IBM – Long Trade Setup📈
🔍 Pattern: Bullish pennant breakout
📍 Entry: Around $281.88 (breakout confirmation)
🎯 Target: $287.52 (green resistance zone)
🛑 Stop-loss: Below $278.50 (support area)
✅ Why this trade?
Strong uptrend with clean pullback
Breakout from consolidation (pennant)
Solid volume and momentum follow-th

IBM: Strategic AI and Hybrid Cloud Expansion Signals Bullish Ups
Current Price: $277.22
Direction: LONG
Targets:
- T1 = $285.00
- T2 = $293.50
Stop Levels:
- S1 = $270.50
- S2 = $265.00
**Wisdom of Professional Traders:**
This analysis synthesizes insights from thousands of professional traders and market experts, leveraging collective intelligence to

IBM Strong uptrend and may see target at 302NYSE:IBM uptrend remain strong and we have been holding on to it since our last report sharing
Price action shows a clear uptick above the 123.6% Fibonacci extension level and with that, we see a strong potential bullish upside as there is not strong bearish reversal at 123.6%.
Hence, we are

IBM Approaching Channel Resistance – Bear Call Spread Setup?IBM has rallied strongly within a clear ascending channel since late 2023, pushing recently into all-time highs and testing the upper boundary of the structure. This level has acted as resistance multiple times in the past — and we may now be approaching another potential rejection zone.
🔍 Key Tech

See all ideas
Summarizing what the indicators are suggesting.
Neutral
SellBuy
Strong sellStrong buy
Strong sellSellNeutralBuyStrong buy
Neutral
SellBuy
Strong sellStrong buy
Strong sellSellNeutralBuyStrong buy
Neutral
SellBuy
Strong sellStrong buy
Strong sellSellNeutralBuyStrong buy
An aggregate view of professional's ratings.
Neutral
SellBuy
Strong sellStrong buy
Strong sellSellNeutralBuyStrong buy
Neutral
SellBuy
Strong sellStrong buy
Strong sellSellNeutralBuyStrong buy
Neutral
SellBuy
Strong sellStrong buy
Strong sellSellNeutralBuyStrong buy
Displays a symbol's price movements over previous years to identify recurring trends.
IBM4983326
International Business Machines Corporation 2.95% 15-MAY-2050Yield to maturity
7.19%
Maturity date
May 15, 2050
IBM5354862
International Business Machines Corporation 3.43% 09-FEB-2052Yield to maturity
6.98%
Maturity date
Feb 9, 2052
IBM5449458
International Business Machines Corporation 4.9% 27-JUL-2052Yield to maturity
6.15%
Maturity date
Jul 27, 2052
I
IBM5744047
IBM International Capital Pte. Ltd. 5.3% 05-FEB-2054Yield to maturity
6.15%
Maturity date
Feb 5, 2054
IBM5534365
International Business Machines Corporation 5.1% 06-FEB-2053Yield to maturity
6.12%
Maturity date
Feb 6, 2053
IBM.GX
International Business Machines Corporation 7.0% 30-OCT-2045Yield to maturity
6.03%
Maturity date
Oct 30, 2045
See all 4IBM bonds
Curated watchlists where 4IBM is featured.


Frequently Asked Questions
The current price of 4IBM is 245.75 EUR — it has increased by 1.36% in the past 24 hours. Watch IBM stock price performance more closely on the chart.
Depending on the exchange, the stock ticker may vary. For instance, on EUROTLX exchange IBM stocks are traded under the ticker 4IBM.
4IBM stock has risen by 0.59% compared to the previous week, the month change is a −2.19% fall, over the last year IBM has showed a 41.82% increase.
We've gathered analysts' opinions on IBM future price: according to them, 4IBM price has a max estimate of 301.18 EUR and a min estimate of 163.50 EUR. Watch 4IBM chart and read a more detailed IBM stock forecast: see what analysts think of IBM and suggest that you do with its stocks.
4IBM reached its all-time high on Jun 27, 2025 with the price of 253.05 EUR, and its all-time low was 85.00 EUR and was reached on Mar 23, 2020. View more price dynamics on 4IBM chart.
See other stocks reaching their highest and lowest prices.
See other stocks reaching their highest and lowest prices.
4IBM stock is 1.34% volatile and has beta coefficient of 0.71. Track IBM stock price on the chart and check out the list of the most volatile stocks — is IBM there?
Today IBM has the market capitalization of 228.63 B, it has increased by 0.22% over the last week.
Yes, you can track IBM financials in yearly and quarterly reports right on TradingView.
IBM is going to release the next earnings report on Jul 23, 2025. Keep track of upcoming events with our Earnings Calendar.
4IBM earnings for the last quarter are 1.48 EUR per share, whereas the estimation was 1.32 EUR resulting in a 12.35% surprise. The estimated earnings for the next quarter are 2.25 EUR per share. See more details about IBM earnings.
IBM revenue for the last quarter amounts to 13.44 B EUR, despite the estimated figure of 13.30 B EUR. In the next quarter, revenue is expected to reach 14.08 B EUR.
4IBM net income for the last quarter is 975.18 M EUR, while the quarter before that showed 2.81 B EUR of net income which accounts for −65.36% change. Track more IBM financial stats to get the full picture.
Yes, 4IBM dividends are paid quarterly. The last dividend per share was 1.49 EUR. As of today, Dividend Yield (TTM)% is 2.34%. Tracking IBM dividends might help you take more informed decisions.
IBM dividend yield was 3.03% in 2024, and payout ratio reached 103.78%. The year before the numbers were 4.05% and 81.49% correspondingly. See high-dividend stocks and find more opportunities for your portfolio.
As of Jul 21, 2025, the company has 293.4 K employees. See our rating of the largest employees — is IBM on this list?
EBITDA measures a company's operating performance, its growth signifies an improvement in the efficiency of a company. IBM EBITDA is 14.65 B EUR, and current EBITDA margin is 24.48%. See more stats in IBM financial statements.
Like other stocks, 4IBM shares are traded on stock exchanges, e.g. Nasdaq, Nyse, Euronext, and the easiest way to buy them is through an online stock broker. To do this, you need to open an account and follow a broker's procedures, then start trading. You can trade IBM stock right from TradingView charts — choose your broker and connect to your account.
Investing in stocks requires a comprehensive research: you should carefully study all the available data, e.g. company's financials, related news, and its technical analysis. So IBM technincal analysis shows the buy rating today, and its 1 week rating is buy. Since market conditions are prone to changes, it's worth looking a bit further into the future — according to the 1 month rating IBM stock shows the buy signal. See more of IBM technicals for a more comprehensive analysis.
If you're still not sure, try looking for inspiration in our curated watchlists.
If you're still not sure, try looking for inspiration in our curated watchlists.