IBM rising wedge(Short it)Suffering from the same pattern as the Dow.
1st target is gap close at 133
Dow stocks with similar pattern
Cisco
Visa
Mastercard
JPMorgan
4IBM trade ideas

IBM will Grow up from hereAccording to my trading system IBM will Grow up from here
Buy at 149.50
exit at: 145
Target at: 158
Hope you can Give good profit from it
Good Luck.

IMB SWING Important note: ⚠️ All trades have risks that the investor must consider before investing. VivirdelTrading.club makes a disclaimer of any operation that may generate losses. All information transmitted by the channel, the page and the alert system is shared in good faith. There is no guarantee of 100% of the executed operations, as these are based on statistical models and assumptions regarding the past behavior of the price of a share, but they do not guarantee the same future behavior.

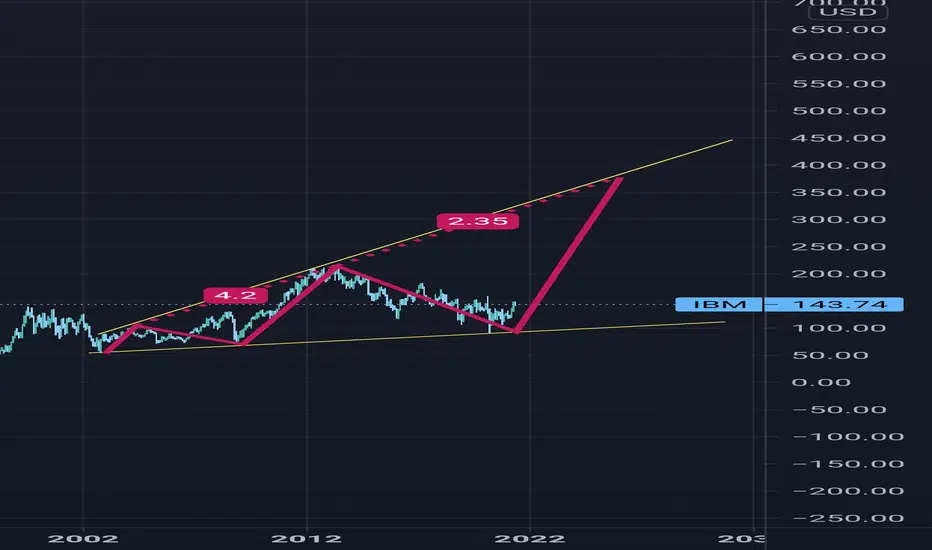
IBM (Longterm Hold) based on Wyckkoff and Large GartleyThis a HUGE pattern spanning over years both the Gartley Harmonic as well as the wyckoff Accumulation, which has recently backtested the spring and is jumping the creek. The dividends are insane on IBM too, so this is longterm account with great growth potential (better than cash). Obviously the best entries were down at the spring and backtest, but with the recent breakout of 7-8 year downtrend for the creek


IBM breaking 8 year downtrendIBM is beginning to break out on the weekly chart from a trend line that was acting as strong resistance for over 8 years.
Recently the company has unveiled the world's first 2nm chip and announced previously that it will begin focusing on Cloud and AI which will serve the company well as those are two large secular growth stories. Go Long IBM. Trades at 9.79 EV/EBITDA ratio, well run company financially with a long growth path ahead of it.
I expect IBM and INTC to be some of the main beneficiaries of the bill that just passed in the senate today that okayed $54 billion dollars for the Semiconductor Industry to focus production on American soil and improve research efforts. INTC and IBM have long been the American blue-chip players in the space and are currently collaborating in advanced semiconductor research. This is a timely partnership as INTC is building two new fabs in Arizona and IBM just released its 2nm chip but does not manufacture its own chips (ahem ahem INTC).
Long-term Price Target: $250
Daily Chart w/ Golden Cross:

IBM hitting resistance very slow mover compared to others, at big trendline resistance... if it breaks it can fly! but most likely goes lower here pretty soon. puts?

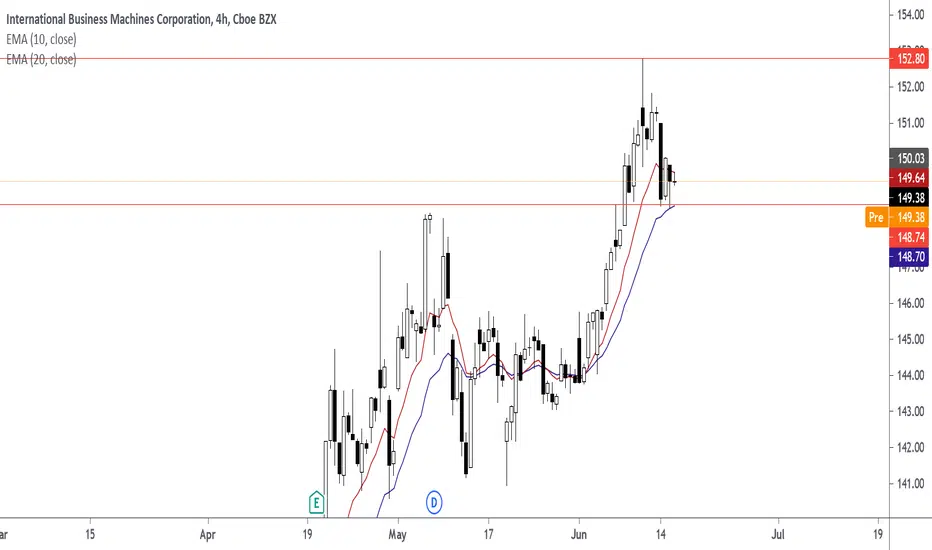
New heights await IBM.On May 26, the price broke through the resistance level of $ 141 and went up to $ 148, from where it rebounded later. Now the price is testing the $ 148 resistance level again. If it breaks through and consolidates there, then there is a growth potential of $ 155 or may rebound to $ 141. It cannot be ruled out that the price may move sideways for a while, until it breaks through the resistance or support level.
If you like the idea, subscribe and like it.
Good luck and big profits.

$IBM trying to break out the upper trendline NYSE:IBM IBM is touching again the upper trendline this can go either way but we can see some run up because earnings coming next month.
over $150 for a long term looks good and a possible golden cross in the 3D chart coming soon for more confirmation. below $140 for the downside or bounce play.
RED lines are support levels that we can use as bounce levels intraday.
BLUE lines are Resistance levels

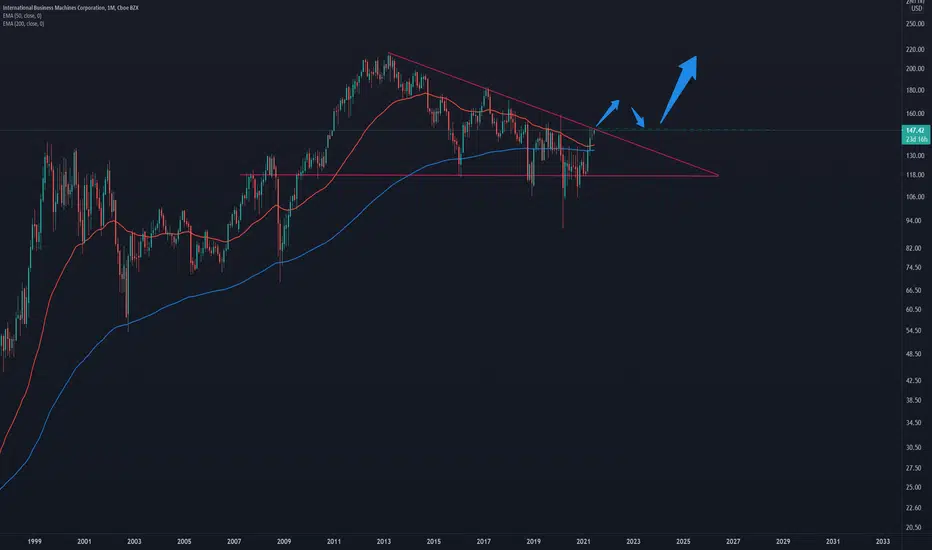
IBM Monthly BreakoutIBM monthly chart is potentially about to breakout of an almost decade long triangle pattern .
50 EMA came down to the 200 EMA and just turned back up.
If it breaks out successfully I would expect prices to go back to the 2013 ATH .
IBM attempting to reverse trendIBM closed slightly above a trendline resistance for the first time since 2013. Also an underrated and overlooked aspect of IBM is they're one of the largest players in blockchain technology. I'll be taking a long swing position depending if we hold above the trendline.

IBM is hot again! Swing trade.IBM weekly chart is currently in a downtrend but bullish cross of moving averages and potential break of the trend line could signify a change of trend and a profitable long trade .
I would wait for for the price to break the trend line (black line on the chart) to enter a long swing trade with a stop loss not too far to protect from a failed break.
Levels and targets on the chart.
Trade safe.

IBM S/R Battle!!Hello Community!
When looking at IBM we can see it clearly trading at the top of the triangle shown on the weekly TF. This has been a powerful rejection area in the past. We have to also take into consideration the more a S/R zone is tested the weaker it gets. The MACD is beginning to tick down and the RSI is showing overbought. I can see a rejection happening from here, which would be a great place to start a short with a tight stop-loss. If entering a trade don't forget to use a stop-loss. Don't trade with what you're not willing to lose.
Love it or hate it, hit that thumbs up and comment. It'll be greatly appreciated!
This is not financial advice.
Safe Trading. Calculate Your Risk/Reward & Collect!
Simplicity Wins (

IBM CloudThis cloud company needs to hire more accountants to handle those enormous cash flows. When Wall Street gets word that IBM returns to growth. The candle sticks this chart is going to make will leave non-hodlers envious.
Technicals: 3 drives pattern.

IBM FORECAST - INTERNATIONAL BUS MACHLooks good for shorts above the green line. Stoploss above whiteline. Targets are lines below green. NOT FINANCIAL ADVICE - RECORD KEEPING ONLY.

Hidden IBM reversalI highly suspect that once the IBM has kicked off the spin off IBM GTS to Kyndryl, the SP will confirm the reversal. I feel that Jim Whitehurst has an impact to IBM's future direction by bringing his open source mantra in the executive level, which what made Red Hat very successful.
From a technical perspective, MACD and ADX/DI+ are already showing some very early indications of reversal. So, if the price drops to the support line then I believe its an extremely good buy.

IBM. LONGI have been watching IBM for sometime now. Daily, weekly moving averages support this idea and as we move towards the end of this pennant the monthly open has become support on the verge of breakout within the pennant. 👀 Let's see what happens!

IBM reaching significant resistanceIBM appears to be hitting a wall. This could be a sell the news event now that they announced their new 2 nm chip. Most of the industry is at 7nm. "Buy the rumor, sell the news"

International Business Machines Corporation International Business Machines Corporation is an American multinational technology company headquartered in Armonk, New York, with operations in over 170 countries,
based on the Harmonic Pattern structure that is forming, we will make sure that we monitor Price to reach the Projected target as the Pattern is being filled up to the last major target.

