4IBM trade ideas

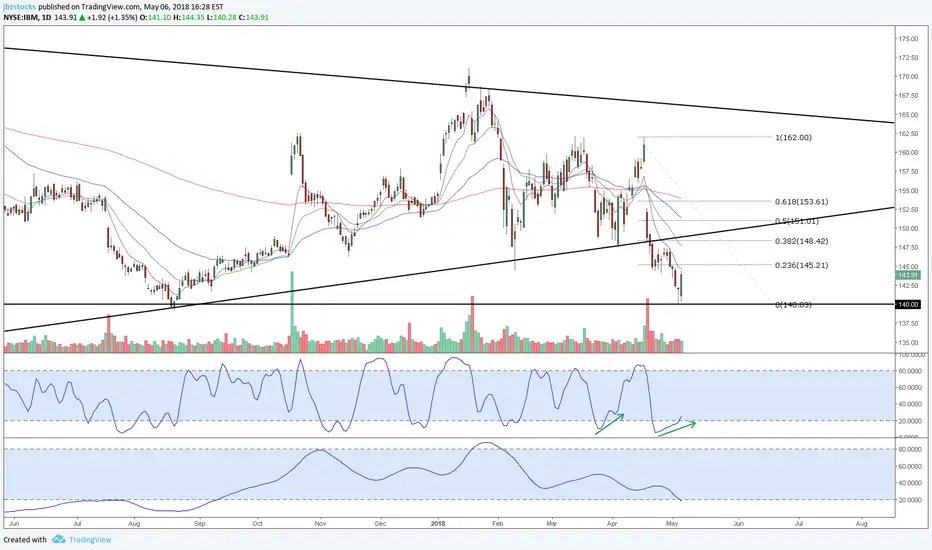
IBM: Ready for a bounce back into the trend channelThere is a chance that "IBM" is moving upwards in the next days.
Entry if the low of May 3 at $139.90 holds and it becomes the low of the first week of May.
Minimum Target: $145.5
Maximum Target: $158.5 (open gap)
Stop loss: $140

IBM - not able to cross the 19 Moving averageChecked with the Weekly and Daily chart. Trends & indicators double checked & confirmed with the 4,2 & 1 hour charts.
EMA: 19 below the 50 and the 9 is crossing below the 50 pointing to the 19
CCI with averages: bounced the +100 and pointing down
Momentum indicator: pointing to the down trend
MACD: Oscillating near to below the zero; bearish momentum
RSI: touching the bottom; oversold
Bollinger Bands: below the MA & touching the Lower Band
Volume: Bearish but reducing
Conclusion : SELL target price to 135 and if trend continues the next & final target would be somewhere between 129-125. Watch out the stock chart and how the market is moving.


Trader's Tips, Part 2: IBM And The Bearish AB=CDAs I wrote about in the previous chart for-AAPL, pay attention to the "W" pattern,
As well as the bearish AB=CD pattern (above).
Above, the indicators turned negative for-IBM after point D of the AB=CD, and-IBM sold off.
Then, IBM-halted at a double top, and sold off again.
Take the time to look at how many DOW-30-stocks have negative formations.
This will give you an inside track as to the direction of the overall market.
Today's Nugget: “The four most dangerous words in investing are “This time it’s different” . John Templeton
May all of your trades go well. Don.

IBM Pullback?In my humble opinion there was a sort of overreaction triggered by short selling yesterday upon IBM's earnings call. Numbers were not great and guidance was lowered. Nevertheless, the blue chip has created a stronger position to capture growth in the IT business related to cloud computing, cybersecurity, and artificial intelligence technologies (15% yoy growth).
I predict a short-term movement upwards shortly after the consolidation period or even today. Do not miss the rally to the support/demand zone, which serves as moderate price level for the IBM stock. The average lowest price target by analysts is $152.00.
However, there is also a strong possibility of decline if bears attack again. Evaluate a stop loss that take into account a false break out scenario that may likely bust the upward breakout in direction to the support zone.
***This information is not a recommendation to buy or sell. It is to be used for educational purposes only.***

The Quiet Giant: Is A $192 Future Still In Play?IBM has a lot of understated, misunderstood, visionary initiatives under its belt starting last year. The name is no longer what it used to be, but IBM has pivoted before under Lou G. and it can definitely do so again if given time and proper execution. There is a small, but powerful minority that will always root for this stock and that will help propel it on any good momentum or guidance. If IBM continues to soak up and lean into the initiatives that it's begun to focus on with cloud, enterprise, AI, supercomputing and more relevant topics, then there is no doubt new management will be able to slowly, but surely transform this old behemoth into a powerful titan with new, relevant skin.
Short term, and perhaps for the year, a $175 price target is easily attainable with good, stable guidance and matched targets. With beats, positive market sentiment and sustained FY '18 guidance that has been reiterated already, hitting $180 is doable. Hitting that magical $192 level would be frosting and cherries on top of having already gotten back to 2015 levels. Expect IBM to be a serious contender at that point.


IBM Long, AI advantageIBM AI I believe is ahead of all other companies. The future is full of AI just like it will be full of chips. Safe long.
Chart also shows its near a bottom trend line.
IBM further correction ahead?IBM, right now in a "Minute"-wave c (blue) , is about or has finished a "Minuette"-wave 2,c in a rising pennant! Trade carefully, a bulltrap above red resistance line is still possible. - First target could be blue support line.

IBM 2 hr - detail of previous chart setupAs noted in previous IBM daily chart.
Trade setup only if price declines into the buy zone at 157, near Ichi cloud base and .50 retracement.

IBM, eyeing small pullback for long entryEMA 13/48 cross took place yesterday. Waiting for small pullback for a better long entry. Price is finally more coiled up after larger chaotic movement.
Price resisted at the confluence of the A) natural 1.27 extension of the Feb 27 to Mar 02 swing, B) Jan 17 to Feb 19 .618 retracement.
Looking for 157-158 entry, profit target 162-164.

IBM next dip?IBM in a final "Minuette"-wave 5 (red), "Minute"-wave c (blue) of a "Minor"-wave 2. First target $142 (1:1 with wave 1 (red). Could go down further (Test of blue support-line)...

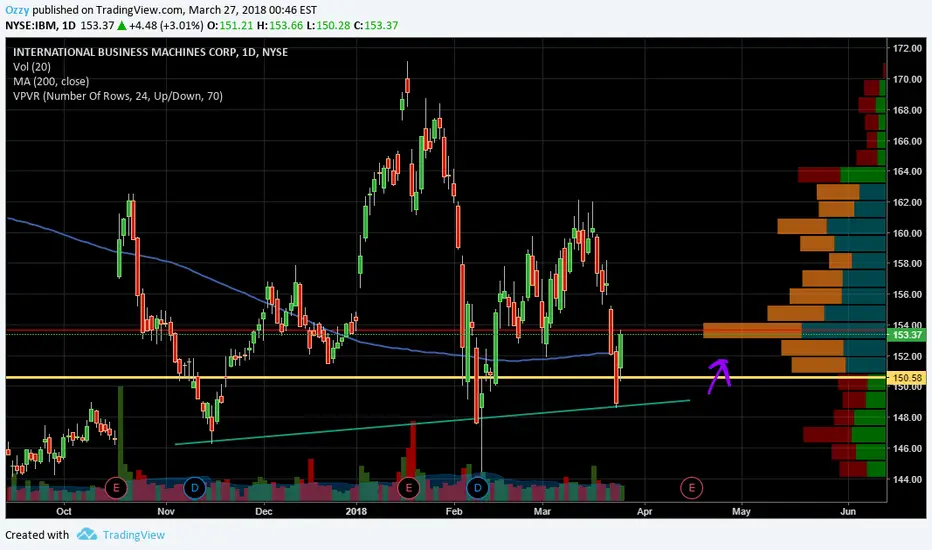
IBM support LongIf the s/r band and the trend line hold, it should be a good long
ENTRY: Anywhere in yellow s/r band
STOP: Below 143ish
2r target: 158ish

IBM Going to Test Key S/RWatch for bullish candle to close above key resistance long-term support at $154 to go long, which coincidentally intersects 200 MA. Big news coming with blockchain technology.


IBM INVERSE HEAD & SHOULDER PATTERNHERE'S A NICE SETUP OF AN INVERSE HEAD & SHOULDER PATTERN ON THE WEEKLY CHART

Bearish Deep CrabIBM, create other cancels other order for target/stop, it may move upwards to fill that gap right above it before heading down again but lets see what happens, still learning.
Target: 159.00
Stop: 164.50
Time Frame: Feb 12th

Bullish 'head and shoulders' (Ithink...)NYSE:IBM has been talked about on some of the main propaganda channels lately so I'm hoping there will be lots of momentum. If successful, it might actually eventuate before the end of Q1.
