IBM - Weekly Swing Trade1. IBM has moved up nicely after bottom in 1Q 2016. Prices exceeded the weekly 200sma for the first time in 18mths and have reached a Measured Move target around $184.
2. Prices are due for a 10bar/2 leg retracement or consolidation before continuing upward to test $190-$200.
3. Continue to watch the pullback and look for an entry near the Breakout level of $170, which also coincides with the 200sma support.
4. I will update with the options play as we get closer to an entry.
5. Prices have clean trend, respect for 34EMA and an RSI that peaked cleaning with price convergence. Good looking potential setup.
4IBM trade ideas

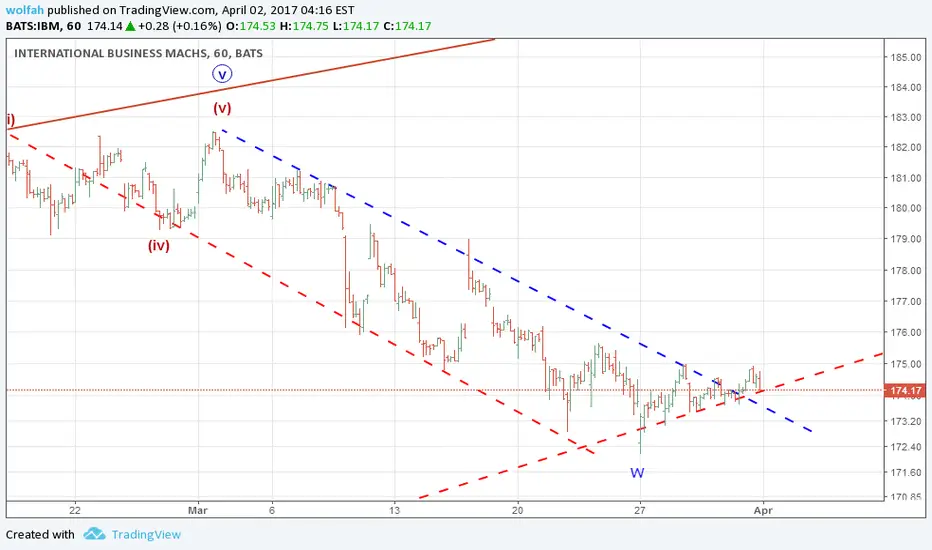
IBM bearish sentimentIBM is moving lower than 20MA and 50MA to test 200MA support at 170. We could see the quasi-triangle in the chart. If the trend further breaks down support line, it will likely get bearish.


IBM, story of a changing trend?With the down trend line broken, the EMA (50) crossing above EMA (200) and the clearing of 2 major resistance levels at 173$ and 176$ respectively, the conditions are very much in favor of more upside gains for IBM. Buying here @ 177.24$ with a stop 175.5$ first target 182.80$ if cleared on the medium run we could reach 191$ even 195$.

Catching some IBMIBM hits support on crossing necklines. Add to long term position with ~$1.5 risk per share.
Good risk reward, tight stop.


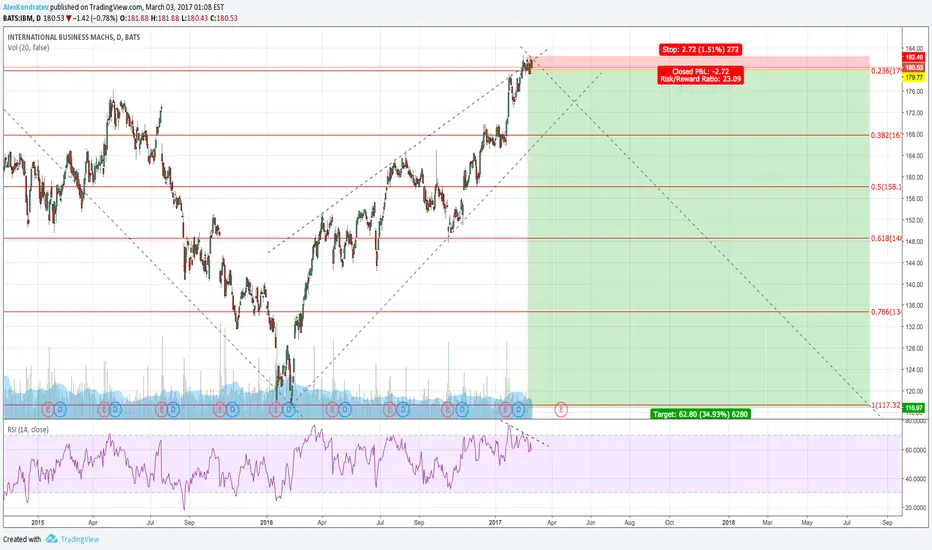
IBM Monthly Chart Pattern, Projection target profit reached!Dear Traders,
As much as technical analysis is concerned, many sources have repeatedly comment umpteen times that the simpler the chart the better, and i agree with that absolutely.
The monthly chart is in fact easy to spot how IBM prices move since 1993 and forming an ascending triangle!
The target project is actually realized at 205.5, i only have enough capital to short 10 shares at 205.5!


buy after a breakout candle, above the previous days highProbably we have a H&S pattern, followed by a consolidated retracement and another PB. moderate RR ratio


Inverse head and shoulders on IBMPrice has broken the neckline of the inverse head and shoulders pattern, I will wait for the pullback to 175-177 and enter with a stop at 167. Take profit above 200.


