Coca-Cola: Nearing Final Wave III HighDespite recent sell-offs, we still expect Coca-Cola to reach a final high of magenta wave within our beige Target Zone between $76.58 and $81.51, which should also mark the completion of the broader beige wave III. However, an alternative scenario—with a 38% probability—remains in play: in this case, the top of beige alt.III would have already occurred, and a direct decline below $60.62 would likely follow. In either scenario, once the high of beige wave III is established, we anticipate a significant correction.
📈 Over 190 precise analyses, clear entry points, and defined Target Zones - that's what we do.
4KO trade ideas

Trading The 3 Step Rocket Booster StrategyTrading within a certain time frame has shown me that its better to set a time stop limit.
This time stop limit tells you when to stop trading your entry.
-
Now does this work? am not sure but i will try anything
that will produce results.
-
Right now am focusing on short term trading strategies.The main aim is to enter on 4 hour time frames.
-
Am hoping that this will increase my trading skills.Either way my focuss is on learning how to trade better setups.
-
Key Point:Dont stop journal-ling your trades on trading-view community.
-
Now on this entry am looking at a rising volume from the bottom of the market.
-
Also we are looking at the rocket booster strategy:
-
It has the following steps:
-
-The price has to be above the 50 EMA
-The price has to be above the 200 EMA
-The price has to gap up.
-
This strategy has become so popular its shocking.Because when i began teaching...
-
it it was not as popular.
-
I call it the 3-Step Rocket Booster Strategy
If you want to learn more about how to find
stocks such as NYSE:KO
-
Rocket boost this content to learn more.
-
Disclaimer:Trading is risky please learn risk management and profit taking strategies.Also do not use margin trading.And use a simulation trading account before you trade with real money.

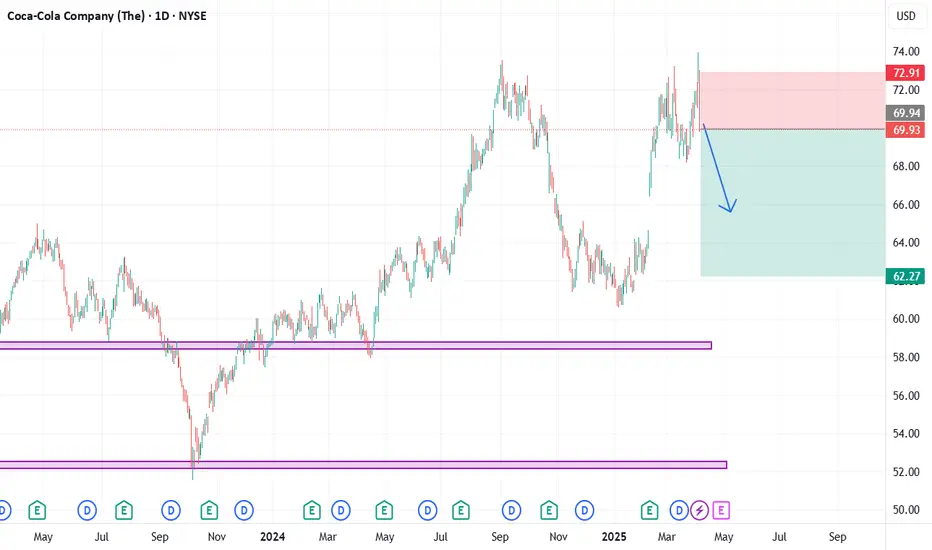
Coca-Cola Wave Analysis – 19 June 2025
- Coca-Cola broke the support zone
- Likely to fall to support level at 68.55
Coca-Cola recently broke the support zone located between the support level 70.35 (which reversed the price twice from May) and the 61.8% Fibonacci correction of the upward impulse 1 from May.
The breakout of this support zone coincided with the breakout of the daily Triangle from April – which accelerated the active correction 2.
Coca-Cola can be expected to fall to the next support level at 68.55 (former monthly low from May and the target for the completion of the active correction 2).

KO stock on sale todayIt is at a support level, pays dividends soon, has solid fundamentals, its a buy today from me I am increasing my position in Coca Cola. The range of the intrinsic value is between $50 and $180.

How To Buy A Short Squeeze Using This 3 Step SystemToday i felt lifted and happy.
But Yesterday i was very sad
because of a silly fight
with a drunk friend of mine.
Need i mention i was sober.
I had to self defense myself but i feel much
better after writing down my feelings.
Basically i had to run away from the
fight.There is nothing
wrong with running away.In fact running
away from a fight is the best self defense.
What a friend does to you hurts more
than an enemy.
Notice that in the movies the bully
looks like a friend in disguise.
Always around at the right time.
Anyway if you look at this chart you will
notice that the price is in an "overbought" zone
This is what Tim Sykes calls a short squeeze.
When the short sellers buy to cover.Or decide to take
a profit or loss depending on there position.
Now granted this chart is following the Rocket Booster
Strategy,Which has the following 3 Steps:
1-The price has to be above the 50 EMA
2-The price has t be above the 200 EMA
3-The price should gap up in an uptrend
Seeing this ticker NYSE:KO
is very interesting because it is a popular stock.
Rocket boost this content to learn more.
Disclaimer;Trading is risky please learn more about risk management
and profit taking strategies.Do not use margin and use
a simulation trading account first before you trade with real money.

Simple Coca Cola daily chart analysisCoca Cola, my favorite defensive stock seems to be at a price decision in time. I have found a single trend line that looks reasonable. There seems to be a lot of congestion in price over the last few days this leads me to believe a breakout is coming soon. 25% of my portfolio is Coca Cola, it pays great dividends and I love the history of the company. It is a solid choice for these economically uncertain times, I think they do soda better than anyone else I been drinking Coca Cola as long as I can remember its still my favorite.
I believe its possible to see a retracement down to cheaper prices but I also don't believe in waiting for such occurrences to happen so I have already been accumulating for the last few weeks. The range of the intrinsic value of Coca Cola is between $50 - $180. My prediction for the price is that it will go up over the next 12 months. Thank you for reading my article and best wishes, cheers.

Coca-Cola: IndecisiveCoca-Cola continues to trade sideways, still failing to confirm either of our scenarios definitively. The primary scenario envisions that wave III in beige will post another high within the beige Target Zone ($76.58–$81.51), which offers a potential setup for short positions. Following that, wave IV in beige should begin a substantial correction. However, if the stock fails to overcome resistance at $74.38, it could indicate that the top of wave alt.III in beige is already in. A decline below the $66.05 support level would activate the alternative scenario (35% probability), implying a drop below $60.62.

KO 1D — A Diamond Not Yet Broken, But Already CrackingOn the daily chart of Coca-Cola, a classic diamond top structure is forming — not yet completed, but clearly visible. The market expanded its range in the initial stage, then began to compress into a tighter zone, creating the typical shape of a diamond. This isn’t a continuation pattern — it’s the setup phase for redistribution.
The key level sits at $68.50 — the base of the diamond. As long as this line holds, the pattern remains inactive. But current price behavior says more than enough: weakening momentum, falling volume, and a lack of aggressive follow-through on recent highs. This isn’t accumulation — it’s preparation.
Price is currently trading between the MA50 and MA200, signaling a neutral phase with downside risk. The moving averages are narrowing, but no crossover has occurred yet. That’s critical — the trend isn’t broken, but it’s clearly losing energy. If $68.50 gives way, the measured move from the pattern projects a decline toward $61.82.
From a fundamental standpoint, Coca-Cola remains stable — but uninspiring. Earnings met expectations, revenue was steady, and no major catalysts are visible. In this type of environment, technical structure often becomes the tool for institutional rotation — not because the story collapsed, but because the setup makes sense.
The edges of the diamond are in place. All that’s missing is the break. If the neckline fails, the downside scenario is already built — structurally and logically.

How to draw support and resistance levels the right way?
1️⃣ Why Are Support and Resistance Levels So Important?
Support and resistance levels show where price has reacted strongly in the past. These are zones where many traders including large players have placed buy or sell orders.
Support = where buyers step in and push price up
Resistance = where sellers step in and push price down
These levels are important because they act like decision zones:
- Price might bounce from these levels
- Or break through and start a new move
- Or even fake out traders before reversing again
Knowing where these levels are gives you an edge:
- You can better time your entries and exits
- You avoid chasing price in the middle of nowhere
- You prepare for market reactions not random guesses
Think of them like traffic lights for the market when price hits them, something important usually happens.
2️⃣ Three Main Types of Support and Resistance
There are 3 key types of support and resistance levels traders commonly use:
- Level-Based: Horizontal zones drawn from key highs and lows
- Pattern-Based: Support/resistance found in chart patterns like triangles, flags, etc.
- Channel-Based: Diagonal trendlines showing support and resistance in a channel
Today, we focus on level-based support and resistance horizontal lines drawn on key price zones.
3️⃣ How to Draw Support and Resistance Levels
Use daily, weekly, or monthly timeframes to find major zones. These higher timeframes give you stronger, more respected levels.
Look for:
- Candle bodies that close and open around the same price
- Strong wicks rejecting a certain level
- Zones where price has bounced multiple times in the past
I often pick:
- The close of a red candle
- The open of the next green candle
These spots usually show where sellers lost control and buyers stepped in — or vice versa.
4️⃣ Timeframes and Their Strength
The higher the timeframe, the stronger the level:
- Monthly = very strong, long-term zones
- Weekly = strong and reliable
- Daily = useful for swing trading
- Lower timeframes (15m, 5m) = more noise, less reliable unless you're day trading or scalping
Pick levels based on your strategy:
- Swing traders = use daily/weekly/monthly
- Scalpers = lower timeframes with extra confluence (volume, structure)
5️⃣ Don’t Use Support/Resistance Alone
Support and resistance are helpful — but not enough by themselves. Always combine them with:
- Market structure (higher highs/lows)
- Volume confirmation
- Indicators or price action signals
You want to watch how price reacts at your levels. Wait for confirmation before making decisions.
6️⃣ Common Mistakes Traders Make
Mistake 1: Drawing too many levels clutters your chart and creates confusion.
Mistake 2: Keeping old levels that have already been broken or invalidated.
Mistake 3: Ignoring volume. Just because price hits a level doesn’t mean it will reverse. You need volume to back the move.
Also:
Don’t enter blindly on breakout, breakouts can fail. Wait for confirmation.
Don’t assume a level is strong just because it’s touched once — look for multiple rejections.
7️⃣ Example: How I Draw Support/Resistance
Let’s say I’m looking at a daily chart.
- I find a red candle that closes at 42,000
- Then a green candle opens at 42,000 and pushes higher
That tells me buyers stepped in at 42,000 — this is a potential support.
I draw my horizontal line across that level.
Then I zoom into 30m or 15m charts to watch price behavior when it comes back to that level.
If price respects it again, I may enter a trade based on the reaction.
This technique gives me more confidence and clarity.
I know where liquidity might be waiting.
I can combine it with indicators or volume tools.
I avoid random trades.
🔄 Summary
Identify a timeframe – Use the monthly, weekly, or daily chart.
Look for two candles – Draw your support or resistance line at the point where one candle closes and the next one opens.
Make sure the level hasn’t been hit yet – This helps you spot areas where liquidity grabs might happen.
Wait for price to reach the level – Once price touches the support or resistance zone, watch how it reacts.
After price touches the level, remove it – Once tested, that level is no longer fresh and should be cleared from your chart.
Support and resistance isn’t magic — but used with confluence, it becomes a powerful guide.
Please LIKE 👍, FOLLOW ✅, SHARE 🙌 and COMMENT ✍ if you enjoy this idea! Also share your ideas and charts in the comments section below! This is best way to keep it relevant, support us, keep the content here free and allow the idea to reach as many people as possible.
Disclaimer: This is not financial advice. Always do your own research. This content may include enhancements made using AI.

Exposive setup in conservative Coca-Cola stock.This superimposition of Cup and Handle and Ascending triangle pattern creates a positive setup in KO.

COCA COLA : Resistance break Hello there,
KO IDEA.
2 years of consolidation break this month.
Target is 85-87 $
Best enter : retest of the trend
Safe enter : Ath Break and retest
Good luck

KO: Sell ideaOn KO we would have a high probability of having a bearish trend if and only if the vwap indicator is broken forcefully by a large red candle and followed by a large red volume.

COCA-COLA: This is a +43% wave, aiming at $82.Coca-Cola is about to turn bullish on its 1D technical outlook (RSI = 53.500, MACD = -0.130, ADX = 31.368), trading on a flat 1M candle, coming off another flat candle before it (April). This neutrality has historically been a re accumulation period for the stock. Given that its most recent low was on the 0.382 of its multi year Channel Up and the rebound took place on the 1M MA50, we expect at least a +43.22% rise from there. On this pattern, all rallies that started on the 1M MA50, grew by at least +43.22% and touched the 0.786 Fibonacci level of the Channel. Our TP = 82.00 and we expect to get there by the end of the year.
## If you like our free content follow our profile to get more daily ideas. ##
## Comments and likes are greatly appreciated. ##

Rotating out of defensive, bear trap seen on CokeNYSE:KO had enjoyed a strong upside since Jan 2025, netting a gain of more than 20%. However, recent price action has suggest that Coke is looking at a near-term correction after a bearish morning star was see forming at 72.00 psychological resistance. Furthermore, the stock has formed a bull trap where it fails to close above 3% after breaking 72.00.
MACD remain bullish on the longer-term horizon but stochastic oscillator has shown an overbought signal and forms a bearish divergence. 23-period ROC also display similar outlook. Volume has picked up and is likely going to see further downside pressure.
Key support to watch are at 68, 65 and 63

Shares of Coca-cola Set For Breakout Amid Golden Cross Pattern The Coca-Cola Company (NYSE: NYSE:KO ) on Tuesday reported first-quarter sales below analysts' estimates but profit that topped expectations, as the beverage giant navigates tariff uncertainty.
Earnings Overview
The company said its "comparable," or adjusted, earnings per share came in at $0.73 on revenue that declined 2% YoY to $11.1 billion. Analysts expected $0.72 and $11.22 billion, respectively.
CEO James Quincey said:
"Despite some pressure in key developed markets, the power of our global footprint allowed us to successfully navigate a complex external environment."
Coca-Cola Says Operations 'Subject to Global Trade Dynamics'
In an update to its full-year outlook, Coca-Cola said that its "operations are primarily local, however, it is subject to global trade dynamics which may impact certain components of the company’s cost structure across its markets. At this time, the company expects the impact to be manageable."
Technical Outlook
Shares of Coca-Cola ( NYSE:KO ) were down about 1% shortly after the market opened Tuesday. They entered the day up about 15% since the start of the year. As of the time of writing, the stock is up 0.49%.
Albeit earnings missed estimate, the 4 hour price of Coca-Cola shares (NYSE: NYSE:KO ) depicts a golden cross pattern- this is a metric that is generally seen as a bullish reversal with its counterpart known as "Death cross". With the RSI at 51 and the Golden cross pattern, NYSE:KO might be on the cusp of a bullish campaign.

Tramp do not share a cola to EUR and other countriesHello dear traders! Maybe today buy a cola, drink it and hope that the price will not rise by 30%!
Today in Latvia the cheapest price that can be found in retail stores is 1.20 EUR/L. Trump will introduce very drastic tax rates next week and this will affect both American consumers and Europeans!
08.05.1886 The first delicious drink was invented by Dr. John Pemberton, it was bought by consumers and imitated by many other manufacturers. Today we are preparing for it to cost more and more!
The brand is very popular and influential, but it brings with it a price. Trump's taxes will further introduce adjustments to these prices. There will be a temporary price increase, because everyone will not want to buy a drink with additional taxes and this will cause them to buy less cola and the company's value will fall. This will also be reflected in the shares!
I think now is the right time to sell shares so that we can get a small profit on this market manipulation move in 2-3 months!
We are ready. Let's sell!
Coca-Cola Company (KO) Shares Trade Near All-Time HighCoca-Cola Company (KO) Shares Trade Near All-Time High
Stock market charts indicate that from the start of last week’s trading through to its close:
→ The S&P 500 Index (US SPX 500 mini on FXOpen) declined by approximately 3%;
→ Pepsico (PEP) shares dropped by more than 1%;
→ Coca-Cola Company (KO) shares rose by around 2.4%.
Why Aren’t Coca-Cola Shares Falling?
The relatively strong performance of Coca-Cola (KO) shares compared to the broader market and its main competitor may be attributed to the fact that Coca-Cola operates a concentrate production facility in Atlanta, USA. In contrast, Pepsico’s equivalent production is based in Ireland. This gives Coca-Cola a potential advantage under the tariff policies pursued by the Trump administration.
Incidentally, according to media reports, Diet Coke is the favourite drink of the US President.
Technical Analysis of KO Stock Chart
In 2025, KO stock has been forming an upward channel, though the current price is approaching key resistance levels:
→ the upper boundary of this ascending channel;
→ the $73 level, above which several successive all-time highs have been formed. However, price action suggests that bulls have so far struggled to establish a foothold above this mark.
It is possible that the upcoming quarterly earnings report, scheduled for 29 April, could provide a positive catalyst for KO’s share price.
This article represents the opinion of the Companies operating under the FXOpen brand only. It is not to be construed as an offer, solicitation, or recommendation with respect to products and services provided by the Companies operating under the FXOpen brand, nor is it to be considered financial advice.

KO Short SetupTriple top on technicals. Stretched valuation with 25 forward p/e + crowded rotation trade to staples + continued short term Vol in equity markets should send KO lower in next few months.
I'm buying OTM June 25 puts.
This is not financial advice. good luck!

KO - Dip Below Middle LineKO shows dips below the middle of this large ascending structure on the Weekly timeframe
Right now this dip is occurring, following this dip price should accelerate up through the Wedge
Very bullish if you want to go very long
Weekly timeframe

Coca cola is above breakout level Coca cola is above from breakout level of 69. It is expected to cross 80 and 90 levels.
Note: This is not a buy sell trade call. Trade at your own will. Use stop loss.

This 3 Step System Is Called The Rocket Booster StrategyIn this video i give you the full demonstration of the
3 step system called the rocket booster strategy
using the new and improved screener by
trading view
The rocket booster strategy is as follows:
-The price has to be above the 50 EMA
-The price has to be above the 200 EMA
-The price has to gap up
In this video you will see
how to do it right here on tradingview
no fluff just striaght to the point
Trade safe
Remember to rocket boost this
content to learn more.
Disclaimer: Trading is risky you will lose money whether
you like it or not
please learn risk management and profit taking strategies
and feel free to use a simulation trading account
before you trade with real money.

Free Report #2:The SImple Guide To Trading Stock OptionsThis is the 3 Step Strategy
Am going to show you in this video
to help you with trading stock options.
Watch it to learn more.
#1-Wait for Momentum/Rate Of Change/ Bull Power indicator
#2-Wait for a candlestick chart pattern confirmation
#3-Use the Rocket Booster Strategy
If you want to learn more check out the resources and rocket boost this content
Disclaimer: Trading is risky please learn
risk management and profit taking strategies.
Also feel free to use a simulation trading account.

Rocket Booster Strategy + The #1 Indicator Power Force TeamThis #1 indicator helped me find this stock
which is trending on twitter right now
honest to you i didnt think
i would find it using this indicator but am glad
i did.This is why am sharing it with you
today.
In this video i also show you the rocket booster strategy
which is as follows:
Step#1-The price has to be above the 50 SMA
Step#2-The price has to be above the 200 SMA
Step#3-The price should gap up in a trend
The last step is very important because
it shows you the price correction of the chart
you have decided to trade
Rocket boost this content to learn more
Disclaimer:Trading is risky please learn
risk management
and profit taking strategies
Also feel free to use simulation trading
account before you trade with real money
