7/17/22 LLYEli Lilly and Company ( NYSE:LLY )
Sector: Health Technology (Pharmaceuticals: Major)
Market Capitalization: $315.073B
Current Price: $331.60
Breakout price: $334.70
Buy Zone (Top/Bottom Range): $314.00-$292.90
Price Target: $364.20-$367.50 (2nd)
Estimated Duration to Target: 112-120d (2nd)
Contract of Interest: $LLY 10/21/22 350c
Trade price as of publish date: $13.50/contract
4LLY trade ideas

Keeps on Going!LLY has had an amazing run to the upside.
Some would think it is a bit overvalued here, but that does not always matter.
Value is not always the most important thing it seems, so it just depends on when folks are ready to sell.
It is like a "Domino" effect
Be safe up there
No recommendation.
Spinning top right now on daily/indecision

WallStreet Trading: Buysignal LLYThe stock LLY on our US watchlist just broke out of a sound base and triggered a buy signal. We are adding a 1/2 position to our US model portfolio.
SL can be set at 314.9 (4% risk). Profit target is > 10%.

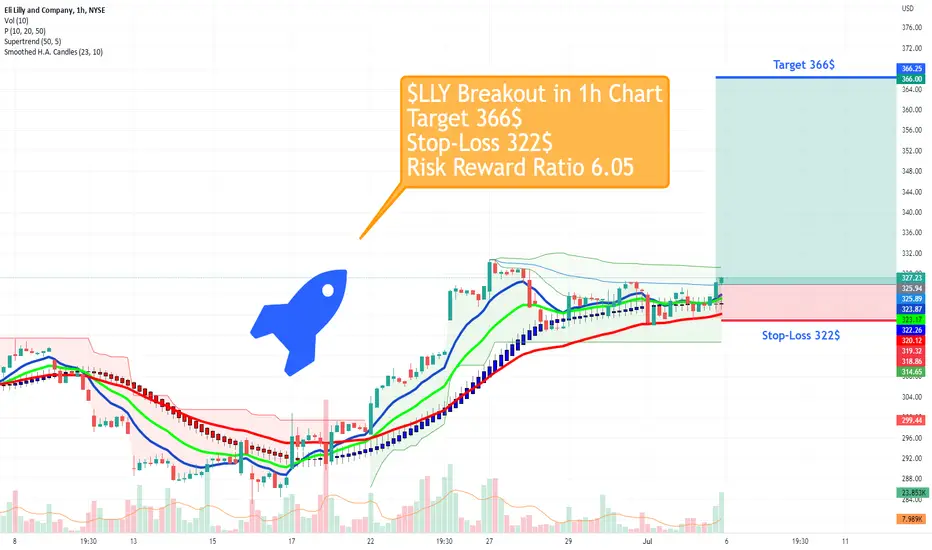
$LLY Breakout #fintwit #supertrend#LLY Breakout 🚀 in 1h Chart - Target 366$ 🧲
All Entry Criteria have been met:
1. Price above 10, 20 & 50 EMA ✅
2. Consolidation Phase in Uptrend ✅
3. Breakout on above average Volume ✅
$LLY All Time High BreakoutBiotech/Healthcare are certainly seeing inflows of money from institutions. The RS on this name along with the clear volume accumulation is really nice. Potential consolidation into ATH Breakout.

LLY Fib Circle Scenario (MACD top)Comparing two points of price and MACD
The MACD is very similar in both points, very over extended
This correlates well with the 1.618 fib level, which allows price to move down along the circle as the MACD retraces, as seen in the first scenario (0.618)

LLY New All Time HighsLLY made a New All Time High on Friday
Clean Base Breakout
8 Week Long Base
Price above 200DMA
Volume is higher than 50 Day Average Volume
Measured Target: 353

$LLY#$LLY
Today close important. Need to open and close above $314
Stock had done week during the fall last few weeks.
Need Volume to buy.

Symmetrical TriangleThis pattern is neutral until a trendline is broken with a trend in that direction.
Price has hit the resistance line of the triangle twice with a candle wick with the 2nd attempt to break the resistance today. The bottom trendline is support until broken.
Short percent is very low and under 1%.
There is a suspicious W in this chart. There are rising wedges below price that are not valid as the bottom trendline has not been broken.
No recommendation.

LLY BREAK OUTAfter a 60 day base and a 2T VCP from 11.75% to 5.85% LLY gives a low risk entry point @ 294.34. Will manage as 1/3 profit on 1R (Moving stop to break even), 2/3 profit at 2R and give the rest room for a higher move.

$LLY Breakout - Target 356$ Same rational as always: strong up move, consolidation and reclaim of vwap - Target 356$


$LLY Volatility Contracting$LLY one I am watching - holding up good and orange shade showing up on the chart indicating volatility contracting.
Would like to see volume drying up here.

$LLY Breakout - Target 313$Same rational as always: Strong Up move - consolidation - reclaim of lower vwap band - let the show begin :) Target 313$
$LLY with a Bullish outlook following its earnings #Stocks The PEAD projected a Bullish outlook for $LLY after a Positive over reaction following its earnings release placing the stock in drift B with an expected accuracy of 66.67%.
LLY at resistance and overbought historicallyWay overbought on all technicals, looking for a pullback to $270 range in the next week or so. Will add every $2 increase in stock price up. Will cover at or under target.

Eli Lilly USA Sun Storm Investment Trading Desk & NexGen Wealth Management Service Present's: SSITD & NexGen Portfolio of the Week Series
Focus: Worldwide
By Sun Storm Investment Research & NexGen Wealth Management Service
A Profit & Solutions Strategy & Research
Trading | Investment | Stocks | ETF | Mutual Funds | Crypto | Bonds | Options | Dividend | Futures |
USA | Canada | UK | Germany | France | Italy | Rest of Europe | Mexico | India
Disclaimer: Sun Storm Investment and NexGen are not registered financial advisors, so please do your own research before trading & investing anything. This is information is for only research purposes not for actual trading & investing decision.
#debadipb #profitsolutions

3/13/22 LLYEli Lilly and Company ( NYSE:LLY )
Sector: Health Technology (Pharmaceuticals: Major)
Market Capitalization: $253.61B
Current Price: $266.30
Breakout price: $270.95 (hold above)
Buy Zone (Top/Bottom Range): $262.45-$247.10
Price Target: $308.00-$310.40
Estimated Duration to Target: 84-90d
Contract of Interest: $LLY 6/17/22 300c
Trade price as of publish date: $5.90/contract

Eli Lilly up and up. LLYShort term and temporarily.
Immediate targets 257, 263, 272. Invalidation 232.
We are not in the business of getting every prediction right, no one ever does and that is not the aim of the game. The Fibonacci targets are highlighted in green with invalidation in red. Fibonacci goals, it is prudent to suggest, are nothing more than mere fractally evident and therefore statistically likely levels that the market will go to. Having said that, the market will always do what it wants and always has a mind of its own. Therefore, none of this is financial advice, so do your own research and rely only on your own analysis. Trading is a true one man sport. Good luck out there and stay safe

$LLY with a Bullish outlook following its earnings #Stocks The PEAD projected a Bullish outlook for $LLY after a Negative Under reaction following its earnings release placing the stock in drift D with an expected accuracy of 40%.


US FDA approves Jardiance® (empagliflozin) to treat adults with LLY: Eli Lilly and Company
2022-02-24 16:00:00
US FDA approves Jardiance® (empagliflozin) to treat adults with heart failure regardless of left ventricular ejection fraction

LLY short biased LLY forming a nice harmonic that i would like to see pull back don to the trendline in the rising wedge.lots of divergence on higher time frames. the move has already started so maybe look to try and see a pop to go back in short.
Not financial advice
