LLY short biased LLY forming a nice harmonic that i would like to see pull back don to the trendline in the rising wedge.lots of divergence on higher time frames. the move has already started so maybe look to try and see a pop to go back in short.
Not financial advice
4LLY trade ideas

Symmetrical TrianglePrice broke upper trendline of triangle on the 5th touch then a throwback occurred. Price is back in the symmetrical triangle again. Not quite to long entry level.
This pattern is neutral until a trendline is broken with a trend in that direction.
Todays candle at the moment I write this is a Doji, a candle of indecision
If price breaks upward, then possible stop under top trendline.
No recommendation

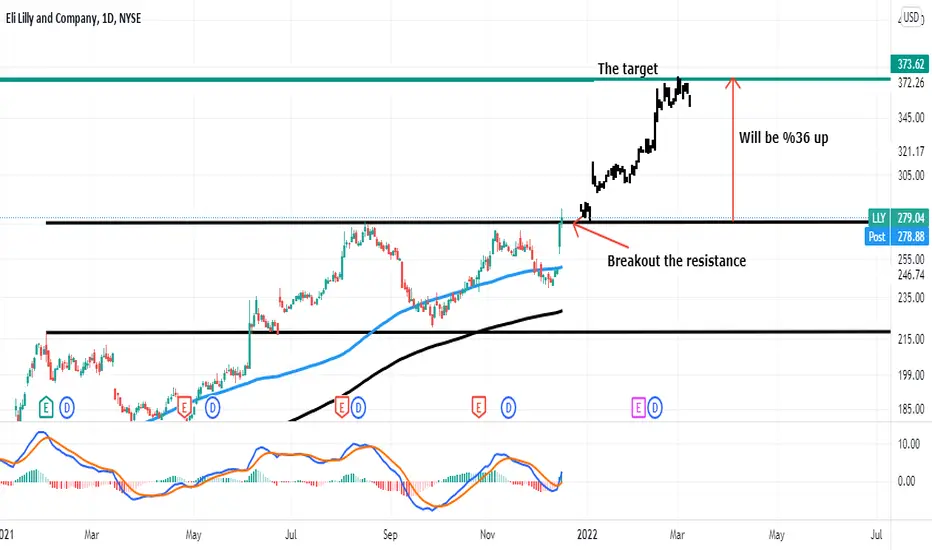
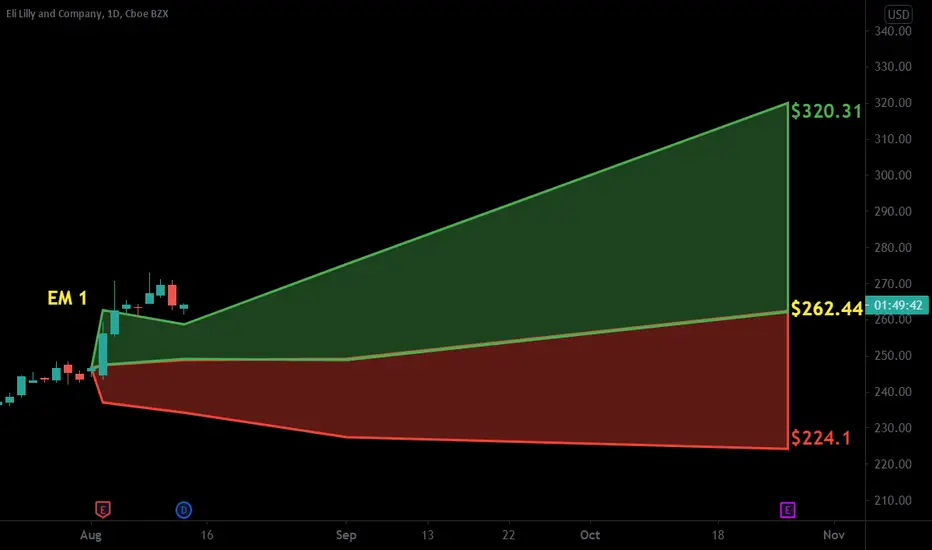
Eli Lilly and Company, Daily Chart Eli Lilly and Company is Pharmaceutical company.. I see amazing buying opportunity, and great target by %36 up.
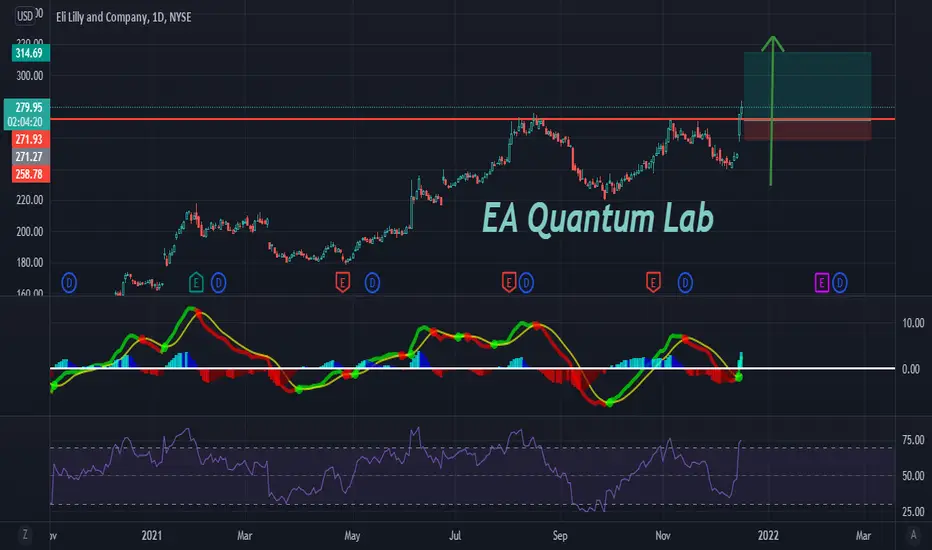
Go to the ATH!The stock broke through a good resistance level and is steadily moving higher. We expect growth up to $315 per share. Products of this company are in demand.
❤️ If you find this helpful and want more FREE forecasts in TradingView
. . . . . Please show your support back,
. . . . . . . . Hit the 👍 LIKE button,
. . . . . . . . . . . Drop some feedback below in the comment!
❤️ Your Support is very much 🙏 appreciated!❤️
💎 Want us to help you become a better Stock trader?
Now, It's your turn!
Be sure to leave a comment let us know how do you see this opportunity and forecast.
Flat on Eli Lilly. LLYWe are not in the business of getting every prediction right, no one ever does and that is not the aim of the game. The Fibonacci targets are highlighted in purple with invalidation in red. Fibonacci goals, it is prudent to suggest, are nothing more than mere fractally evident and therefore statistically likely levels that the market will go to. Having said that, the market will always do what it wants and always has a mind of its own. Therefore, none of this is financial advice, so do your own research and rely only on your own analysis. Trading is a true one man sport. Good luck out there and stay safe!

LLY Long Opportunity LLY has provided a nice long opportunity with the recent break above the major trendline
This breakout is comparable to a previous point, which led to a large megaphone price structure
Price will likely stay above the trendline and climb within the megaphone (attempted to roughly sketch what it would look like)


LLY - STOCKS - 21. OCT. 2021Welcome to our Weekly V2-Trade Setup ( LLY ) !
-
4 HOUR
Small pullback towards previous sr level.
DAILY
Expecting more bullish pa!
WEEKLY
Overall great market structure.
-
STOCK SETUP
BUY LLY
ENTRY LEVEL @ 241.21
SL @ 231.90
TP @ Open
Max Risk: 0.5% - 1%!
(Remember to add a few pips to all levels - different Brokers!)
Leave us a comment or like to keep our content for free and alive.
Have a great week everyone!
ALAN

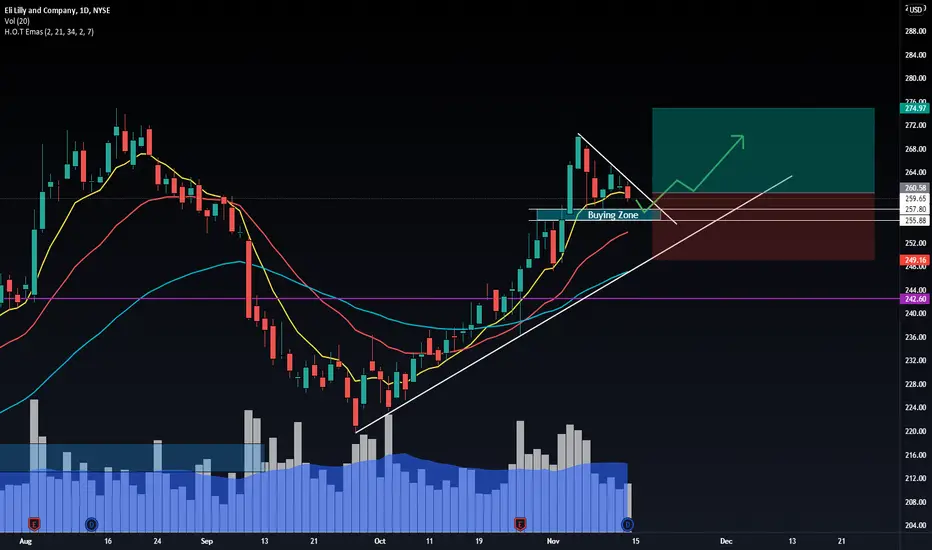
LLY trianglePulling back towards a potential buying zone ( 257.80 - 255.85)
Below that area we have a trendline that could also offer support.
Will wait for either a rejection off the buying zone or a break of the triangle
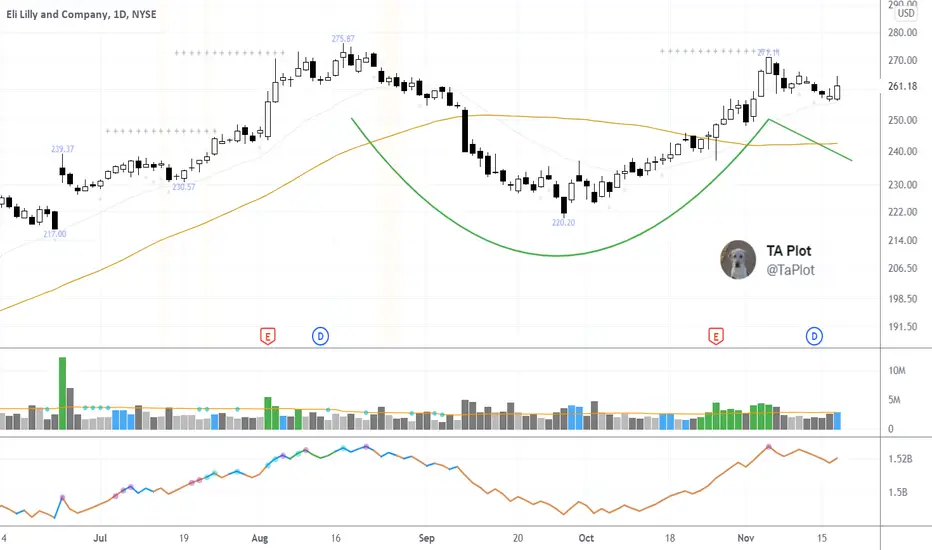
$LLY 3 Months Cup with Handle Setup$LLY also being added to the watch list. putting in a 3 month cup with handle after an impressive uptrend.
Strong demand coming up the right hand side of the cup.
LLY - Weekly Chart BoDWeekly chart shows second Buy on Dip signal near Resistance turned Support Zone and uptrend line at 220
Current price to support is around 12% (i.e 12% risk if to place your SL at below 220)
Strong and nice uptrend
FiFT Turned +ve
under Healthcare Tecnology Sector.
Earnings on 26 Oct BMO
ROE 102%, EPS this y 37%
Gross Margin 74%
Analyst target 270
Risk Reward Ratio pretty attractive but i would prefer to wait after Earnings.

$LLY Bullish Pennant, Unusual Options Activity$LLY Bullish Pennant, Unusual Options Activity
$360M of January'22 deep in-the-money calls bought today (8-9x open interest)
On watch for a daily close outside the pennant (topside).
Near term target: $300-$310 range possible by early December
Note: This is NOT investment advice.

LLY moving to the top of this range.Just like my last post this is highlighting LLY moving up. Just with arrows this time lol

LLY moving to the top of this range.Looks as though it is moving to the top of the range I provided.

LLY ShortBearish engulfing
At Resistance Zone
Short Entry 240
Stop 247
Target1 205 -- next demand Zone
Target2 192 -- ABC pattern
Risk management is much more important than a good entry point.
The max Risk of each plan should be less than 1% of an account.
I am not a PRO trader. I trade option to test my trading plan with small cost.

Potential 2down 2up reversal on the weekly chart for LLYPer the Strat, this week I'm watching ticker LLY (Eli Lilly & CO) for a weekly entry trigger at 235.39 (last weeks high). If that trigger is met, I'll look for it to reach a magnitude of 241.15 (week before last weeks high). If it can reach magnitude, then it could also continue up to previous highs. Just look out for exhaustion risk to the upside if it continues up after the original 241.15 magnitude.

LLY longEntry price: 243-245$
Target price: 283$
Stop loss: 240-243$
Bollinger Bands: The price is under the lower band.
RSI: Indicator crossed the 30 level, therefore the assets is oversold.
Conclusions: RSI and Bollinger Bands suggests upcoming trend reversal. However the price already crossed the 1.618 Fibonacci Retracement level, thus the entry price is recommended above that line with the stop loss under 243$ in case of continuation of the trend and retesting the new resistance level at that point.
Above information should be treated in informative/education purpose, no financial advice.

LLY (PRICE ACTION) Buy
The term band trend is upward in weekly time
If you pay attention, in time H1 or H4, an upward triangle is created, just like the previous upward triangle, which caused a strong upward movement of the chart, and now it is inside an upward triangle, and by approaching the ceiling, you can buy and wait for a strong upward movement. Let's be
Capital management must be observed
Thank you for liking and commenting


$LLY with a Bullish outlook following its earnings #Stocks The PEAD projected a Bullish outlook for $LLY after a Negative over reaction following its earnings release placing the stock in drift C with an expected accuracy of 66%.
If you would like to see the Drift for another stock please message us. Also click on the Like Button if this was useful and follow us or join us.


$LLY with a Neutral outlook following its earnings #Stocks The PEAD projected a Neutral outlook for $LLY after a Negative Under reaction following its earnings release placing the stock in drift D
If you would like to see the Drift for another stock please message us. Also click on the Like Button if this was useful and follow us or join us.
