4LMT trade ideas

Wedge FormingLMT getting tight at these ranges. Verge of breaking out either side. But the momentum is with the bulls, never go against the trend.

LMT H&S??the target of the rectangle, main figure, has been reached, now it could form an inverted head and shoulders of continuation ??


Short term wedge pattern short term wedge pattern, US biggest military equipment manufacturer company, F35 delivery is continuing for the future of nato and us army.
Not a financial advise I am amateur.

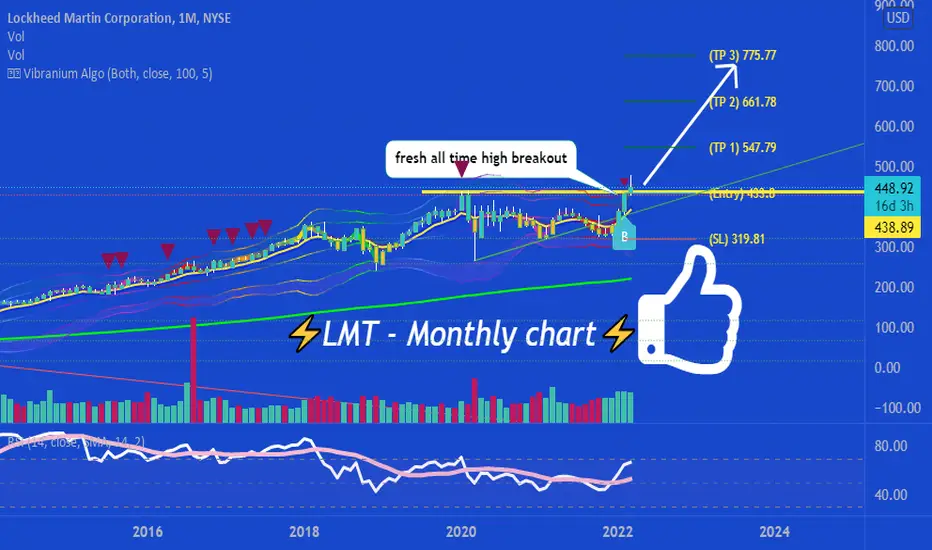
LMT to MOON!!!LMT will surely go to 600-700 mark range since the war between Ukraine and Russia is spicing up day by day. Even though America is not directly involed in the war, America still supplies weapons to Ukraine. This war is just a beginning to much bigger war. So be prepared.
Chaos brings opportunity. USE THIS OPPORTUNITY BEFORE ITS TOO LATE.

LMT, Almost entered today but will wait for price first ....I think that as a theme LMT and related stocks should probably do pretty well going forward . The Ukraine situation will likely act as a justification to increase military and defense purchases which will be good for LMT's sales and net margin.
I was going to enter this today , and it was on my list for a while , I waited for this PB setup and wedge pop but with additional review of the chart , I decided to wait and let LMT's price prove me right first and then I can enter after .
I want to see it break its current 52 week high again and live above it for a bit , then I will catch it open a subsequent pullback or BO setup of some form . I think it def has potential but I'm going to be patient with it , who knows maybe it will prove me wrong too .

LMT RectangleMajor Pattern: Weekly Rectangle
Confirmation Pattern: Daily Flag
Entry on possible today intraday retest: +-402
Last Target 490


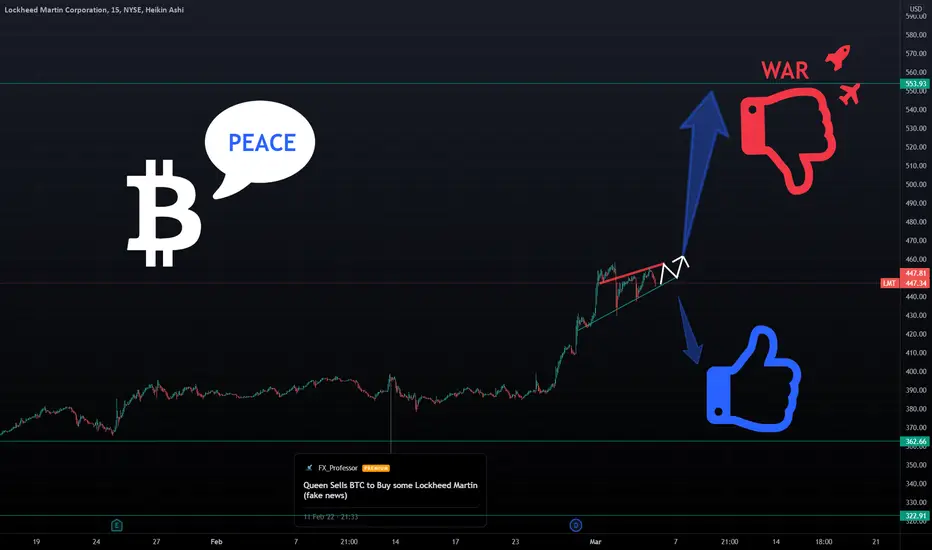
MONEY FROM WAR? / NO, WE INVEST IN PEACE 🕊️☮️₿War profiteering
A war profiteer is any person or organization that derives profit from warfare or by selling weapons and other goods to parties at war. The term typically carries strong negative connotations. General profiteering, making a profit criticized as excessive or unreasonable, also occurs in peacetime. An example of war profiteers were the "shoddy" millionaires who allegedly sold recycled wool and cardboard shoes to soldiers during the American Civil War. Some have argued that major modern defense conglomerates like Lockheed Martin, Boeing, BAE Systems, General Dynamics, and Raytheon fit the description in the post-9/11 era. This argument is based in the political influence of the defense industry, for example in 2010 the defense industry spent $144 million on lobbying and donated over $22.6 million to congressional candidates, as well as large profits for defense company shareholders in the post-9/11 period.
International arms dealers
Further information: Arms Industry
Others make their money by cooperating with the authorities. Basil Zaharoff's Vickers Company sold weapons to all the parties involved in the Chaco War. Companies like Opel and IBM have been labeled war profiteers for their involvement with the Third Reich. In the case of IBM they developed technologies that were used to count, catalog, and select Jewish people whom could then be targeted for efficient asset confiscation, consolidation in ghettos, deportation, enslaved labor, and, ultimately, annihilation.
Commodity dealers
War usually leads to a shortage in the supply of commodities, which results in higher prices and higher revenues. When it comes to supply and demand in terms of economics, profit is the most important end. During war time, "war-stuff" is in high demand, and demands must be met. Prior to the invasion of Iraq in 2003, oil production was controlled by the Iraqi government, and was off limits to Western companies. As of 2014, foreign owned private firms dominate Iraqi oil production.
WE INVEST IN PEACE 🕊️☮️₿,
The FXPROFESSOR
LMT way overbought! Last time I checked the USA was not at warThis stock has surged over 30% on the Russian invasion of Ukraine. Overbought with gaps to fill. Looking for a near term correction to low $400's much lower if by some miracle this ends soon with peace!! Bought April 14th $450 puts, will add on every $20 increase in price.

LMT - Going ballistic????The defense giant is about as bullish as it gets right now. RSI is just right, price action is exciting and nearly vertical, and it's approaching all time highs. It's a good time to be an investor and a scary time if you're thinking about entering. What about day trading? Yes please.
There's a good chance that LMT will at least try to test the all time high within the next couple daily bars. Especially considering that conflicts are breaking out faster than a teenager all over the world. LMT is uniquely positioned to turn lemons into lemonade and a ton of money could get funneled into this beast.
I'm looking for some follow through from today's action, but wouldn't be surprised to see it take a breather before a serious challenge. The result of my analysis? Keep it at the top of the watchlist and set alerts for both ways. This thing can rise faster than a ballistic missile or crash just as quickly as funny looking bird planes from the early 1900s.

Example of Buy the Rumor Sell the news
Let’s look at the recent news with Ukraine. This is example is not meant to lean in any direction of morality as much as it is meant to show how news hints at the direction of the markets.
- The US and EU has been warning of possible Russian invasion since December 2021
- Biden publicly proclaimed this warning multiple times in January
When you watch the news, you can make money by asking yourself logical questions about how this will impact society, and who benefits. Then go invest in those companies.
- Golden Cross on Jan 10
- Price jumped NEARLY 20% from start of US warnings to Friday
- Moving up 5% in one 4 hour candle on Friday Feb 25
This stock has still not reached last ATH and has the potential to continue going up depending on the duration of the conflict.
On Monday, we are likely to see a small dip before the price continues moving upward.

Geopolitical risk -> Military engineering: Lockheed MartinLockheed Martin is organized around four core business areas.. Aeronautics, missiles and fire control, rotary / mission systems, and space.
With geopolitical volatility firing up, this stock should continue to do well and potentially break out here.
On a longer term scale (3 month candles) we're already seeing capital flight into the stock this quarter as it's working on a quarterly break out:
This is a slow mover and won't trade like others if there's a rebound in equities. But a conservative name to own with high probability/low volatility.

LMT : A retail trap Hey friends, hope your having a good day. LMT has been gaining alot of attention mainly from retail traders. There are 2 possible scenarios. Bearish because It's currently at a major structure of resistance, retailers are aping into the stock and macd looks bearish. And theres bullish because it has formed a double bottom. Im leaning more towards to the bearish scenario myself I personally would stay away from this stock.
Have a good day ;)

nice break past top trendline! lmt broke above the extreme trend resistance, now its only being held back by local resistance areas.
in my opinion it looks like its just doing a small consolidation before the next push to the upside. my targets are 396.05-431.96-467.88
like and follow for more! 💘

2/13/22 LMTLockheed Martin Corporation ( NYSE:LMT )
Sector: Electronic Technology (Aerospace & Defense)
Market Capitalization: 107.893B
Current Price: $396.19
Breakout price: $396.00 (hold above)
Buy Zone (Top/Bottom Range): $384.80-$369.85
Price Target: $416.00-$420.00 (1st), $434.00-$442.00 (2nd)
Estimated Duration to Target: 103-110d (1st), 211-221d (2nd)
Contract of Interest: $LMT 6/17/22 400c, $LMT 9/16/22 400c
Trade price as of publish date: $19.40/contract, $25.30/contract

War tensions arise, LMT also risesI have been eyeing this setup for a bit now. Double bottom on the weekly as a nice volume base has formed. Can see 440 on the breakout above 400.


After Earnings UpdateThis is going per the plan shared before. I am going to wait our the Wave 1 and 2 to complete before taking a long position. Tracking it closely.

Buy $LMT - NRPicks 05 NovLockheed Martin Corporation, a security and aerospace company, is engaged in the research, design, development, manufacture, integration and support of technology systems, products and services worldwide.
Revenue TTM 66B
Net Income TTM 6B
EBITDA TTM 8.7B
EBITDA margin TTM 13.5%
Debt/EBITDA TTM 1.3x
P/S 1.39

approaching resistance, longs should trade with caution here ↘︎LMT may look bullish on the 4hr or daily but its approaching extreme trend/RSI resistance on the weekly time frame.
We most likely see another rejection and move to 351.89-335.90 in the near future.
like and follow for more 💘
