MCD breaking out of descending wedgeMcDonalds is breaking out of a downward wedge after re-testing prior support
4MCD trade ideas

$MCD Breakout!Looks like MCD is finally breaking this falling wedge pattern that we've been looking at for months now, a break over $216 will be needed to confirm the move. Targets for options are as shown, and the target for our equity position will be at $245 based on longer term Fib levels.


MCD 227 PT ( short to medium term)Definitely can go higher 240-250, but here is my short term price target for the next few weeks.

MCD Long Uptrend, EMA55/144 as support Zone
Wedge
Rally after 1/29 Earning.
Entry 212
Stop 200
Target 230
I am not a PRO trader. I trade option to test my trading plan with small cost.
The max Risk of each plan is less than 1% of my account.
If you like this idea, please use SIM/Demo account to try it.


New trading Strategy upgrade -i guys, this is my idea only. Please message me privately if you would like to see for my trading strategy e.g. how to use EMA , Price Auction and MACD strategies etc.. I would give my ideas on 10 different items each week here. My main trading strategies are on trend and swing trading and my positions are on H4 and day chart only. I don't do intraday trading in M1-M5 chart as it is very headache to keep my eyes on the screen all the time with little profits. We open and hold positions for at least 1-3 weeks for a target of at least 20% profits on each trading. If you consider one of my analysis is useful for your trading or to follow, please consider donate @ paypal.me/qguoshane , a screenshot (same day) on my real trading accounts or an invest account on MT4 may be given for each donation. Good luck!


McD MT Idea (January 28th 2021)McDonald's (McD) (January 28th 2021 through July 2021)
Low: $182-$201
High: $224-$252
I'd imagine analysts may be very close with 2020 Q4 earnings estimates but I cannot personally gauge whether or not it will out or under-perform. I'd imagine a positive guidance report is in order but if EPS under-performs it may only be by slightly. ($1.77 expected median, I think $1.60-$1.87 sounds reasonable to me.) Could be a couple more quarters before the stock gets another great breakout but we'll just have to watch. I was originally thinking that the earnings could help prop price up but looks like price action is getting torn down a little and if negative news of under performance comes in it could help drive price closer to $200.
Related ideas attached below:
Thanks for tuning in :) Disclaimer, anyone in the trade needs to do their own due diligence and decide what is right for YOU. My charts can be wrong at any time and it's very important that you have your own strategies and plans in place. I run this channel for my own educational purposes of learning to trade, and I will never be 100% right, so please do not let me confirm any bias for you! (Dangerous to do so, stay safe and remember the basics & rules of risk assessment.) Expect the unexpected and happy trading!


Here is why buying McDonalds is a good idea.A lower degree abc is completed which is the B wave of a higher degree ABC. After the completion of the ABC corrective structure we expect the next impulse up. I will keep updating this chart if necessary. Comment, like follow for more accurate ideas. Thank you.

$MCD $MCD possible 5 Waves structure to early to tell as the price action is very choppy but if correct seems to be a nice long to the upside!

Mc Donalds Short-Term AnalysisConsidering it is my first Trading View post, I'd like to start by saying that I'm an experienced (5+ years) Options Trader purely based on Technical Analysis. I'll give my analysis on the price movement of a stock followed by a trade alert. Now as this is fairly for educational purposes, if you do decide to take a trade, it is your responsibility to manage your risk. If you do incur any losses, that is your responsibility too. (Not every trade is a winning trade and it is best to manage risk in order to reduce your losses and burn out your capital. Quite a common occurrence among options traders).
Now when I say short-term, I usually look at the 3-5 week price action. Considering MCD 's current price action, it is safe to say that we are trading well in this triangle pattern as you can see on the chart. Now, Friday validated that pattern, finding support at the $207 level.
On Tuesday, when the market resumes for a shorter trading week, we are going to look closely at the price action hoping to see the triangle intact, which if breaks, next support would be at the $206 level (Set your stop losses a little under this level).
Considering trend lines in the near past term, I see the stock riding up towards the $213-$214 mark. This could happen within the next 2 weeks. (Keep in mind, earnings are on Jan 28th, 2021). We could see a pre-earnings run up higher and probably a breakout back to the $220 levels.
As far as the indicators, the CCI is approaching a buy signal, however validation from the MACD is still to be confirmed.
The trade :
BTO Jun 18 2021 $220 Call
As I said, if the stocks goes below $206, you take the loss and move on, as it is very likely that if it breaks it will retest the 200 MA.
Now the expiry is 5 months out and you can choose to hold it into earnings or buy after, that is your choice. Or buy before and bank on any move prior.
Good luck trading!

MCD falling wedgeGood loading zone with stop loss, or watch for wedge breakout. March/April $220 calls.

MCD 1H COUNT - BEARISH SCENARIOBearish count for MCD on 1H candles. Look for a break of the support here on the triangle, if we break past the low created with wave D then I will enter a short position, if we find support here and break above the resistance at the top of the triangle then the bullish scenario is in play and i will enter a long. Make sure to check the bullish scenario as well as the bearish and wait for confirmation.
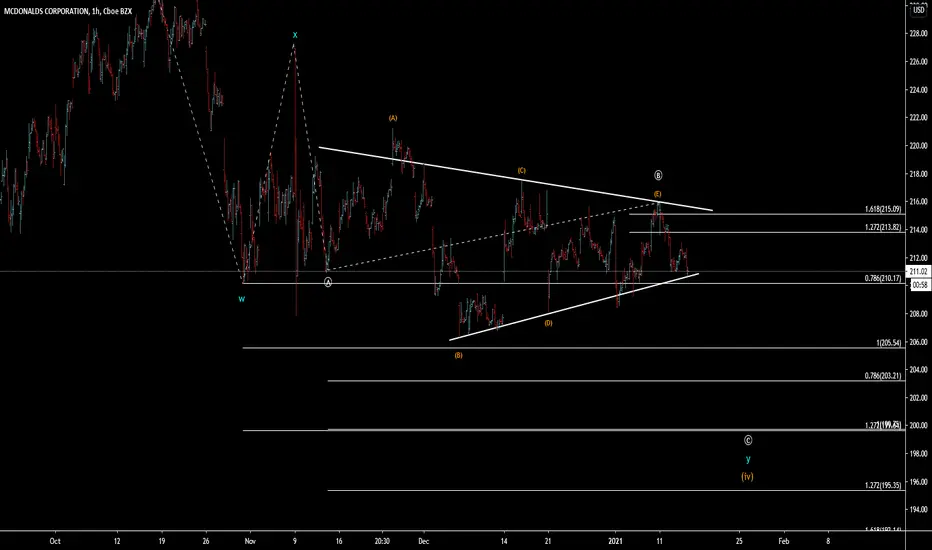
MCD 1H COUNT - BULLISH SCENARIOBullish count for MCD on 1H candles. Looks like it could be done with a triangle wave Y. Make sure to check the bearish scenario before entering. Wait for confirmation of support here on the triangle and a break above the resistance.

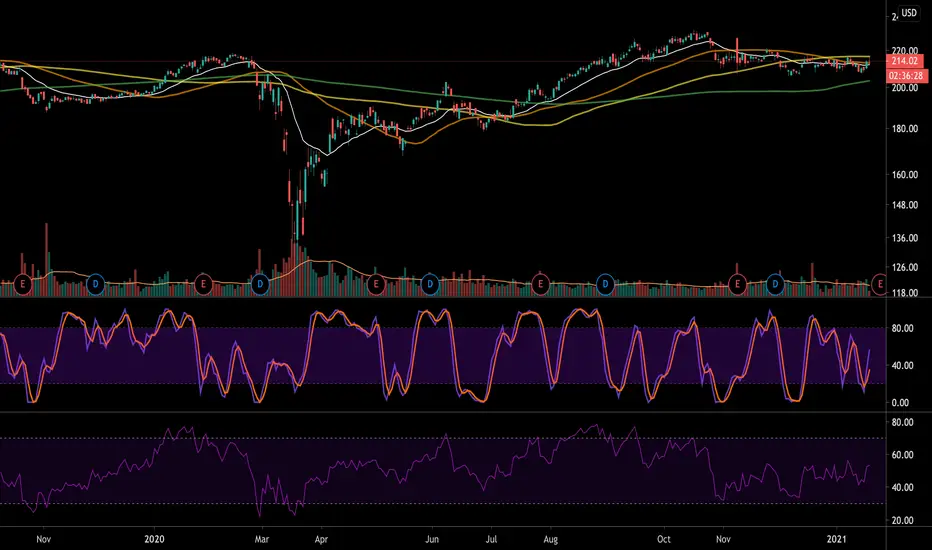
V Bottom/Rising WedgeAnd is forming a handle. I should say support but looks like a handle low and the handle appears to be in a rectangle.
I just started playing with the volume profile thingy. This one caught my interest after looking at several stocks using this indicator..I may use it when unsure from now on..just take a peek at it and see where volume is.
This stock was punished severely after breaking the bottom trendline of the bearish rising and narrowing wedge it traveled in for quite sometime.
MCD broke bottom trendline of the rising wedge ..it appears to be recovering/average fall for a stronger stock is 35%/some merely pierce the bottom trendline of the RW and move forward. Some never break down from the RW pattern and some actually break up from it/IE CRM..but the break up is usually not a healthy one and does not hold long term.
And RWs can be very long term patterns.
RWs are usually bearish and usually have a lack of sufficient pull backs causing an inbalance in supply and demand. Rising wedges are formed due to irrational exuberance and can cause havoc when bottom trendline is broken..or price may make a quick drop out and resume it's uptrend. Or it may not drop out (This does not happen often from what I have seen)
I have noticed a lot of RWs since the mkt caught the flu.
I have also noticed a stock in a RW may beat earnings , yet go down anyway. This is one I would consider, am watching, to buy before long entry level and closer to the support of the handle low. That is a No NO, this I know..lol..but I do not think McDonalds is going anywhere so I may break one of my trading rules. I may be sorry. Ti,e will tell and I have not done it yet! LOL
MCD is also trading in a small Gartley which puts D at 206ish..but has been to D, and did not go below this time around. D held
Little green triangles are pivot lows..
NV and OBV are high
Just an observation

MCD Going long with a nice h&sInverse head and shoulders pattern forming on the weekly for MCD, Looking to buy shares today on this dip. Next target $230. but it can get to $250.


MCD possible longMcDonald's ran 86% from March lows and has been down-trending since early October forming a nice base in the 205-220 price range. We broke the downtrend on Friday with a slightly below-average volume. I would like to see a break of the 217.56 area along with a successful retest before taking a long position. I drew two possible long scenarios I see playing out, would like to see more volume come in as well. This looks to be your standard continuation pattern fueling our next leg up. Risk/reward is great with strong support in the 209-212 range, best of luck trading!
