MMM Trading RangeMMM has traded in this channel 87.5% of the time. Objective long opportunity after this latest bounce.
4MMM trade ideas


Interesting Level On MMM For Long Term Investors3M is currently consolidating at a long term trend line/long term moving average (100 Monthly SMA)/ and a yearly pivot level. With 3M offering an attractive dividend yield and being at an attractive level it may be a good fit for some long term investors portfolio.

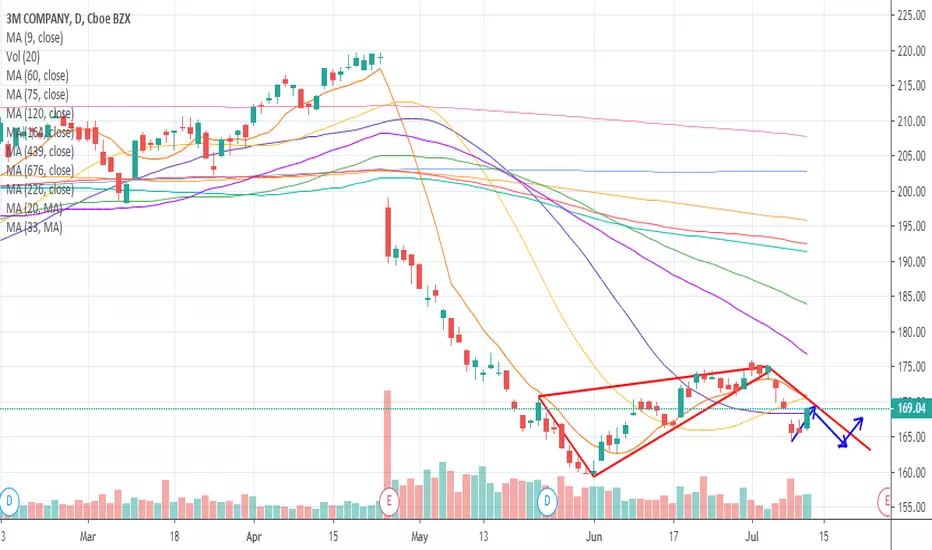
MMM Bottoming Attempt FailsMMM continues to show weakness in the attempt to bottom. Currently, the trend is at risk of continuing to move downward. The stock has failed to break through weak resistance in recent runs upward.

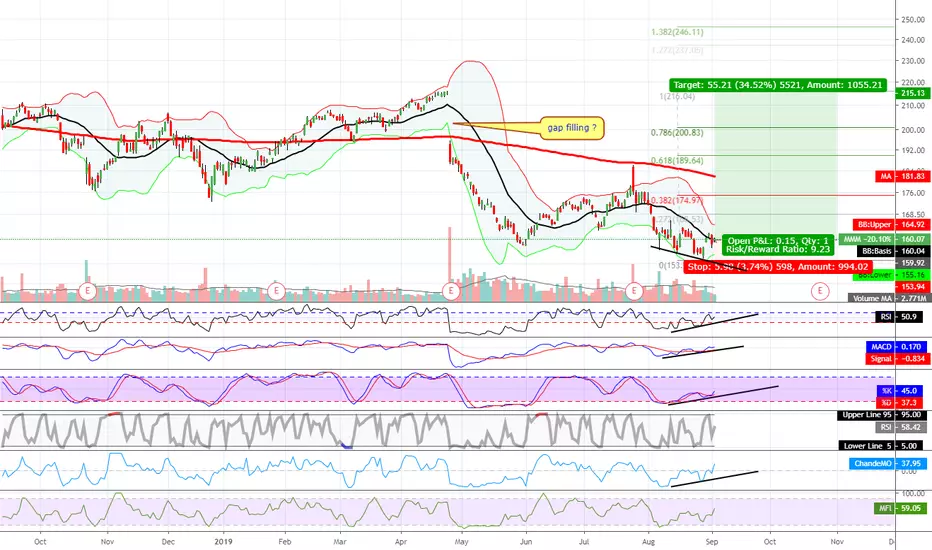
MMMWill 3M go all the way to fill the gaps.
Targets - follow the FIB-lines and if price action has past above this will be new support area.
More Dark Day Ahead for 3MShort since on the top and short more now at 161.45 STP167.80, Aiming at 145.xx


MMM double bottom/morning star reversal swing tradeI like the double bottom bounce off support as well as a morning star reversal pattern set up. I'm looking to buy a pullback anticipating a move higher. Just a thought. Could work, I know my risk and if it doesn't work, it will be a small loss with a pat on the back for a good try.

3M Sell IdeaW1- Double wave down, price broke below the 61.8 level, until this breakout holds, we may expect the price to move lower towards the next critical area.
D1 - Bearish divergence, price broke below the bearish flag.
H4 - Price has currently broken below the last low, we may now start looking for sells with more bearish evidences.

3M Sell IdeaD1 - Price has reached the top of the bearish flag, bearish divergence.
H4 - Bearish divergence.
H1 - Price has reached the critical zone formed by the top of the daily bearish flag pattern and the the fibo levels of the cycles. Bearish divergence.
Until this critical zone holds, we may look for more evidences of bearish pressure in order to join the bears.
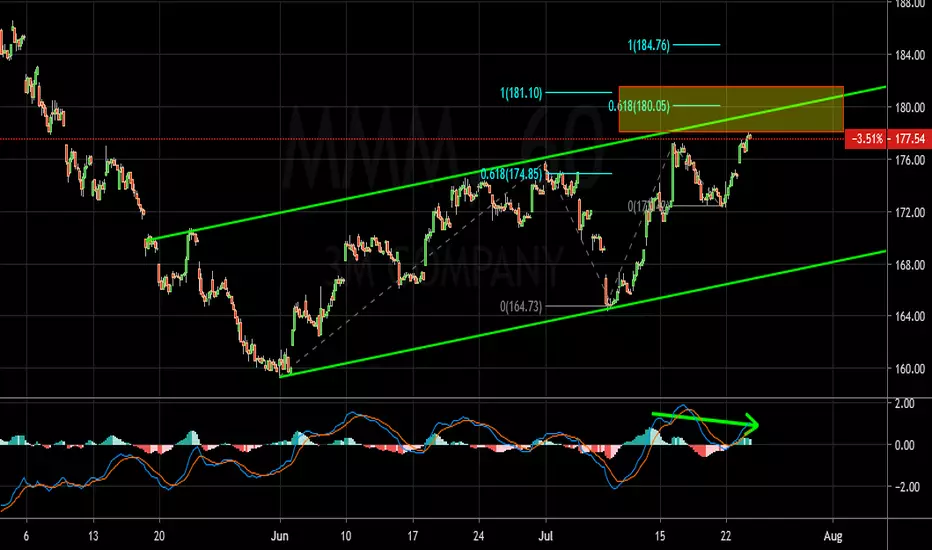
MMM breakout to 182 or bearflag?if you are bearish, you can do a calender spread, buy a put after ER date, and sell a put before ER date.

3M Target 181.25 before September 20193M has been down since high of 260, with PE Ratio (TTM) of 18.29, and Forward Dividend & Yield of 5.76 (3.31%), it is certainly undervalued.

Daily MMM stock price trend forecast analysis11-JUL
Price trend forecast timing analysis based on pretiming algorithm of Supply-Demand(S&D) strength.
Investing position: In Falling section of high risk & low profit
S&D strength Trend: In the midst of a rebounding trend of upward direction box pattern price flow marked by limited falls and upward fluctuations.
Today's S&D strength Flow: Supply-Demand strength had a strong buying flow than a flow in falling section.
read more: www.pretiming.com
Forecast D+1 Candlestick Color : RED Candlestick
%D+1 Range forecast: 0.8% (HIGH) ~ 0.1% (LOW), 0.4% (CLOSE)
%AVG in case of rising: 1.1% (HIGH) ~ -0.6% (LOW), 0.6% (CLOSE)
%AVG in case of falling: -0.1% (HIGH) ~ -1.6% (LOW), -1.2% (CLOSE)
MMM Starts BottomMMM had a massive High Frequency Trader gap down in April, but has now found support at a previous low from 2016 that is a fundamental support level. Massive Smaller Funds Volume Weighted Average Price selling occurred after the gap down. The bottom has shifted the trend to the upside.


MMM analysisMMM have support line at 160$ and there is PRZ of Gartley pattern.
Also divergence have been made.
i think $160 is bottom and it starts new uptrend.

3.4% Dividend yield doesn't stop the bleeding in 3M3M just can not catch a break, it seems that everything is working against it, the trade war, the strong dollar, economic slowdown concerns, and industrial spending have all attributed to the disastrous stock performance in 2019. Until these issues change and in particular the China trade issue, they stock will continue to tumble.

3M inverse head and shouldersPotential to take a long to retest the broken weekly trend line before another fall.

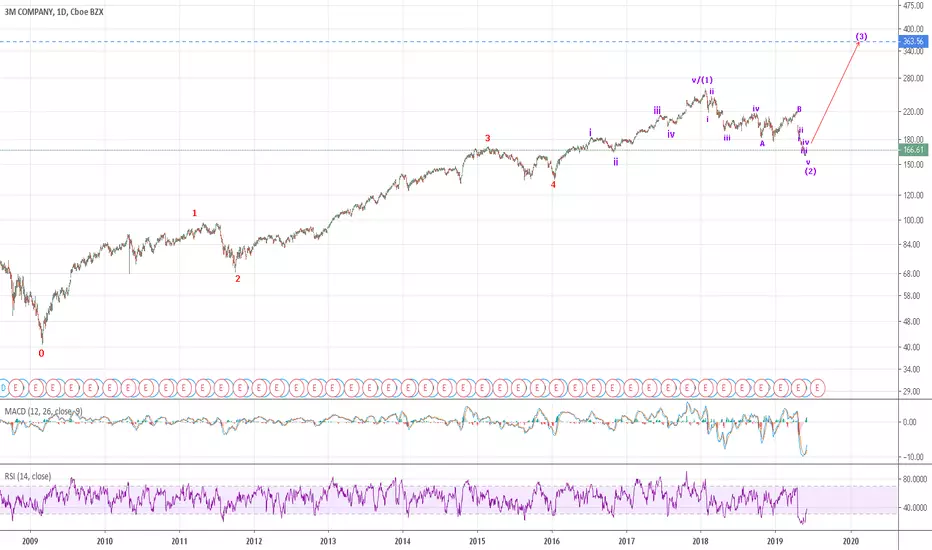
MMM: Starting out on sub (3) of an extended 5Pivot points, BB, RSI, and MACD support a reversal. Sub (2) of an extended 5 looks finished with a retracement of 76.4. See Detailed chart in comment section.
MMM Begins Extreme Low TestMMM is at a previous yearly low. It rebounded with a gap, an early sign of a potential bottom. Traders who sell short should consider this a higher-risk trade at this time.

