4MU trade ideas


<TradeVSA> Micron (MU.Nasdaq) - Confirmation on Re-accumulation1. Continuation on Uptrend
- Healthy uptrend with no climatic volume
2. Re-accumulation
- No major weakness at resistance
- High volume breaking above resistance
Disclaimer: This information only serves as reference information and does not constitute a buy or sell call. Conduct your own research and assessment before deciding to buy or sell any stock.

MU is flying to high - Short itRising too fast means it will have to come back down and touch the main trend line, short position at this stage to $60


MU Bubble MeterStill hasn't hit ATH from the DOt Com bubble, when MU hits $100 next year, then the bubble is complete.
Just more evidence that the bubble isn't over. Seems kinda crazy.... but I think TSLA might actually hit $1000


MU - Micron - $69.75 Entry / Bottom of Channel / $80 Target0. MU Bottom of Channel;
1. $5 Height of Channel. Descending Triangle.
2. Should move to top of Channel and Breakout to $80;
3. Throw back from bottom of channel was the entry;
- drchelsea


$MU making Head & Shoulders Pattern?Good day!
Been watching MU for a couple of weeks, hasn't been a fun trade lately. After some more detailed TA it appears MU could be completing a Head and Shoulders pattern
Decreasing Volume as what appears to be a Left Shoulder & Head forming help suggest the patterns completion.
Set a few Entry and Exit targets to play the Right Shoulder formation, should it continue to play out. Could Simplify it by going Long and setting tight Stops
please like & subscribe and share your thoughts or critiques!
Happy Trading!


MU Calls?This one is tough to chart due to it being very extended. My best guess on this one would be a break above 71.51 to further extend its ATH. It rejects, use 69.90 as a support, breaks below that, we could see 67.04

MUBased on my analysis:
1. MU has been on the 5th wave in the 'impulsive wave'.
2. Stochastic shows MU in overbought.
3. The purchase volume indicates that it has decreased.
4. It is possible for MU to make a correction to reach 76.60 USD or make a price reversal.
Syeikh Hafiz
Stock Market Analyst

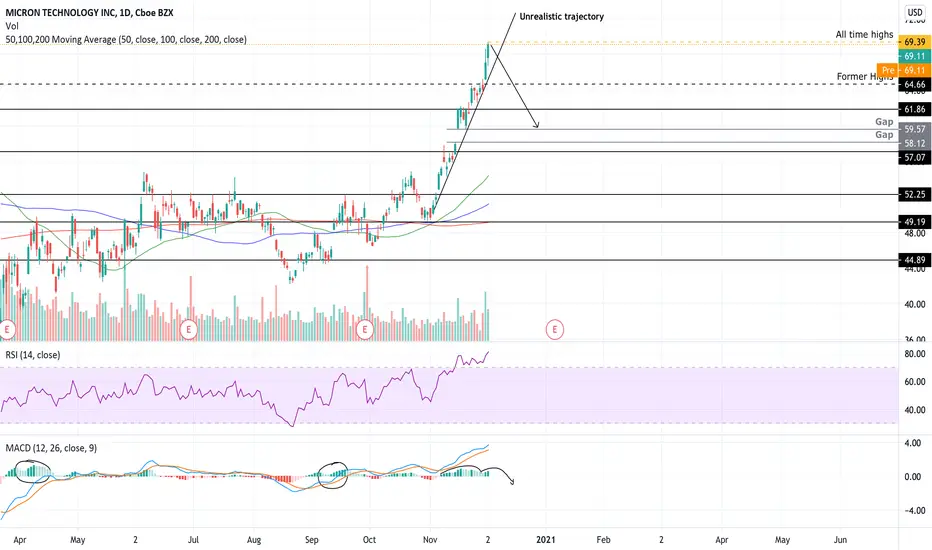
MU ShortAfter a golden cross with the 50 and 200 SMA NASDAQ:MU has pushed up into overbought conditions on the RSI leaving quite a mess as it stretches. Now at all time highs, I believe that it is a good time for a short. With lots of buying pressure in the last couple of days some consolidation is expected. Semi-conductors have been a strong play during 2020, however with a strong bid for Energy yesterday, I believe it is time for past due rotation for the continuation of the unprecedented bull market that has been carried heavily by tech centric stocks. The MAC-D is attempting to double extend to the upside for the first time since September and March lows, and with the overbought conditions it is safe to say that this move will likely be quickly rejected. My first target for MU is support at 61.68 and my second target is the gap up from 58.12 to 59.57. Note that the former highs are at 64.66 and this might serve as a testy area for MU.

MU consolidate or make a push higherMicron had nice run to make new all time highs. Its forming a bull flag above the early 2020 highs. Expect this to consolidate at the current level and make a push higher

Bullish Flag on MU?It looks to me like there is a Bullish flag on NASDAQ:MU right now with the possibility of a $10 increase, also the ATR is looking very low which could mean a large shift in stock price soon.
Note: The $10 increase in value was derived from the last bullish flag pole
Last Edit: I'm new to this and I forgot to exclude the charts below the top one, please ignore them
WARNING: I am not a stock expert and am just learning technicals and chart patterns, if you like this idea and would like to replicate it please use fake money to test out this strategy.

