4NEE trade ideas

Cup and Handle ABC BullishPossible Stop under C..
ABC bullish patterns are a correction pattern and the target is D..D is not here yet though (o:
Targets are calculated using the AB leg of the pattern..
In a bullish market and a bullish stock, targets can extend to 100%, 127% 161% of the AB leg..
Previous cup and handle and so far the handle low (HL) has held as support
Not a recommendation

NEE wait to go long at $72over 10% pullback from failed breakout could take it below oct&Nov low around $72.5. wait to enter long via LEAP OTM call if price goes below $72.5


Nextera Energy. Open after correction.Monthly
Upternd
Weekly
uptrend
Daily
False breadkout in uptrend.
I will wait for lower price.
Open 73,5
SL 67,5
TP1 80 RR 1.2
TP2 85 RR 2.22


Cup and HandleNee split x 4
Seems stock dive a bit after a split.
Support at HL and at gap below price
Looks like tis one may range for abit..but who knows.
Not a recommendation


NEE Uptrend on NEE. Good entry point? Earnings to be released inbetween.. in case of reporting above expectation, trend capable of breaking resistance.

Nee Split Cup & HandleThere was a rising wedge on the chart before NEE split.
TOS is just showing a huge drop and has not adjusted chart to new price so difficult to chart today.
I imagine the rising wedge went with it though
Strong stock
I have found that it is often a good idea for me to wait a few days after a stock split
Seems they go down a bit after the split sometimes. Maybe due to more shares being available. I do not know for sure
Can be volatile
OBV and NV are both high
I wilol post again when TOS updates NEE to new prices
Not a recommendation
Just an observation

Cup and Handle Rising WedgeNEE pulled back from first rising wedge, then recovered to finds itself in another rising wedge. This one is very small and NEE is riding the bottom trendline of the RW
The Rising Wedge is a bearish pattern that begins wide at the bottom and contracts as prices move higher and the trading range narrows. In contrast to symmetrical triangles, which have no definitive slope and no bullish or bearish bias, rising wedges definitely slope up and have a bearish bias.
The upper resistance line and lower support line converge as the pattern matures. The advances from the reaction lows (lower support line) become shorter and shorter, which makes the rallies unconvincing. This creates an upper resistance line that fails to keep pace with the slope of the lower support line and indicates a supply overhang as prices increase.
Basically a RW is formed when there is too much buying without proper pull backs (Irrational exuberance) and the supply and demand gets out of whack. When the time comes, there are not enough buyers left. A RW takes at least 3 weeks to form but can be a very long term pattern. It is only valid if price breaks lower trendline of the RW. A strong stock does not fall far as a rule, but the average is 35%. On the other hand, a stock can fall quite a ways, example, HRC (see my chart on HRC)
Beware of Gap under price at 291ish...but may be a good entry
A momentum name and can be volatile
Possible stop under handle low
NV is very high
Short interest increased today
Not a recommendation

Watch Climate Change Get Solved In One ChartThis is a ratio instrument that tracks the price of NEE shares in terms of XOM shares. NEE is a utility company making strides in installing renewable power into its energy mix. XOM is one of the oldest and biggest dirty oil and gas players. As you can see, the global rivers of capital allocating resources and assigning valuations have, within the last two years, begun to assign massive premiums to renewable players in anticipation of a green-ification of our power grid. While this move honestly took a bit longer than I would have anticipated - Solar became the cheapest power source in the world in terms of $/watt in early 2016 when FSLR created its breakthrough telluride panel - it has nonetheless played out.
As it turns out, buying this spread at that price, in early 2016, would have netted you a cool 600% with no overall market exposure.
I think this chart is great for two reasons:
1.) It shows that capitalism is still alive and kicking, able to solve some of the world's biggest problems through consensual transactionmaking
and
2.) It provides a great template for trading some of these macrotrend ideas at work in the present time. Boomers getting older - long a healthcare spread. Wealth transference - short a wealth management spread (as more and more millennials want more transparency and lower fees when it comes to investing). etc etc. Discern the best trends you see happening around you, determine who the winners and losers are likely to be, and place a hedged trade like so. Some, like this, just work better than others :)

NEE 310 Calls November.WOW I typed this whole long thing that was deleted.
Short and Sweet
NEE earnings tomorrow going to blow out
Largest producer of renewable energy
Stock split on the way
Momentum
Look at 5 Year Chart, Mike Drop Nuff Said lol
GLTA no brainer here
I AM NOT A FINANCIAL ADVISOR. This IS NOT Financial Advise.
This is for entertainment purposes only
NEE struggling after making new highAt the beginning of the week in our Flight Path newsletter, we took a look at the Utilities sector and we saw how on a relative trend basis, utilities had started to outperform.
NEE, the largest company by market cap in the sector, had broken out of the range it had been trading in and was on its way to a new high. We can see this on the daily chart to the left.
We suggested going to a lower time frame to look for a GoNoGo entry signal for a better price if you wanted to get long.
On the hourly chart to the right, we can see that we never got the green re-entry circle that we were looking for and price was near the high that it put in. In fact, at the last bar of Monday the 12th, we saw a short term counter trend red correction arrow that warned of a pause in the “Go” trend. Along with that, the GoNoGo Oscillator crashed through the zero line and after a few amber bars of indecision, the trend has changed to a “NoGo”. We can see that this lines up with the neckline of what could loosely be described as a head and shoulders pattern and so we now can expect price to fall to support at the highs of the previous range.

wait for 312 to breakunless this has some good news + great volume it will most likely find resistance at this long term trendline. gl :) thanks for the request!

Easy MONEY HERE NEE Longnuff said split and earning coming largest solar energy producer in the country great management. They have so much work they subcontract it to other people, and literally are making money when someone services there work lol

NEE: Structure Break Out - TCTStructure Break Out - TCT
TP1 = 285.66 expected increase 2.05%
TP2 = 288.88 expected increase 3.21%
TP3 = 293.57 expected increase 4.92%
Please don't forget to FOLLOW, LIKE, and COMMENT...
If you like my analysis:)
Thank you and Good Luck!

forward split coming, playing with resistance, possible upside forward split coming, playing with resistance, possible upside

NEESystem T Performances: Annual Compound Profit 40%, Win Rate 55%, Risk/Reward Ratio 1:2, 20 Years of Backtesting Data, Over 100 Markets.
* Click Like and Follow to Support My Work!
---
Hi Traders,
I'd like to introduce the System T, a computerized trading system that analyzed and backtested the 20 years history data of over 100 markets.
This post is my sharing of how I think about systematic trading and the signals generated by the System T.
(This is my opinion only, NOT the financial advice.)
The System T is a comprehensive system which contains many components such as buy & sell signal generator, win & loss statistics, risk control & portfolio management to make sure trading is successful in the long run.
Basically, for the system to open a trade and manage risk, it only needs a buy signal & a stop-loss signal clearly on the chart.
Once the system finds a good trend, it will ride it as long as possible. The stop-loss will be adjusted accordingly to the new price movement.
(*) Remember to follow this trade idea and follow my profile to get updates about the stop-loss adjustment and sell signal based on the latest price and market conditions daily.
System T performances above will give you an idea of how it performs in the last 20 years.
Notice that this result was achieved only if I strictly followed the rule: "Only and Always Buy & Sell based on the System Signals".
Don't sell when there is no sell signal as we all want to follow the good trends til the end like everything in life does. \(^-^)/
Also, my system is extremely diversified through over 100 markets so that it only risks less than -1% of the total capital per trade.
Thank you and good luck!
---
DISCLAIMER:
I am NOT a financial advisor, and nothing I say is meant to be a recommendation to buy or sell any financial instrument.
My views are general in nature and I am not giving financial advice. You should not take my opinion as financial advice. This is my opinion only.
Do your own due diligence, and take 100% responsibility for your financial decisions.
Trading and investing are risky! Don't invest money you can't afford to lose, because many traders and investors lose money. There are no guarantees or certainties in trading.
- Content is for education purposes only, not investment advice.
- Trading involves a high degree of risk.
- We’re not investment or trading advisers.
- Nothing we say is a recommendation to buy or sell anything.
- There are no guarantees or certainties in trading.
- Many traders lose money. Don’t trade with money you can’t afford to lose.

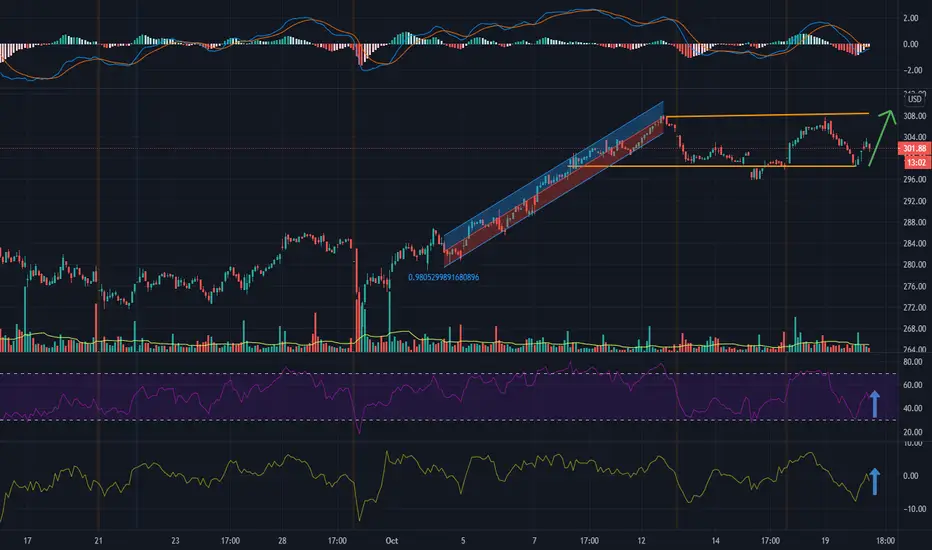
NEE LONG w/ fib ext. showing almost breaking resistance levelStrong bullish run. Fib extension shows resistance/support levels. Right at $281 resistance level. if breaks through, this will likely see a bull run up to $350!
