NFLX: Buy ideaOn NFLX we would have a probability of having a continuity of the upward trend if all the analysis conditions are respected as you can see on the graph.
4NFLX trade ideas

Netflix - We Know What Will Happen Next!Netflix ( NASDAQ:NFLX ) will retest the trendline next:
Click chart above to see the detailed analysis👆🏻
About six years ago, Netflix started the creating of a reverse triangle pattern, perfectly trading between the two trendlines. We already witnessed such a behaviour back in 2012 and following this previous bullish cycle, it is super likely that Netflix will head even higher.
Levels to watch: $1.200
Keep your long term vision,
Philip (BasicTrading)

NFLX - LONG Like the theme , took a long , later in its move after GLB , my goal is to chase stuff at the GLB but it's acting well and they are taking my money through subscription costs , a year ago I paid 9.99 and somehow now I'm 24$ . Annoying , yes , but we for the most part just pay away . And thus goes the theme
2nd big gap since GLB and has had quite a few in stage 2 , mostly unfilled, could be a bit extended here and " too high " but I think its a good bet still . And growth still good .
I like it .
Extended from GLB ,
Lots of history of successful gaps that remain unfilled ....
Trading above successful open GLB
1/2 gaps prior to GLB
2/2 gaps after
clean price action for most part ...
NFLX - Fundamentals and simply a great company to invest in!Hi guys, next we would be looking into NFLX , which has had a tremendeous year already! It is up 480.28$ YTD as of today 26th December , which accumulates to 103.99% upside of their stock value. Currently they have shown fantastic financial data throughought Q1,Q2,Q3 not only that they showed a good growth towards their subscribers, and last but not least they just started their NFL Program which launched recently which definitely would boost their revenue.
Additionally they signed a very important contract that goes as follows :
Contract:
Deal with Fifa, soccer’s global governing body, covers the 2027 and 2031 editions of the Women’s World Cup
Agreement covers Puerto Rico and includes both English and Spanish-language broadcasts
Netflix will produce an exclusive documentary series in the lead-up to both tournaments
Streaming platform’s coverage will also feature studio shows
So the stars are alligning for this company and I am deffinetely looking for the break through to the levels above 1,000$ per share.
Entry: on market open - 935$
Target: 1,150$
As always my friends happy trading!
P.S. If you have questions or inquiries about one of my existing set-ups or personal questions / 1 on 1 sessions consider joining my channel so you can follow up with me in private!

NFLX: AnalysisOn NFLX we are in an upward trend with the breakout of the Vwap indicator. This trend could continue if we have a strong break of the resistance line.
Furthermore, in the event of a reversal of the trend we would have the breakout of the vwap as well as the support line by the sellers....

NFLX - +9.70% upside with 1:3 RR Nice continuation wedge pattern here.
Break out imminent and high RR play.

Netflix - end of the road after +600% at 1000$ ?We all remember the massive sell-off of NFLX in 2022, it crashed from 700$ to 166$.
Everyone who bought at the time has gained 600% profit as price reached 1000$ after the last earnings.
The question is now could and should you ask for more ?
From an Elliott Wave perspective 5 waves up could be completed and NDX is at least consolidating, maybe even setting up a move to the downside.
I'd take my profits in NFLX and walk away.

Post Earnings Consolidation NFLX After the last earnings report on NASDAQ:NFLX the stock saw an extremely tight consolidation for about 2 week which was followed by a large rally. We may be seeing something similar form again after there most recent earnings report.

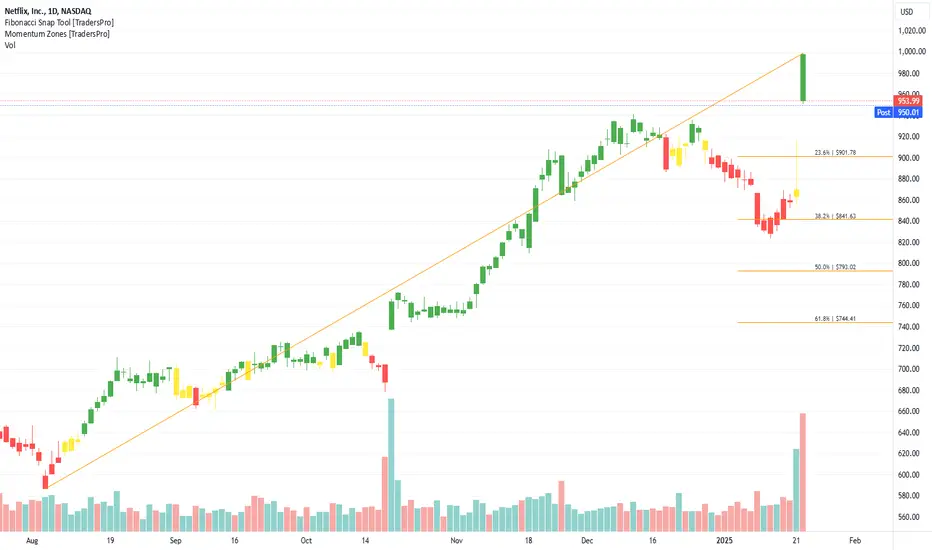
Netflix potential bullish opportunityAs I am writing this, Netflix is sitting at 978.15$.
From my analysis I predict a possible move to 1,080-1,100. This depends on two things.
1. Can we stay above 925-950? This range is the most recent high we have broken. If we drop below this the next target is 880$ which is around where we broke out from.
2. Do we have enough steam to break out above the 1,000$ range. Right now the volume is dwindling, which could be a build up of shorts in either direction. I imagine a lot of retail has entered into this after the breakout and have super tight stops. This could fuel us if we break up higher than 995 or sink us if we drop below 925.
The 1 hour moving average has not shown any divergence which tells me that this trend is still continuing.
We will see what happens as the time goes on.

Netflix Surges Following Stellar Earnings: Time to Buy or Wait.?Video streaming powerhouse Netflix (NASDAQ: NFLX) recently delivered outstanding fourth-quarter results, significantly bolstered by robust subscriber growth. This surge in subscribers is a clear indication of Netflix's ability to navigate and thrive in the increasingly competitive streaming landscape, where numerous platforms vie for viewer attention. In response to the impressive earnings report, Netflix's stock experienced a notable increase of approximately 10%, propelling it to a new all-time high and reflecting strong investor confidence.
Currently, the stock is displaying a symmetrical triangle pattern on the 4-hour chart, a technical indicator often associated with periods of consolidation before a breakout. Given market dynamics, a retest of previous resistance levels is anticipated, which could lead to a decline in price as it fills the gap. Consequently, this presents a potential buying opportunity, with the ideal entry point estimated at around $940. This strategic level may offer investors a favorable position to capitalize on future price movements.

NFLX: Breakout Confirmed – $1,000 Incoming?🔥 LucanInvestor's Strategy:
🩸 Short: Below $950, targeting $920. A breakdown could signal a correction.
🩸 Long: Above $980, targeting $1,020. A breakout would confirm bullish strength.
🔥 LucanInvestor's Commands:
🩸 Resistance: $980 — Key breakout level for a push toward four-digit territory.
🩸 Support: $920 — A retracement here could provide another buying opportunity.
Netflix remains strong after a significant breakout, riding EMA 9 as support. MACD is bullish but nearing overbought levels—momentum must hold.
👑 "The strongest thrive in the storm—hesitation is your enemy."

NFLX Netflix Options Ahead of EarningsIf you haven’t entered NFLX in the buy zone:
Now analyzing the options chain and the chart patterns of NFLX Netflix prior to the earnings report this week,
I would consider purchasing the 850usd strike price Calls with
an expiration date of 2025-1-24,
for a premium of approximately $41.75.
If these options prove to be profitable prior to the earnings release, I would sell at least half of them.

Sell, Hold, or Hope? Netflix Approaches $1000Hi,
Looking at Netflix's historical price behavior around psychological round numbers ($100, $500), we see a pattern that indicates it might be a good idea to lock in some profits at these levels.
Why?
- Round numbers often act as psychological barriers where prices tend to consolidate or range for a while, limiting further growth.
- There's a significant chance of a correction, especially after a strong rally like the one we've seen recently.
Both of these scenarios suggest it's worth considering taking some money off the table. One thing is for sure: please avoid letting FOMO influence your decisions at these prices - don't buy it at the moment. There will be better changes, just be patient enough!
Historical Examples of Psychological Round Numbers
$100 Level (2015-2016)
In July 2015, Netflix approached the $100 level. While it did show some upward movement, the price largely ranged around this area until late 2016. It was stuck for months, offering limited returns for those who didn't react.
$500 Level (2021-2022)
Around $500, Netflix once again demonstrated the same behavior. For about a year, the stock did little more than range around this level. This shows how powerful round numbers can be as areas of stagnation.
Current Major Level: $1000
While Netflix has surpassed previous round numbers, $1000 is shaping up to be the most significant psychological level yet. The rise to this point has been enormous, and history suggests that sooner or later, a correction is likely.
If you're not prepared to hold through a potential correction or consolidation, the current price levels might be an ideal time to lock in profits. Long-term holders who stick to their thesis might choose to ride this out, the choice is yours. However, for mid-term investors, locking in some gains here could be a wise move!
"Sell, Hold, or Hope?"
Let's say in that way - I hope that some holders will sell around current prices! ;)
All the best,
Vaido

Netflix , multi time frame analysisHi!
Netflix , nearing a trendline resistance in the weekly and monthly tf, got a strong gap up after breaking a curved consolidation zone. in the 30 min tf
stock enjoyed the ride and support of the weekly higher angled trendline for long could continue with it, if, bypass the tls but a point of caution
posting some important levels , will give idea about MAs and MACDs structures later
hope you will like it
thanks

NFLX: I will take this weekly breakoutOh well, maybe it's not a good idea to enter after so many successful bases, but the story NFLX brought to life during last earnings is not bad at all.
I am mostly trading it as a swing trade, but with the bias that I want to be gentle with the way I raise the SL.

Netflix Eyes $1,200: Can It Break Key Levels to Soar Higher?Good morning, trading family!
Netflix (NFLX) is looking exciting right now, and here’s what I’m watching:
-If we drop below $973, we might see $950 support come into play.
-But if we break above $991, there’s potential for a rally to $1,055 and higher—with $1,200 as the ultimate goal.
Big moves could be coming, so keep these levels on your radar!
If this analysis helped you, I’d love to hear your thoughts. Drop a comment, give it a like, or share with others. Let’s trade smarter and live better!
Kris/Mindbloome Exchange
Trade What You See

Netflix Short Potential Parabolic Short situation
Blow off top into accumulation, double top, short into range lows.
lets see if it plays.

Netflix Crushes It Again as Shares Near $1,000. Where Rivals At?The smash-hit nail-biting Korean drama Squid Game, French mystery thriller Lupin or VR-infused 3 Body Problem. These are all Netflix Original titles that take us out of the ordinary and into a whirlwind of sensations and visual and emotional excess.
Only that we can have those sensations IRL thanks to the hype train called Netflix stock NFLX — the streaming pioneer schleps us on wild gyrations across the chart — sometimes super scary but sometimes unbelievably good. This time it was the latter.
“I can’t hear you over the sounds of ♫ RING-A-RING-A-RING ♫ blasting out of the speakers of more than 68 million viewers” — Netflix to its competition, probably, as it reported a bombastic quarter with a record number of subscribers.
The very-fabulous, bumper three months to December picked up 19 million paid users (how many of these were day trading while binging?) as Squid Gain Game dialed up more than 68 million views in its first week. The other big hit, Jake Paul vs Mike Tyson boxing live, whipped up 65 million streams.
It was also the perfect quarter to end the practice of reporting subscriber growth. Starting with the current three months to March, the streaming platform won’t be announcing how many new users are onboarded as it shifts the focus to traditional financial metrics like revenue growth and profits.
The shares soared as much as 15% in after-hours activity following the earnings report. They opened for regular trading on Wednesday and hit an all-time session high of $999 a piece. On the way, Netflix crossed a $400 billion valuation.
Here’s a quick rundown of the numbers for the fourth quarter:
Earnings per share: $4.27 vs. $4.20 expected
Revenue: $10.25 billion vs. $10.11 billion expected
Total paid memberships: 301.63 million vs. 290.9 million expected
It was the tech titan’s seventh consecutive quarter of rising profits, up 27% from the year-ago period. Looking ahead, Netflix plans to spend $18 billion on new content in 2025 while revenue is expected to be between $43.5 billion and $44.5 billion, up 14% from last year. Operating margin is projected to hit 29%.
Besides ads, one other thing is supposed to help Netflix get to its lofty guidance — price hikes. The streaming platform will be asking for more cash in the US, Canada, Portugal and Argentina. Here’s what’s changing in the US:
Ad-tier $6.99 > $7.99/mo.
Standard $15.49 > $17.99/mo.
Premium $22.99 > $24.99/mo.
“We’re fortunate that we don’t have distractions like managing declining linear networks and, with our focus and continued investment, we have good and improving product/market fit around the world,” the company said in its earnings report Tuesday.
“We enter 2025 with strong momentum, coming off a year with record net (subscriber) additions and having re-accelerated growth,” it added.
Where’s the competition at? Let’s look at Disney DIS , the closest rival. Disney expects to spend about $24 billion on new content in 2025, up from $23.4 billion. Yet it has about half the subscribers of Netflix — around 154 million.
Other prominent contenders in the streaming war are not even close — Apple AAPL and Amazon AMZN . Apple doesn’t disclose Apple TV+ subscribers and Amazon doesn’t disclose Prime subscribers.
Third-party estimates point to about 50 million to 75 million Apple TV+ users. Amazon Prime, which is tied to the ecommerce platform’s delivery service, has about 200 million customers.
But let’s give it to them — Apple and Amazon have got a bunch of diversified revenue streams, while Netflix has stuck to its OG mission of being a streaming platform.
In any case, this streaming war is not over, so it's worth keeping an eye on company updates and reports in the earnings calendar . (Hint: Disney earnings arrive February 5.)
Where do you think the streaming wars are headed in 2025? Share your thoughts on Netflix, Disney, and the rest in the comments!

NFLX - It's not too late!It's not too late...
You have a 60-70% chance of grabbing NASDAQ:NFLX at $920 on the retest!
Stay patient, stay ready
Not financial advice

Netflix (NFLX) Shares Surge After Earnings ReportNetflix (NFLX) Shares Surge After Earnings Report
After the close of the main trading session on the stock market on Tuesday, Netflix released its Q4 2024 results. The report was exceptionally strong:
→ Analysts expected the company to add 9.18 million paid subscribers during the quarter, but the actual figure reached 18.91 million, which is 15.9% more than in the same quarter last year.
→ Total subscribers reached 300 million.
→ Earnings per share amounted to $4.27 (expected: $4.20).
→ Gross revenue: actual = $10.25 billion, expected = $10.11 billion.
The company’s success was supported by products such as Squid Game, Bridgerton, and Nobody Wants This. During the quarter, 55% of customers chose ad-supported plans, and subscriptions to this plan grew by 30%. Netflix executive Gregory Peters believes that advertising revenue could double between 2024 and 2025.
As shown by the Netflix (NFLX) stock chart, the market has experienced increased volatility following the release of the report. On 22 January:
→ Trading opened with a wide bullish gap – approximately 14% higher than the closing price on 21 January.
→ However, during yesterday’s trading session, shares fell by approximately 4%, indicating that the initial reaction to the positive news might have been overly optimistic.
According to technical analysis of the NFLX chart, it is reasonable to assume that after a rise towards the psychological level of $1,000, the market is vulnerable to a correction. After touching the upper boundary of the ascending channel, the price could retreat to its median around the $910 level, which also corresponds to a 50% retracement of the A→B impulse.
According to TipRanks:
→ The average price target for NFLX shares in 12 months is $986.
→ 20 out of 29 analysts recommend buying NFLX shares.
Trade on TradingView with FXOpen. Consider opening an account and access over 700 markets with tight spreads from 0.0 pips and low commissions from $1.50 per lot.
This article represents the opinion of the Companies operating under the FXOpen brand only. It is not to be construed as an offer, solicitation, or recommendation with respect to products and services provided by the Companies operating under the FXOpen brand, nor is it to be considered financial advice.

Netflix on the Rise Bullish Breakout in Motion!Trendline Support
The price is respecting an ascending trendline, indicating a strong bullish sentiment.
Recent candles have bounced off this support line, confirming its reliability.
Breakout Confirmation
The price has broken above a key horizontal resistance level around $870.
This breakout suggests bullish continuation, especially with volume support.
Risk-to-Reward Setup
A well-defined risk-to-reward ratio is visible.
Stop-loss appears to be placed below $853, protecting against a false breakout.
Target set around $939 aligns with a significant resistance zone, offering a potential reward.
Indicators
Positive price momentum is evident, with higher highs and higher lows forming.
Likely supported by broader market strength in tech stocks.
Next Steps
Monitor the price action for sustained movement above $870.
A retracement to retest the breakout level could provide a secondary entry.
Key resistance to watch: $900 and $939.
NFLX is poised for a bullish continuation, with the current setup offering a high-probability trade opportunity.

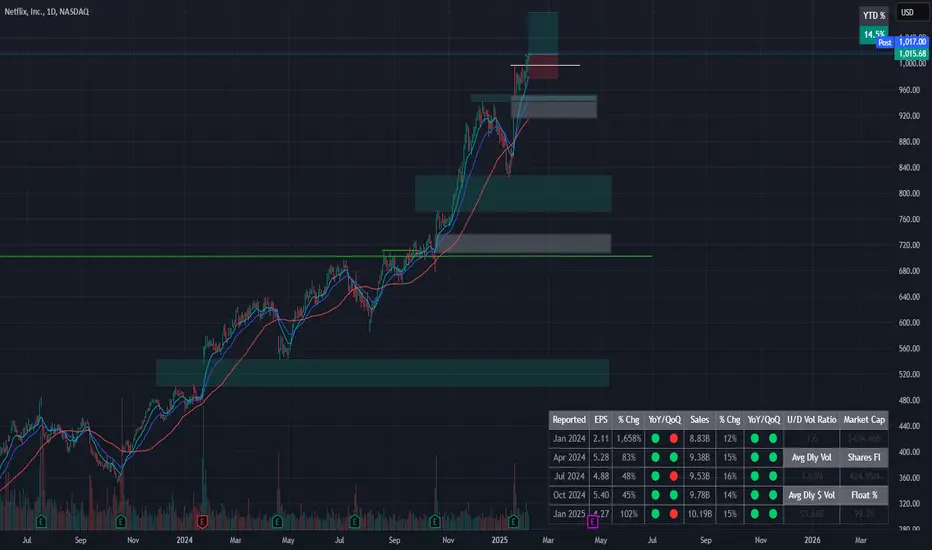
Netflix, Inc. (NFLX): Streaming Innovation at Its BestNetflix, Inc. (NFLX) is a global leader in streaming entertainment, offering a massive library of TV shows, movies, and original content to millions of subscribers worldwide. Known for hit series like Stranger Things and The Crown, Netflix combines great storytelling with cutting-edge technology to deliver seamless viewing experiences. The company’s success is driven by its ability to create high-quality, exclusive content and its focus on expanding into international markets.
Recently, the NFLX stock chart showed a confirmation bar with rising volume, pushing the price into the momentum zone. This signals strong investor interest and potential for continued upward movement.
NFLX rocketNFLX will rocket to 1100 after a brief pullback. Previous all time high will be the first place to look for a long trade.
Trade idea:
long = 942
stop = 930
profit = 1100
Options data:
1/31 expiry
Put Volume Total 29,405
Call Volume Total 56,545
Put/Call Volume Ratio 0.52
Put Open Interest Total 16,822
Call Open Interest Total 17,012
Put/Call Open Interest Ratio 0.99
2/21 expiry
Put Volume Total 17,470
Call Volume Total 23,490
Put/Call Volume Ratio 0.74
Put Open Interest Total 34,267
Call Open Interest Total 39,581
Put/Call Open Interest Ratio 0.87
3/21 expiry
Put Volume Total 13,693
Call Volume Total 15,324
Put/Call Volume Ratio 0.89
Put Open Interest Total 33,647
Call Open Interest Total 34,210
Put/Call Open Interest Ratio 0.98
