Bull flag - $35 Potential NKE Run Up. What will be the catalyst?Potential $33 move to the upside for NKE on this bull flag or falling wedge break. Both continuation patterns on Nikes overall bullish uptrend. Playing out a harami candlestick pattern. Bullish reversal of current shorter downtrend. Confirmation for entry will be this break of todays inside bar high of 167.18. Risky entry before close today. Check stochastic. Do your own DD. What will be the catalyst for this move?
4NKE trade ideas

BUY Opportunity Here we have multiple plans as price does not do what we want. It does what it wants. Hence having dual plans can be very beneficial to achieving a trade opportunity.

Nike analysis using volume profile. Where are we heading?Hi everyone,
Nike stock tends to move agressively after earnings, which happened again on December 21. Let us take a look at the current price action.
The stock made ATH early November and proceeded to sell off with the broad market in December.
At the day of earnings stock reached 155 level, which is just outside the Value zone .
After the market close earnings report was satisfactory, so the next market session brought the stock back to POC with a 6% dayily gain.
Now the way is up . 177-179 level should be retested soon.
Let me know what you think of this stock.
Trade wisely and good luck!
-----------------------------------------------------------------------------------------------------------------
Disclaimer!!!
This is not financial advise

Nike post Earnings White lines- weekly channel
Yellow lines - Bearish descending triangle
Before the earnings Nike was completed a bearish that pushed it below its 50 and 100 sma.
tomorrow depending on how hard the market rallies I think Nike will retest that previous support turned resistance where it will then get rejected and head lower to its weekly support around 153.
Some important numbers
50sma - 166.48
100sma - 164.19
In the aftermarket I notice Nike struggling to get over 164 (100sma)..Keep that in mind..

Nike earnings @ 4:15pm todayNike (NKE) earnings are today 12/20 at 4:15pm. Nike (NKE) reported Q1August 2021 earnings of $1.16 per share on revenue of $12.2B. The consensus earnings estimate was $1.12 per share on revenue of $12.5B. The company said during its conference call it expects Q2 revenue of approximately $10.96B to $11.24B. While the talking heads on TV are hyperventilating about the Turkish Lira in the FX market, supply chain concerns over Omicron, ECB & FOMC 2022 rate hikes & senate build back better gridlock, I will be looking for a long position in NKE this week. I think the biggest downside risk is what Nike says in it's conference call about supply chain concerns and how that may impact it's Q3 guidance. NKE has had an earnings beat the past five quarters in a row, so that's a positive trend.
Q2 November 2021 Consensus:
EPS = $.63
Revenue = $11.25B
P/E = 42.86
Div/yld = .682
52 week H = $179.10
52 week L = $125.44
Price levels 1 day chart:
EMA200 = $153.99
EMA150 = $158.14
EMA100 =$162.31
EMA50 =$166.22
breakout = $180.51
R3 = $177.12
R2 = $173.78
R1 = $170.43
pivot = $167.09
S1 = $163.75
S2 = $160.41
S3 = $157.07
breakdown = $153.73
Do your own due diligence, your risk is 100% your responsibility. This is for educational and entertainment purposes only. You win some or you learn some. Consider being charitable with some of your profit to help humankind. Good luck and happy trading friends...
*3x lucky 7s of trading*
7pt Trading compass:
Price action, entry/exit
Volume average/direction
Trend, patterns, momentum
Newsworthy current events
Revenue
Earnings
Balance sheet
7 Common mistakes:
+5% portfolio trades, capital risk management
Beware of analyst's motives
Emotions & Opinions
FOMO : bad timing
Lack of planning & discipline
Forgetting restraint
Obdurate repetitive errors, no adaptation
7 Important tools:
Trading View app!, Brokerage UI
Accurate indicators & settings
Wide screen monitor/s
Trading log (pencil & graph paper)
Big, organized desk
Reading books, playing chess
Sorted watch-list
Checkout my indicators:
Fibonacci VIP - volume
Fibonacci MA7 - price
pi RSI - trend momentum
TTC - trend channel
AlertiT - notification
www.tradingview.com

NKE Short to 61.8 Retracement. NKE tried to consolidate and break higher but has since failed. Consolidation broke to the downside and retested the support on a long wick. I believe this trade is short as long as we are below 166. The target to the downside is the 61.8 retracement level at about 158.

Just Dump It.As title says Just Dump It, this is the new 2022 rebrand for Nike, shareholders will go from wearing Nike shoes to socks really fast.

Nike USA Sun Storm Investment Trading Desk & NexGen Wealth Management Service Present's: SSITD & NexGen Portfolio of the Week Series
Focus: Worldwide
By Sun Storm Investment Research & NexGen Wealth Management Service
A Profit & Solutions Strategy & Research
Trading | Investment | Stocks | ETF | Mutual Funds | Crypto | Bonds | Options | Dividend | Futures |
USA | Canada | UK | Germany | France | Italy | Rest of Europe | Mexico | India
Disclaimer: Sun Storm Investment and NexGen are not registered financial advisors, so please do your own research before trading & investing anything. This is information is for only research purposes not for actual trading & investing decision.
#debadipb #profitsolutions

A simple iteration It is based on its static and dynamic support ,and due to the relative support from buyers ,it is likely to grow up to the resistance range.

Nike: Breakout is Imminent!!!Hey guys, this is my first ever video tutorial and it's going to be on ticker NKE.
NOTE:
I apologize but I forgot to mention a stop loss (Very important!). In regard to placing a stop loss (which you should ALWAYS be doing) we will be using the average true range and swing high or low. We will want to place our stop loss at 1 ATR above/below the swing low/high when taking a short/long (Respectively).
Please leave a like and some comments on what you would want to see in the future. If enough of you like the content, I will continue to make videos for you guys and gals :)

$NKE - Intricate Weekly Trading PlanHey all! Just gonna get right into it.
Dips at 166.62 should be bought. Dips at 164.75 should REALLY be bought. Very high chance we bounce at both of those levels and capture a clean 6.5% move intraweek.
A break of 173.35 will likely lead us to 175, and then ATHs. I'm less confident in trading this break simply due to the formation of lower highs. I'm afraid the break will get stopped in its tracks.
A loss of 164.75 will be violent, so have your stops set. If we lose 164.75 look to swap to puts FAST. Not too sure where the bottom will be on this one.
GLHF everyone!


Flagging on the Daily- BullishNKE looking interesting here sitting right on its 20-day EMA, falling wedge on the 4-hour and hourly timeframes along with what appears to be a big ascending triangle forming. Just some support and resistance levels to watch along with some RSI based supply and demand zones to keep an eye on in the meantime- Certainly a longer-term play, however, bullish and looking for a breakout from this flag
- Flagging on the Daily & 4-Hour Timeframes
- Sitting on its 20-day EMA
- Seemingly Going to Reclaim the 20-Day SMA (Not Pictured)
- Ascending Triangle Forming (Not Pictured)
- Falling Wedge on the Hourly Timeframe (See Attached Chart Below)
- Bollinger Bands Squeezing on the Hourly Timeframe (See Attached Chart Below)
PT1- $169.91
PT2- $170.98
PT3- $172.39
PT4- $173.18 +
-Hourly Timeframe-

NIKE ANALYSISNike's chart has potential to going up because it could be make double bottom and market look recovery. my target at $177.5 stoploss at $167 if my prediction false.
keep use money management.
Disclaimer : Not recommendation just private analysis

V BottomNot exactly a Cup because it is not rounded at the bottom.
A V bottom comes to a point at it's bottom. Often the left and right side of the V almost mirror each other.
There are 2 pocket pivots close by the support line (green triangle).
This is not to long entry level yet.
There was an ABC bullish pattern but appears a rising wedge interrupted it's progress, plus an unfriendly market as of late.
Short interest is .64% which is low and Negative volume is high showing interest. If this is finished falling from the rising wedge that formed, then this may hit long entry level. I do see a possible crooked M trying to form over the green dashed support level that may interfere if this falls below that support level. It is often best to wait for long entry level unless you are already in a security when a pattern forms.
No recommendation
Chart patterns represent human emotions, and human emotions change, constantly (O:

NKE - STOCKS - 18. OCT. 2021Welcome to our Weekly V2-Trade Setup ( NKE ) !
-
4 HOUR
Bullish closure.
DAILY
Nice price action in most timeframes.
WEEKLY
Expecting more bullish pa
-
STOCK SETUP
BUY NKE
ENTRY LEVEL @ 158.24
SL @ 149.98
TP @ Open
Max Risk: 0.5% - 1%!
(Remember to add a few pips to all levels - different Brokers!)
Leave us a comment or like to keep our content for free and alive.
Have a great week everyone!
ALAN


Nice NIKE trade I don't wear them, I don't buy them but I certainly liked what their charts looked like. Refer to the related ideas linked below to understand the trading system I used for this trade
I bought 10 shares. Stoploss is ATR x3.
When it reached 3R. I sold 5 shares and let the remaining shares to run until price close below the EMA cloud. Currently its running up to 11%

NKE ready to push higher!* Exceptional earnings
* Very strong up trend
* Very high 3-month relative strength in the Consumer Cyclical sector
* Pays dividends
* Breaking out of a 5 month base
* Formed a cup and handle pattern with a base depth of ~28% and a handle of ~2 weeks
* Breaking out with higher than average volume
Trade Idea:
* Now's a great time to get in as the price is really close to the broken level
* Offering a very nice risk/reward ratio
* If you're looking for a discount you can look for an entry near the $174 area
Caution:
* A daily close below $174 would expose $170.62 as the support level
* A daily close below $170.62 would negate the idea.
Note:
* Looking at the growth, earnings and dividends NKE is a great buy and hold stock as well.

Potential Cup and Handle Formation NKE 11/11Keep an eye out for a potential C&H formation here, looking like a handle might be forming within the next week or so...
Price Target = TBD

ABC BullishEarnings are over until close to Christmas! Geez, time goes by too fast!
Possible stop under C or where you see support.
Pocket Pivot at top of gap
No recommendation

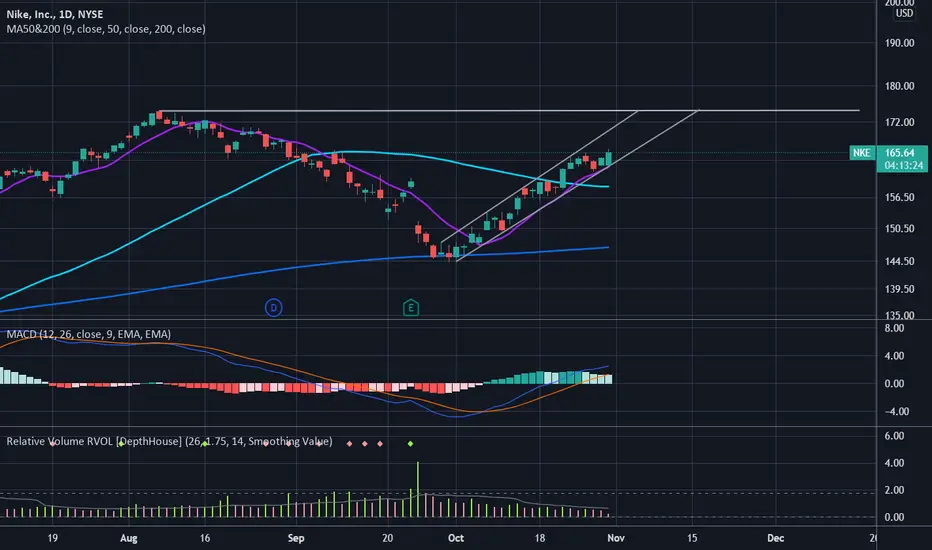
NIKE break out long projectionweekly uptrend price made a retest into 145 zone and took off. trend and lower lows broken easy to see on lower timeframe I'm projection Nike to go to previous weekly swing high 174.50 which would be nice area to take profit
