$NVDA | A Double Bottom in the Making? We’re spotting the early structure of a double bottom pattern forming on NASDAQ:NVDA — a classic bullish reversal signal. After a steep decline, price action is showing signs of stabilization, testing support twice, and trying to recover from the lows.
But there’s a catch...
📌 No confirmation yet.
The neckline still needs to be broken with strong momentum to validate this formation and trigger potential upside.
⚠️ Today’s tariff-related news could be the catalyst. A strong reaction may either confirm the breakout or invalidate the pattern entirely.
What to watch:
Break above the neckline with volume = potential entry ✅
Failure + breakdown = more pain to come ❌
This is a key technical level. Stay sharp and let price action lead the way.
4NVDA trade ideas

NVDA - Moving Average showing Downtrend - Target $100
NVDA
Moving Average showing downward trend. Expecting Target $100 with Bearish Strategy before it starts moving again upward after Trump's Announcement on Tariffs April 02, 2025 at 04:00 PM EST.

ascending triangle forming on 15m chartNVDA on the 15m chart looking ready to breakout of bullish ascending triangle pattern.

NVIDIA The chance to buy for $230 is NOWNVIDIA is forming a Double Bottom on a 1day RSI bullish divergence, same kind it did on the October 31st 2023 low.
The prevailing pattern is a Channel Up and the double bottom could technically kick start the new bullish wave.
The last one almost reached the 5.0 Fibonacci extension before pulling back under the 1day MA50.
Best opportunity to buy in 2025. Target just under the 5.0 Fib at $230.
Follow us, like the idea and leave a comment below!!

Long on NVDAFirst of all, very good company to invest in long term. Uptrend and I am looking the right spot to make a long position. There is a possibility that the retracement will be deeper but I will buy more shares to make a good average price.

Nvidia Wave Analysis – 31 March 2025
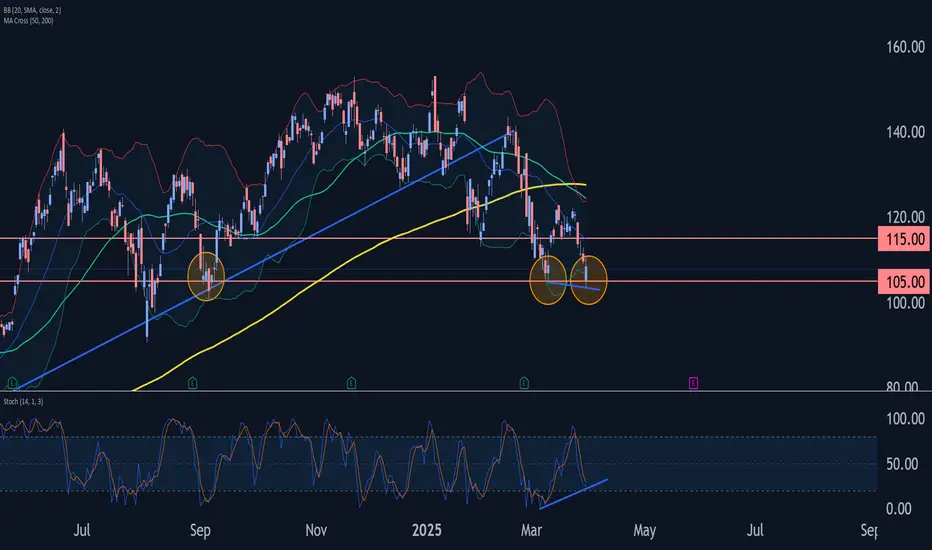
- Nvidia reversed from key support level 105.00
- Likely to rise to resistance level 115.00
Nvidia today reversed from the support area located between the key support level 105.00 (which has been reversing the price from last September) and the lower daily Bollinger Band.
The upward reversal from this support zone stopped the earlier short-term ABC correction ii from the start of March.
Given the strength of the support level 3.60 and the bullish divergence on the daily Stochastic, Nvidia can be expected to rise to the next resistance level 115.00.
NVDA earnings bullish I do dowsing with a pendulum & it's a good test to try it for earnings since there are big moves. It's kind of hit or miss, but really interesting & everyone follows NVDA still, so let's see what energy it has!
I get nervous when there's bullish energy & the stock moves as I'm doing my reading, but this is pretty bullish info I have. Watch for a move up maybe 12%, which takes it to around $145. I also got the number 47, so that's a possibility also.
I did have a little bearishness in saying to sell rallies. I'd be watching the date 3/3 for a possible retracement back down if it does, in fact, go up. It pretty bullish short term though.
I have positive energy in indexes too, so I thought it may be in part because NVDA could influence things, so we'll see.

NVDA support idea $108.90I do dowsing with a pendulum to get answers on what to expect in the market and stocks. I checked on NVDA today, and along with indexes soon (tomorrow) making a somewhat lasting (or longer term) low, I have a level for at least a bounce.
Tomorrow could be a big down day for stocks and indexes as I have timing for a low, but we have yet to reach targets. The $108 area has come before in NVDA, so I feel it really should be a spot to watch. The more refined level is $108.90, so it will be fun to see what happens here; and of course, I could be completely wrong & it does something else!

$NVDA and NVDA Dominance Fib retracement levelsNASDAQ:NVDA is now already in bear market territory and the next question when this slide in the stock price will stop. Today in our Daily dose of Chart we are looking into NVDA Feb retracement levels in the upward sloping channels and the NVDA Dominance in NASDAQ.
If we plot the upward sloping Fib retracement channel joining the top candles weekly chart within the upward sloping channel and then plot the Fib levels to the lowest levels of 2023 and 2024 then we see that the current price is at the 3.618 Fib level which is at 104 $. The next level is 4.236 and that level lies at approx. 95 USD. So if the sell of continues then the next price target is 95 USD.
In this blog space we have floated the idea of NVDA Dominance ($NVDA.D) which is just the ratio of NASDAQ:NVDA vs NASDAQ QQQ. The dark green line in the chart signifies the NVDA Dominance and it is currently well of its highs. If we simply plot the Fib retracement on the Dominance Line, then we see the next support is @618 which will give us a price of 99 $ on the NASDAQ:NVDA stock. So that means technical speaking we have great support and price memory between 95 $ - 99 $.
Verdict : Accumulate NASDAQ:NVDA here and go extra-long @ 95-99 $

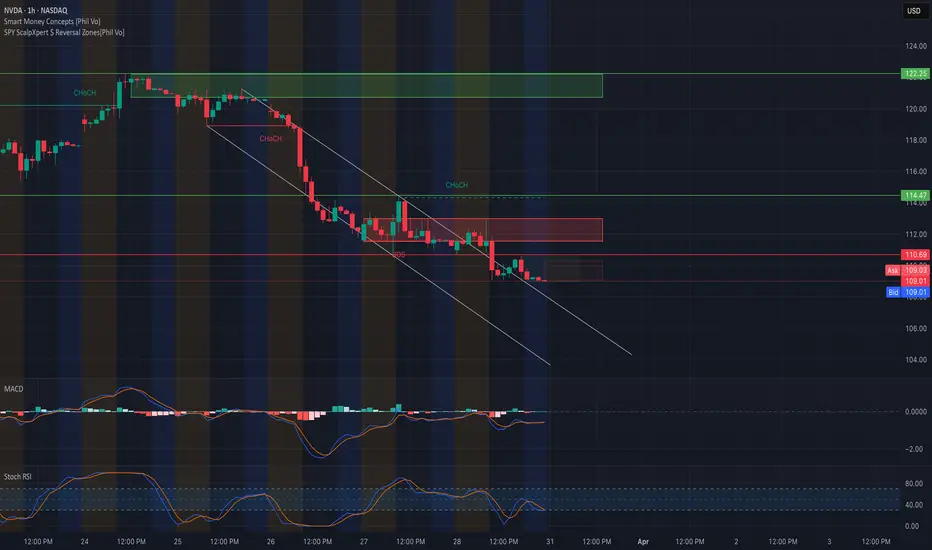
NVDA at a Decision Point – Breakout or Breakdown?🔍 Technical Analysis (1H Chart)
* Market Structure & SMC:
NVDA has consistently respected a downward sloping parallel channel. We see multiple CHoCHs (Change of Character) and a recent Break of Structure (BOS), confirming a bearish trend continuation. Price failed to reclaim the mid-supply zone and is hugging the bottom channel support.
* Supply/Resistance Zones:
* Immediate Resistance: $110.69 (top of current rejection zone)
* Mid Resistance: $114.47
* Strong Resistance: $122.25 (major supply zone)
* Support Levels:
* Immediate Support: $108.64
* Next Critical Support: $104.77 (marked as highest negative GEX / Put Wall support)
* Indicators:
* MACD: Momentum remains bearish with flat histogram bars. No bullish crossover yet.
* Stoch RSI: Oversold but not curling up yet – no strong reversal signal here.
* Volume: Slight uptick on recent sell-off, but not panic volume.
📊 Options Flow / GEX Sentiment (Right Chart)
* GEX Analysis:
* Negative GEX Cluster between $109–105, showing Put Dominance.
* HVL Zone (High Volume Liquidity) near $112, suggesting a magnet zone if bulls recover.
* Strong Call Wall at $118 and $122 — tough resistance ahead.
* Max Put Support Zone at $104.77 – could act as a bounce point or trap.
* Options Oscillator:
* IVR: 24.5 – relatively low implied volatility rank.
* IVx avg: 60.1 – moderate implied volatility.
* CALLS only 5.4% – heavily skewed bearish sentiment.
* Red GEX Bars – dominant Put positions hint at hedge-heavy downside pressure.
🧠 Trade Setups
Scalp/Short-Term Setup
* Bearish Bias unless NVDA reclaims $110.69 with volume.
* 📉 Short Entry: Below $108.50
🎯 Target: $105.00 → $104.77
❌ Stop: $111.00
Reversal Play (Speculative)
* Watch for bullish divergence or sharp reclaim of $112.
* 📈 Long Entry: Above $112 (HVL reclaim)
🎯 Target: $114.50 → $118
❌ Stop: $108
🧨 Options Strategy Idea
Bearish Vertical Spread (Short-Term)
* Buy 110 Put / Sell 105 Put
* Expiration: 1-2 weeks
* Net debit: lower cost with defined risk
* Thesis: NVDA fades toward $105 support
Long Call Idea (Only if $112 flips with strength):
* Buy 115 Call – 2 weeks out
* Needs confirmation of reversal or gamma squeeze
🧭 Bias Summary
* ✅ Directional Bias: Bearish until $112 is reclaimed
* 📉 Price is within a bear channel, respecting structure
* 🔴 Options sentiment confirms downside pressure
* 🛑 Do not long blindly at support – wait for signs of strength
⚠️ Disclaimer
This analysis is for educational purposes only and not financial advice. Always do your own research and manage risk carefully.
ES Draw for next weekExpect onesided meltdown on ES. Upcoming week is going to be massively liquid. Try to position less compare to your original postitions

NVDA 2 The????NASDAQ:NVDA
Outlook - -GEX and -DEX but +OI This week. NASDAQ:NVDA ’s price action will likely hinge on broader
market sentiment rather than company-specific releases, given no major NVIDIA events are slated.
Weekly -- 2nd consecutive down week with increasing volume
Daily -- Downtrend to next HVL under 106 possible
Hourly -- Consolidating at support zone
10m -- Consolidating
Bias -Monitoring U.S. trade policy updates and technical levels for short-term direction.
Volatility remains high, so caution is warranted.
Pivot - 109.65
Upside Targets:
* 111.47--112.91--113.66--115.01
Downside Targets:
* 109.62--108.45--105.05--104.34

NVDA Trade Setup: Catch the Next Wave Before It BreaksAfter a healthy pullback, NVDA is setting the stage for what could be a powerful rebound—and savvy traders know this is when opportunity knocks.
We’ve identified three key entry points where the risk-reward setup becomes especially attractive:
🔹 104 – A potential bounce zone where early buyers might step in.
🔹 95 – A deeper level with stronger support, ideal for scaling in.
🔹 80 – A high-conviction level where long-term bulls may load up for the ride.
On the upside, here are three profit targets worth watching:
✅ 120 – First take-profit zone, a logical exit as momentum begins to return.
✅ 135 – Mid-level resistance where partial profits can lock in gains.
✅ 145+ – A stretch target for those riding the full recovery wave.
This strategy allows for smart layering of entries and profits, giving flexibility whether the bounce is quick or more gradual. Always stay alert to price action confirmation and use stops that align with your risk tolerance.
Disclaimer: This analysis is for informational purposes only and does not constitute investment advice. Trading in financial markets involves risk, and you should conduct your own research or consult a licensed financial advisor before making any investment decisions.

Positioning for Market Repricing: A PE-Based Strategy Involving Both Nvidia and Apple currently have price-to-earnings (PE) ratios near 30, while other technology companies, such as Tesla and Analog Devices, are trading with significantly higher PE ratios of over 125 and 60, respectively. Given the economic headwinds we are facing, I believe stocks with higher PE ratios may experience more pronounced declines compared to those with lower ratios.
At present, I intend to initiate a long position in Nvidia at its current price around $110, with plans to take profits by shorting the stock at approximately $118, targeting a price of $115. Additionally, once Nvidia reaches my profit target of $118, I will look to short both Tesla and Analog Devices at that price range.
This strategy is based on the expectation that the broader market may place additional pressure on high-PE stocks in the near term.

NVDA has been trading in channel /range from 05/2024 to present.With only a few short breaks of the channel NVDA has been trading in range for 10 months.

NVDA Silicon Slippage: The Bearish Case for NVDA in 5 ContractsNVDA Bearish Options Thesis — “AI’s Reality Check”
A $500 Bet Against Hype, Headwinds, and a Tired Rally
Underlying: NVIDIA (NVDA)
Current Price: $109.67
Strategy: Buy 5x $90 PUTs expiring May 2, 2025 @ $1.00
Total Cost (Risk): $500
Breakeven: $89.00
Max Value at Expiry: $45,000 (if NVDA → $0)
Target Zone: $85–$95
Risk/Reward Profile: Asymmetric 1:9+
🧠 Thesis Summary: Why NVDA Could Drop
NVIDIA, the undisputed champion of the AI GPU race, now finds itself under increasing pressure from macro forces, competition, and sentiment. This trade capitalizes on a short-term reversal thesis into earnings season and macro repricing.
🚨 Key Catalysts for Downside:
🧬 1. AI Hype Fatigue
The market is cooling on generative AI names after 12+ months of hype.
Investor sentiment is shifting toward monetization over narrative — which hits NVDA’s high-multiple story.
💥 2. DeepSeek & Chinese Competition
The emergence of DeepSeek (a competitive LLM) raises the risk of a hardware shift in the East.
China accelerating self-sufficiency in chips = reduced NVDA demand.
📉 3. Macro Headwinds & Tariffs
Renewed trade war tensions threaten advanced chip exports.
Tariffs and tighter regulations = real demand compression for NVDA’s top-line growth.
📊 4. Technical Breakdown Confirmed
Weekly close below Fib 0.382 ($109.44) — now resistance.
RSI at 41.44 — weak and trending down.
Below VWAP ($113.65), signaling momentum shift.
"NVIDIA isn't breaking down because it's bad — it's breaking down because the market is waking up."
💰 Trade Breakdown: 5x $90 PUTs @ $1.00 (May 2, 2025)
Metric Value
Contracts 5
Cost per Contract $100
Total Premium $500
Breakeven $89.00
Max Gain $45,000
Max Loss $500 (premium only)
📊 P&L Scenarios (5 Contracts)
NVDA Price Drop % Intrinsic Value Total Payout Net Profit ROI (%)
$100 -8.8% $0.00 $0 -$500 -100%
$95 -13.4% $0.00 $0 -$500 -100%
$90 -17.9% $0.00 $0 -$500 -100%
$85 -22.5% $5.00 $2,500 $2,000 400%
$82.70 -24.6% $7.30 $3,650 $3,150 630%
$80 -27.1% $10.00 $5,000 $4,500 900%
🧮 Technical Levels to Watch
Level Price Notes
VWAP $113.65 Rejected
0.382 Fib $109.44 Just breached
0.5 Fib $96.07 Strong support
0.618 Fib $82.70 Bearish target
RSI 41.44 Weak momentum
✅ Summary
Factor Insight
Total Spent $500 (5x $90 PUTs @ $1.00)
Breakeven $89.00
Risk Fully capped at $500
Potential Return Up to $4,500 (900%) if NVDA → $80
Catalyst Market re-rating AI, earnings unknowns, regulatory clouds
Trade Horizon 33 days — high velocity post-breakdown possible

NVDA pullbackNVDA's monthly candle suggests it's time for a pullback. A retracement could go as low as $50–$40. Let's see how it plays out in the coming months.

Will you dare to short NVDIA at 122? Shorting NVDIA something no one would have dared to do in 2024 and rightfully so. It was having a massive uptrend and there was no reason to go against it.
2025 is completely different story. The emergence of DeepSeek has dampened its prospects and NVDIA saw a massive double top at 152 (The same time S&P reversed at 6144).
It has now fallen to a low of 107 and made its way back to 121 where there is a pattern to sell. Here is our thinking:
1) It is in a daily downtrend
2) It is following the H4 trend
3) There is a pattern to sell
4) RSI divergence is present
We will sell around 122 with a stop loss of 125.50 and target the low of 107.
Yes, we just follow the trend and not the news or sentiments.

NVDA gap downseems to be falling off a cliff here and ready to break a long term trend.
I think $75 is incoming

NVDA - I'm not interested hereI was not interested when it dropped below the summer 2024 high. I'm also not interested now. I'd rather see a clear reclaim of that summer 2024 level. For now, European and Chinese stocks bring much needed gains where American stocks struggle. So I'd rather not put my money on the line here.

THE BATTLE FOR AI SUPREMACY....WHO WILL WIN???Chinese artificial intelligence model called DeepSeek sparked a selloff in Al related shares, with megacap stocks including Nvidia which has been hit the most. The DeepSeek has launched a free assistant that uses cheaper chips and less data.This move seems to challenge the common belief in financial market that AI will boost demand for everything from chipmakers to data centres. As this startup threatens the dominance of US AI companies the market has sharply declined making a major sell off across other assets. L
On the technical side, Nvidia has been trading in a rise channel which has broken further confirming a sell. COULD WE SEE IT SELL FURTHER DOWN PAST $70??? MHHH
WHAT ARE YOUR THOUGHTS ? CAN US AI BEAT THE DeepSeeK?

Will $NVDA see a 30% correction in April 2025?As of March 27, 2025, NVIDIA Corporation (NVDA) is trading at $111.43.
NVDA's 50-day moving average has recently crossed below its 200-day moving average, forming a "death cross," a technical pattern that can indicate a potential downtrend. The last time this occurred was back in April of 2022. During this time we saw a 55% correction that lasted over 270 days plus.
Key support levels to monitor are approximately $105 for more of dynamic support $103 , aligning with the March low, and around $91, corresponding to previous peaks from last year.
On the upside, resistance may be encountered near $130, close to a descending trendline and moving averages, with a more significant resistance around $150, near prior peaks. Overall, we have a Double Top pattern in motion
Market Sentiment and Considerations:
Recent declines in NVDA's stock price are influenced by factors such as stricter energy regulations in China, which may impact sales of Nvidia's H20 chip. Additionally, geopolitical concerns, including new AI export restrictions set to take effect in mid-May, have contributed to investor caution.
Long-Term Investment Perspective:
Despite current market volatility, some analysts view NVDA's stock as attractively valued, trading at approximately 20 times estimated earnings, below its median forward level. For long-term investors, current price levels near key support zones may present potential buying opportunities. However, it's essential to consider the broader market environment, company fundamentals, and personal investment objectives.
While technical indicators suggest caution in the short term, NVDA's position in the AI and semiconductor sectors may offer long-term growth potential. Investors should monitor key support and resistance levels and stay informed about geopolitical developments affecting the company.

NVDA NVIDIA Price Target by Year-EndNVIDIA Corporation (NVDA) remains a dominant force in the AI and semiconductor markets, with its forward price-to-earnings (P/E) ratio currently at 19.37—a reasonable valuation considering its growth trajectory and market position.
NVIDIA’s leadership in the AI sector, particularly through its cutting-edge GPUs, has driven strong demand from data centers, cloud providers, and AI developers. The company’s recent product launches, including the Hopper and Blackwell architectures, have further solidified its competitive edge.
Despite recent market volatility, NVIDIA's consistent revenue growth and expanding profit margins support the bullish case. The current P/E of 19.37 reflects a balanced risk-reward profile, suggesting that the stock is not overvalued despite its impressive performance.
A price target of $145 by year-end reflects approximately 15% upside from current levels, driven by sustained AI demand and growing market penetration. Investors should watch for quarterly earnings reports and updates on AI chip demand, as these will likely act as key catalysts for upward momentum.
