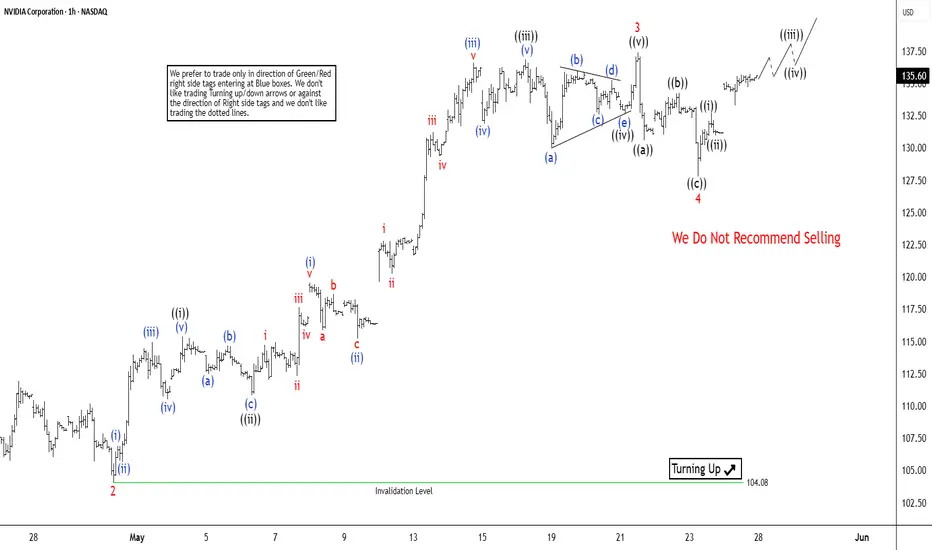
Nvidia (NVDA) Elliott Wave Analysis: Wave 5 Nearing Its EndThe short-term Elliott Wave analysis for NVIDIA (NVDA) indicates a bullish trend unfolding as an impulse structure since the low on April 21, 2025. From that low, the stock completed wave 1 at $111.92. The stock then followed by a corrective pullback in wave 2, which bottomed at $104.08. The subsequent rally in wave 3 displayed strong momentum, characterized by a nested impulse structure in a lesser degree. Within wave 3, the first sub-wave, wave ((i)), peaked at $115.40, with a brief dip in wave ((ii)) to $110.82. The powerful wave ((iii)) surged to $136.89, followed by a shallow pullback in wave ((iv)) to $132.65. The final leg, wave ((v)), concluded at $137.40, completing wave 3 on a higher degree.
The corrective wave 4 unfolded as a zigzag pattern. From the wave 3 peak, wave ((a)) declined to $130.59, wave ((b)) rebounded to $134.23, and wave ((c)) completed the pullback at $127.80, finalizing wave 4. NVIDIA has since resumed its upward trajectory in wave 5. As long as the pivot low at $104.08 holds, the stock is expected to extend higher in wave 5, completing the cycle from the April 21 low. Following this, a larger-degree three-wave pullback is anticipated, offering a potential pause in the bullish trend.
4NVDA trade ideas
$140 NVDA to the downside?I am seeing a previous ORD Block to be tested at $139/140 after that I might expect some sort of "news" to break and start a selling to fill both Gaps on the downside before it continues.
It might happen or not, but my experience shows me manipulation is quite real. And we got to account for that guy that saw the market collapse before anyone you know that famous housing problem that even made a movie about it? He is shorting NVDA as well. I do not believe in any of them, but I would be careful. Unless NVDA doesn't break strongly above $140 and retest without problems. I would bet going down eventually too.
For now going up.

SunsetToday the stock tried again to get a new top - successfully. But the top has been sold immediately! This week we have seen 3 windows. All of them are still open.
This jumping from window to window shows an overaware market, perhaps artificial(AI!) pumping.
The sale of the recent top is confirming my view.
I am selling.

NVIDIA Pre-Earnings – Why is it rising already?First of all — thank you all for the support on the previous analysis: over 900 views and 36 boosts! 🙏
A common question came up:
"Why is NVDA rising if earnings haven’t been released yet?"
Simple: the market is anticipating.
There’s strong expectation that NVIDIA will once again outperform when it reports on May 28. That alone has brought in early buying pressure — both institutional and retail — and we’re seeing that reflected in the current price action.
🧠 This is what we often call "buy the rumor".
NVDA is also benefiting from:
Renewed strength in the tech sector
High demand for AI infrastructure
Clear leadership in its industry
I entered the position ahead of the move, based on fundamentals and a strict risk management plan. If earnings deliver, the CALL option should accelerate significantly. If not, I already have a defined stop-loss strategy in place.
This is not about guessing — it’s about staying disciplined.
Let’s see how the next 48 hours unfold. 🚀📈
$NVDA – Earnings Super Bubble?🚨 Nvidia is reporting earnings tomorrow, and the market is waiting with bated breath.
While analysts pile on with hyper-bullish predictions extrapolating the AI super bubble, they seem to ignore one glaring fact:
👉 The last time Nvidia beat earnings, the stock crashed -45% shortly after.
Technical view:
We’re near resistance at the previous post-earnings high.
RSI sits at 63.80, hinting at possible exhaustion.
Volume spikes hint at indecision, not confirmation.
This could be a make or break moment for NASDAQ:NVDA and by extension, the entire Tech sector.

What to Watch in Nvidia Earnings and Key Technical LevelsStock markets around the globe are turning their focus to one key earnings report: Nvidia. AI has been the primary driver of the U.S. stock market over the past few years, and Nvidia’s earnings are widely viewed as the best indicator of growth in the AI sector. The correlation between Nvidia and broader U.S. stock performance as well as its influence on global equities, crypto, and FX is strong enough for the world to fixate on this report.
Nvidia is expected to report $0.88 EPS for the first quarter of FY2026, representing a 43.36% year-over-year increase, but a slight decline quarter-over-quarter. The company previously guided revenue between $42.14 billion and $43.86 billion, with market consensus currently at $43.317 billion, in line with that range.
The key revenue stream, Data Center, is expected to generate $39.357 billion, reflecting 74.44% growth. Some analysts are forecasting as high as $42.051 billion for this segment alone.
At a forward P/E ratio of 27.6x, Nvidia is trading well below its 1-year (32.1x), 2-year (33.7x), and 5-year (40.1x) historical averages. This more favorable valuation, coupled with strong AI tailwinds, could present a solid medium- to long-term buying opportunity if earnings and guidance support the growth narrative.
After breaking out of the downtrend, NVDA approached the 140 resistance level but failed to break through. Following the upcoming earnings release, if Nvidia pulls back to either 118 or 110, those levels could present buying opportunities, assuming the report isn’t significantly negative.
It’s worth noting that sometimes real market expectations run much higher than the analyst consensus, which can lead to a selloff even after a strong earnings report.
The 154 level remains the key resistance for now, and in our view, a breakout this week carries a relatively low probability. If the report tomorrow exceeds expectations, 154 could still act as a barrier and trigger some profit-taking by Nvidia bulls.
What’s Happening with Nvidia (NVDA) Ahead of Earnings?What’s Happening with Nvidia (NVDA) Ahead of Earnings?
After an extended weekend due to Veterans Day in the US (observed on Monday), financial markets are returning to active trading. The highlight of the week will be Nvidia’s (NVDA) earnings report, scheduled for Wednesday after the close of the main trading session.
What You Need to Know Ahead of Nvidia’s Earnings
According to media reports, market participants are concerned about:
→ escalating trade tensions between the US and China;
→ increasing competition;
→ Nvidia’s premium pricing at a time when the GPU market is shifting towards more affordable alternatives;
→ downward revisions to earnings per share, which some interpret as a sign that Nvidia’s report may fall short of expectations.
On the other hand, Reuters reports that Nvidia is set to unveil a new processor that:
→ is designed specifically for AI applications;
→ is based on the Blackwell architecture;
→ will not be subject to US export restrictions on chips sent to China;
→ is expected to be cost-effective.
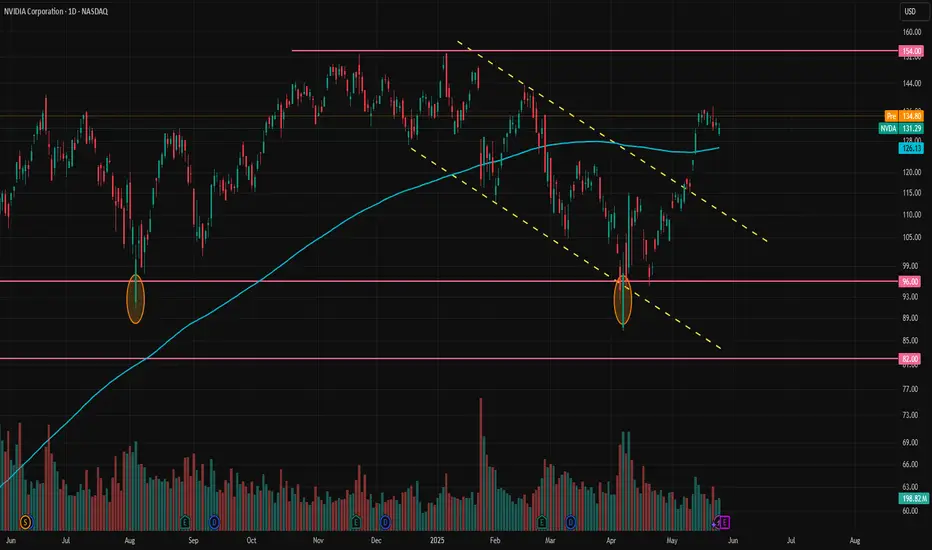
Technical Analysis of Nvidia (NVDA) Stock
Today’s NVDA price chart suggests that the descending channel (marked in red) may be forming a large bullish flag — a continuation pattern that typically indicates a potential resumption of the uptrend after a corrective phase.
Price action in Nvidia stock has slowed near the upper boundary of the channel — a sign of temporary equilibrium between supply and demand (this could also be interpreted as traders adopting a wait-and-see stance ahead of the earnings release).
Given that the earnings report is a potentially strong price catalyst, a breakout from the bullish flag cannot be ruled out. Such a move could signal the start of a new phase in NVDA’s long-term upward trend (as indicated by the arrow on the chart).
This article represents the opinion of the Companies operating under the FXOpen brand only. It is not to be construed as an offer, solicitation, or recommendation with respect to products and services provided by the Companies operating under the FXOpen brand, nor is it to be considered financial advice.

NVDA - 140 Quasimodo?Well NVDA has exceeded the 120 PoC from the last year, and other than the head and shoulders developing it looks rather bullish above that 120. But I would sell 140, or at least not buy.
And if I'm buying I'd probably wait for 112. Think I will wait forever? 😂
Will update after we get some more data.

$NVDA bull flag potentialNASDAQ:NVDA setting up with a bull flag formation on the daily. A strong ER with good guidance can get us to 140-145. A less than stellar guidance can break the bull flag thesis and send it back to the 120-125 range, with some gaps below.

This 3 Step System Will Show You The Trending StockThis is a powerful chart for you to watch.
Because its following the Rocket booster
strategy.
The Rocket booster Strategy has 3 Steps;
1-The price has to be above the 50 EMA
2-The price has to be above the 200 EMA
3-The price should gap up or trend up.
In order for us to know whether the price
will trend up we are using the ADX indicator.
We make sure that the Blue line
Is rising between the Green line
and the Red line .
This confirms the last step of the rocket booster
strategy.Also remember that the NASDAQ is up-trending.
Rocket boost this content to learn more.
Disclaimer;Trading is risky please use a simulation account
for trading before you trade with real money.
Also learn risk management and profit taking strategies.

NVDA will drop this yearUnless we witness a breakout or signs of one, we will head down. Next year, we will head back up higher than ever, which will increase our chances of breaking out and potentially spiking up 50-200% . For now, I anticipate a significant drop, but ensure your stop-loss is ready in case of a breakout. If that’s the case, I’d buy a long. For now there are no signs of such so I am shorting.
This analysis is solely from charts
Good luck traders

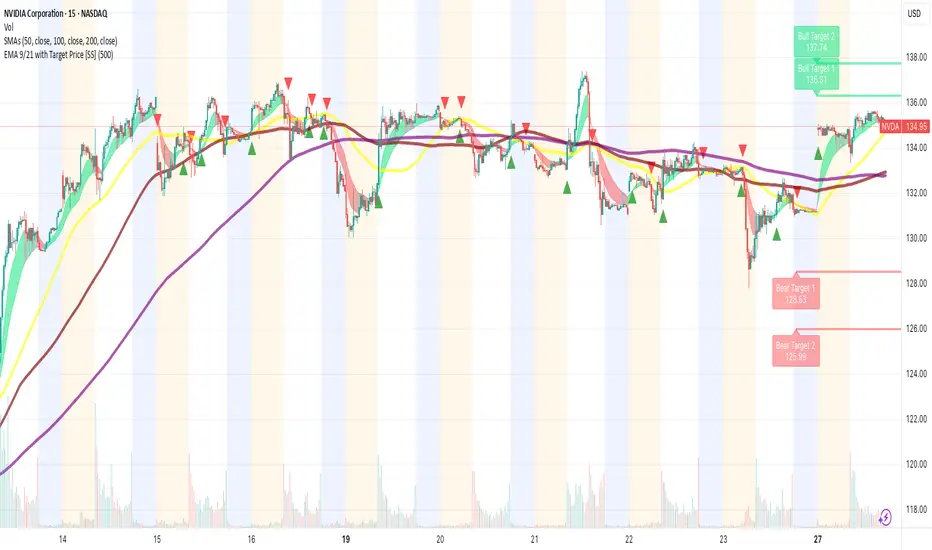
NVDA Weekly Options Trade Plan 2025-05-25NVDA Weekly Analysis Summary (2025-05-25)
Model Summaries Grok/xAI: Mixed technical signals—bullish on daily, bearish on 5-minute; neutral overall; no trade recommended (55% confidence). Claude/Anthropic: Moderately bearish; recommends buying the $128 put at ~$3.60 for a 50–100% profit target; confidence 72%. Llama/Meta: Moderately bearish but views premium/risk as unfavorable for buying; instead suggests selling the $130 put; confidence 70%. Gemini/Google: Strong intraday bearish technicals and negative sentiment; recommends buying the $120 put at ~$1.24 as a day trade; confidence 65%. DeepSeek: Moderately bearish but sees premiums >$1 as too rich; no trade recommended (55% confidence). Areas of Agreement and Disagreement Agreement: • Overall moderately bearish bias for NVDA into weekly expiry. • Rising VIX, max-pain near $126, and negative news support downside. Disagreement: • Trade/no-trade: Grok and DeepSeek pass, Claude, Gemini and Llama propose trades. • Strike selection: Claude prefers $128 put; Gemini $120 put; Llama sells $130 put. • Strategy type: All bearish ideas are buy puts except Llama, which suggests naked put selling. Conclusion Overall Market Direction: Moderately Bearish for the week ending 2025-05-30. Recommended Trade: Buy a weekly put to capture the expected pull toward the $126 max-pain level. • Instrument: NVDA 2025-05-30 $128 Put • Entry Timing: At market open • Entry Price: $3.65 (ask) • Profit Target: $5.48 (≈50% gain ⇒ midpoint sell or scale) • Stop Loss: $2.56 (≈30% loss) • Size: 1 contract Confidence Level: 70% Key Risks and Considerations: • Intraday oversold conditions could trigger a short-term bounce. • Theta decay accelerates late in the week—need timely exit. • Holiday-shortened week may damp momentum. • Liquidity is good at the $128 strike but bid-ask spread and slippage can impact execution.
TRADE_DETAILS (JSON Format)
{ "instrument": "NVDA", "direction": "put", "strike": 128.0, "expiry": "2025-05-30", "confidence": 0.70, "profit_target": 5.48, "stop_loss": 2.56, "size": 1, "entry_price": 3.65, "entry_timing": "open", "signal_publish_time": "2025-05-25 10:57:51 UTC-04:00" } 📊 TRADE DETAILS 📊 🎯 Instrument: NVDA 🔀 Direction: PUT (SHORT) 🎯 Strike: 128.00 💵 Entry Price: 3.65 🎯 Profit Target: 5.48 🛑 Stop Loss: 2.56 📅 Expiry: 2025-05-30 📏 Size: 1 📈 Confidence: 70% ⏰ Entry Timing: open 🕒 Signal Time: 2025-05-25 10:58:05 EDT
Disclaimer: This newsletter is not trading or investment advice but for general informational purposes only. This newsletter represents my personal opinions based on proprietary research which I am sharing publicly as my personal blog. Futures, stocks, and options trading of any kind involves a lot of risk. No guarantee of any profit whatsoever is made. In fact, you may lose everything you have. So be very careful. I guarantee no profit whatsoever, You assume the entire cost and risk of any trading or investing activities you choose to undertake. You are solely responsible for making your own investment decisions. Owners/authors of this newsletter, its representatives, its principals, its moderators, and its members, are NOT registered as securities broker-dealers or investment advisors either with the U.S. Securities and Exchange Commission, CFTC, or with any other securities/regulatory authority. Consult with a registered investment advisor, broker-dealer, and/or financial advisor. By reading and using this newsletter or any of my publications, you are agreeing to these terms. Any screenshots used here are courtesy of TradingView. I am just an end user with no affiliations with them. Information and quotes shared in this blog can be 100% wrong. Markets are risky and can go to 0 at any time. Furthermore, you will not share or copy any content in this blog as it is the authors' IP. By reading this blog, you accept these terms of conditions and acknowledge I am sharing this blog as my personal trading journal, nothing more.

$NVDANASDAQ:NVDA reports earnings post-market tomorrow.
📈 Price climbing, but volume is fading — signs of weakening interest and a likely reversal.
⚠️ If $140 doesn’t break with tomorrow’s open, expecting a drop toward $124–$122 during the day.
📉 Further downside likely this week, with possible support forming around $115.
30-min chart included for context.
#NVDA #Stocks #Trading #Earnings #TechnicalAnalysis

Nvidia Update ahead of Quarterly results In this video I recap my previous Nvidia video where I anticipated a rangebound price action with the possibility of a new low for longs leading towards Quarterly earnings.
With the highly anticipated results only days away I outline the possibility for price to pull back into a really strong level of support for a possible long entry .
Tools used
TR Pocket
Fibonacci
Anchored VWAP
Volume Profile
Thankyou for your continued Support

Controlled Risk Growth Strategy🚀 We begin with NVIDIA ( NASDAQ:NVDA ): Tech, AI, and a long-term vision.
Hi community 👋, today I’m sharing the launch of a solid strategy designed to achieve steady growth while maintaining strict risk control in every step.
✅ General strategy:
Max risk per trade: 6%
High-potential trades limited to 15% of portfolio
Based on a custom technical and fundamental 20-point validation system
💥 First trade activated:
🎯 CALL on NASDAQ:NVDA (NVIDIA)
📅 Expiration: September 19, 2025
💵 Strike: $134
💰 Premium: $1,515 (~5% of portfolio)
📅 We're also watching closely the upcoming earnings report on May 28, which could trigger a strong revaluation of the contract if projections are confirmed.
🧠 Why NASDAQ:NVDA ?
NVIDIA isn’t just hype. It’s at the core of multiple tech revolutions:
🔹 Undisputed leader in AI chips
🔹 Key supplier to tech giants (Amazon, Microsoft, Tesla, OpenAI…)
🔹 Developer of CUDA platform used in AI, scientific modeling, and 3D rendering
🔹 Rapid growth across data centers, gaming, and autonomous vehicles
🔹 Strong acceptance from institutional and retail investors
🔹 Consistently high demand and growing global interest in its training tech
🌐 Ongoing and future projects:
Expanding its ecosystem with generative AI
New business units focused on health, defense, and smart cities
Strategic global partnerships in semiconductors and infrastructure
🛡️ Risk management first:
Planned entries
Measured risk
Clear expectations
📌 If you’re looking to copy a strategy that balances vision, analysis, and discipline, you’re in the right place.
#NVDA #CALLoption #RiskManagement #SmartInvesting #TechStocks #PopularInvestor #AIStocks
Highlight Key Price ZonesHere’s my theory.
What if we highlight the candle stick history by assigning different color keys and their representations.
Thus showing us a complete 4 step break down of price and its history.
Edit candle stick properties by changing the source of our discovery path.

$NVDA🚀 Project Stargate in Abilene, TX might be the fuel NASDAQ:NVDA needs to stay strong with top-tier AI chips.
With NASDAQ:MSFT and NASDAQ:META competing in AI infrastructure, this could build a powerful U.S. tech backbone.
Performance drives interest both customers & investors.

NVDA Possible PlaysCurrently looking to see if NVDA can manage to get through next week and bounce up or the alternate route where we see a correction. Thoughts and comments appreciated.
NVDA - PULLBACK AND FINAL PUSH UNTIL CORRECTIONGood Morning,
Hope all is well. NVDA accomplishing quite the push since finding its support in April. We are looking for a pullback and one final push before initiating a corrective wave. If the corrective wave holds above the previous bullish trend you could expect another strong bullish push.
Enjoy!

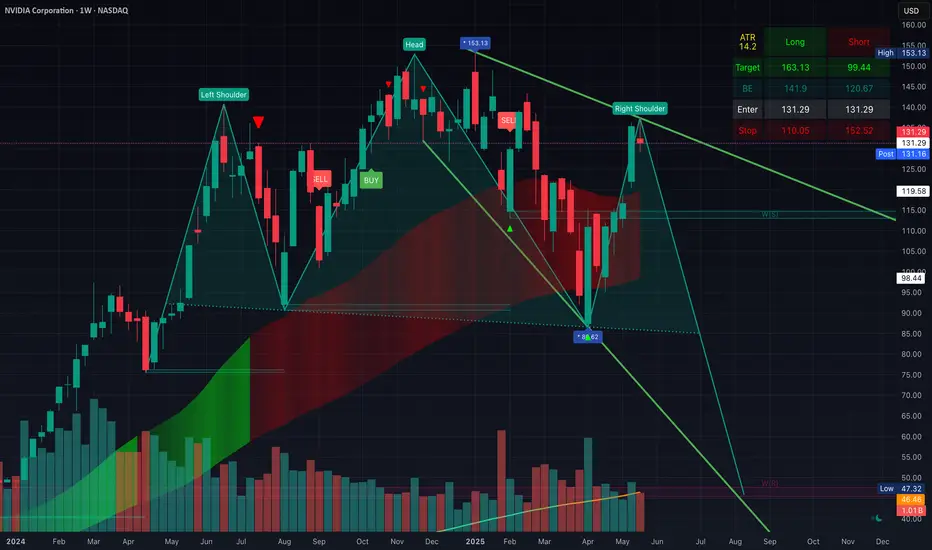
Possible Head & Shoulders Forming On The WeeklyWeekly chart shows a potential H&S forming. Looking for a $120 retest soon minimum. If that breaks, it should retest the March/April lows (also the h&s neckline).... If that doesnt hold, this will plummet to $50 give or take.
Time to take profit/hedge imo
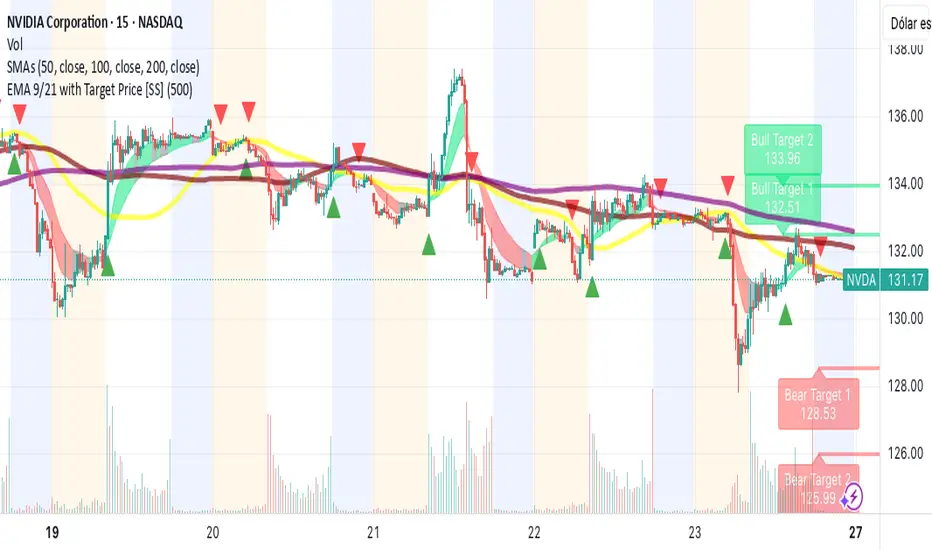
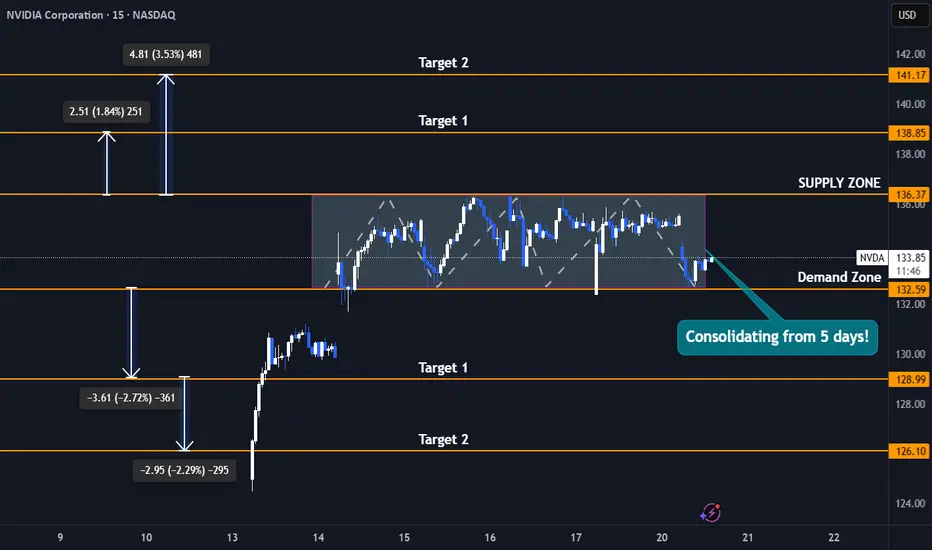
Nvidia Stock 5-Day Consolidation Breakout - Uptrend or Pullback?Trade Duration: Intraday
Trade Type: Breakout
- Nvidia is currently consolidating tightly between $132 and $136, forming a narrow range that reflects a balance between buyers and sellers unwilling to relinquish control. This range-bound action signals indecision, but it won’t last indefinitely.
- Typically, the longer the consolidation, the more significant the subsequent move. As new participants enter the market, a breakout—whether upward or downward—can trigger a powerful surge.
- This move is often amplified by breakout buyers joining in and stop-loss orders of trapped traders being triggered, creating an ideal setup for an intraday breakout trade.
- I plan to initiate either a buy or sell position depending on the breakout direction, capitalizing on the momentum generated by this tight consolidation phase.
Upside Targets : 138$ and 141$
Downside Targets : 128$ and 126$
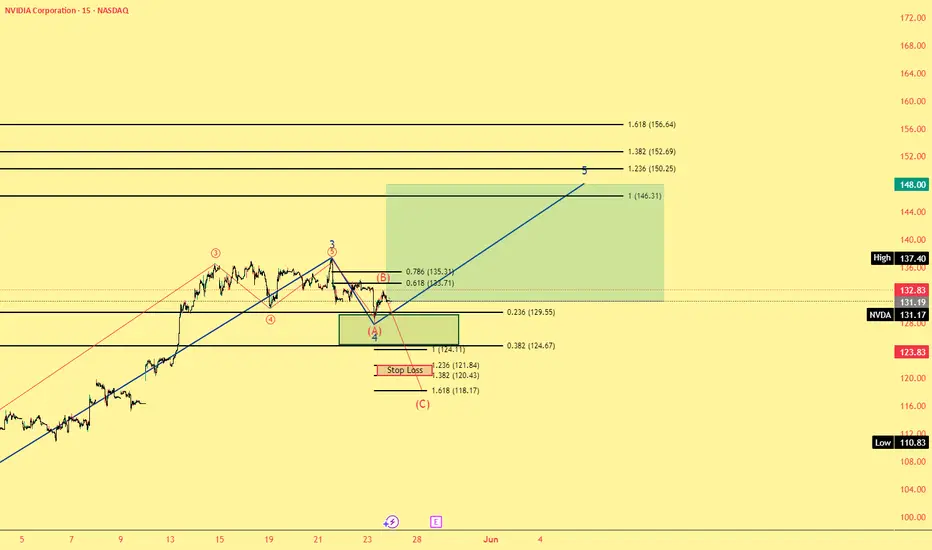
SHORT | NVDANASDAQ:NVDA
Key Observations:
Current Price Action:
Price: $131.80
Recent Drop: -2.58 (-1.92%)
Support and Resistance Levels:
Immediate Resistance: $134.70 to $138.83
This red zone represents a strong supply area where the price has historically faced selling pressure.
Immediate Support: $122.74 (Target Price 1)
Further Supports:
Target Price 2: $116.65 (Aligned with 0.5 Fibonacci Retracement)
Target Price 3: $108.38 (Previous structural low)
Trendlines:
Red Uptrend Line: Recently broken, indicating weakening bullish momentum.
Green Downtrend Line: Long-term resistance trendline from the previous Lower Highs (LH) is still intact and respected.
The break below the minor trendline suggests a corrective wave (4) might be in motion.
Fibonacci Levels:
0.382 Fib Retracement: $121.22
0.5 Fib Retracement: $116.22
These levels align with potential targets in a wave (4) corrective phase according to Elliott Wave theory.
Target Prices:
Target Price 1: $122.74
This is the closest demand zone and aligns with the 0.382 retracement—high-probability support.
Target Price 2: $116.65
Aligned with the 0.5 Fibonacci level and previous consolidation.
Target Price 3: $108.38
A major structural support and potential wave (4) bottom if market turns sharply bearish.
Summary:
NVIDIA Corporation (NVDA) is showing early signs of a corrective phase after failing to break through strong resistance in the $134–$138 range. The price rejected the resistance zone and is likely entering wave (4) correction. Key support levels to monitor are $122.74, $116.65, and $108.38, corresponding with Fibonacci retracement levels and historical price structure. A break below the short-term trendline increases the probability of a continued pullback before potentially resuming the uptrend in wave (5).

NVDA ..The nvidia levels of interesting worthiness
^^See my other idea on how the lines work and how I use them to see about the worthiness or V-bounces or to determine if flags are forming...
only addition i will put here...is the application of a basic Fib retrace from the top start of the trend in descending pattern to the first breach of the line, after the second pivot point. So the yellow markers show the retrace and the green show the trend line of two worth pivots.
A nice X forms on that candle between the lines and the fib retrace...
