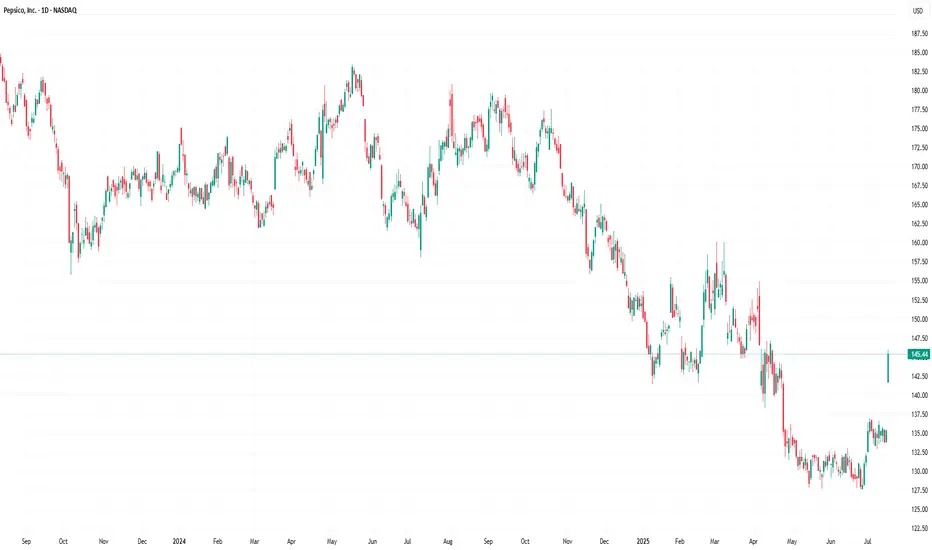
PEPsico is looking to pop up further NASDAQ:PEP had a strong gap up, and with the latest completion of the cup and handle, it is clear that the upside is likely coming back. Bullish engulfing candle was seen as a strong contender for continued upside. My guess is with the positive momentum, the stock is likely to break above the downtrend channel.
Long-term MACD is strong and histogram is positive. Crossover at the bottom confirms the reversal.
Stochastic oscillator shows oversold signal in.
23-period ROC is positive and DMI shows strongly firm in bullish strength.
Key immediate support is at 138.00 and 168.12 will be our major target.
4PEP trade ideas

PEP: PepsiCo Earnings resultsIts looks like PEP is a buy now. Just want to double check on future sales growth as it is stable for a while. Lower stock price made the dividend very attractive since PEP is a defensive stock.
Disclaimer: This content is NOT a financial advise, it is for educational purpose only.

PepsiCo (PEP) Stock Rallies 7.4% Following Earnings ReportPepsiCo (PEP) Stock Rallies 7.4% Following Earnings Report – What Comes Next?
Yesterday, PepsiCo Inc. (PEP) released its quarterly earnings report, which significantly exceeded market expectations:
→ Earnings per share (EPS) came in at $2.12, surpassing the forecast of $2.02.
→ Gross revenue reached $22.7 billion, above the projected $22.3 billion.
In addition, PepsiCo reaffirmed its full-year guidance: the company expects earnings per share to remain virtually unchanged compared to the previous year, while organic revenue is anticipated to grow by a few percentage points.
Executives also outlined development plans for their brand portfolio, emphasising a focus on the growing demand for healthier snacks and a strategic initiative to reduce costs.
These factors contributed to PepsiCo Inc. (PEP) becoming one of the top-performing stocks on the market yesterday – its price surged by 7.4%, reflecting strong investor sentiment. What could come next?
Technical Analysis of PEP Stock Chart
A strong bullish candle formed on the chart yesterday, signalling a spike in demand:
→ The session opened with an impressive bullish gap, decisively breaking through the July resistance level around $137.
→ The share price continued to climb steadily throughout the day, forming a long-bodied candle.
→ The session closed near its high, confirming sustained upward momentum.
Notably, on 27 June (highlighted by an arrow on the chart), the stock posted gains on the highest trading volume of 2025 so far (according to Nasdaq data), which can be interpreted as a potential sign of sentiment reversal driven by institutional investors.
However, the broader picture remains bearish. PEP stock continues to trade within a long-term downward channel, shaped by declining demand for PepsiCo products and intensifying market competition.
Given the above, the following scenario should not be ruled out: the upper boundary of the long-term descending channel may act as resistance in the near term. As the post-earnings euphoria fades, the price could undergo a pullback – for instance, towards the $140 level, which previously served as support.
At the same time, the strong fundamental backdrop, reflecting the company’s operational success, could fuel persistent bullish interest. This may empower buyers to challenge and potentially break the long-standing downtrend in PEP shares.
This article represents the opinion of the Companies operating under the FXOpen brand only. It is not to be construed as an offer, solicitation, or recommendation with respect to products and services provided by the Companies operating under the FXOpen brand, nor is it to be considered financial advice.
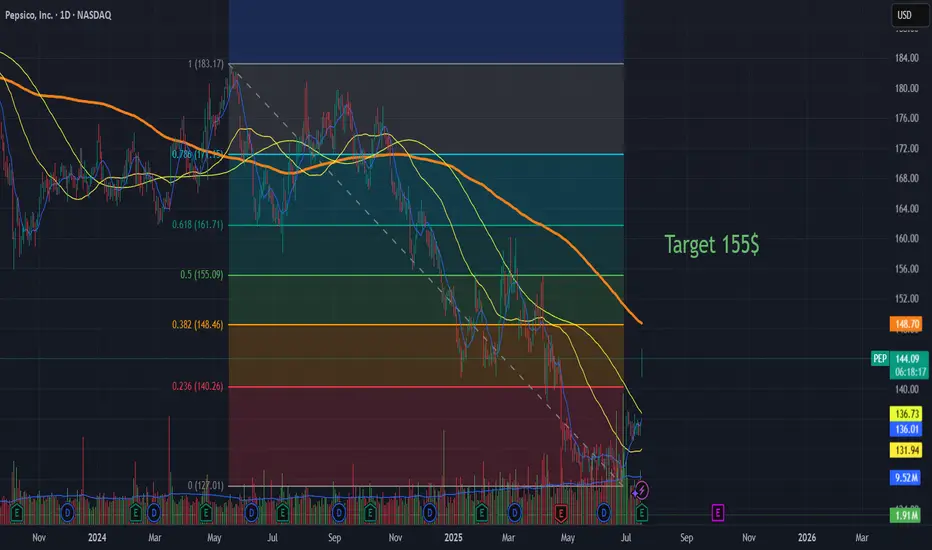
Pepsi can retrace to 155 in short termVery short post:
Pepsi NASDAQ:PEPS had a very good earnings call and based on fb retracement, this will retrace to 155 soon. It has potential to go abive that if the reversal is confirmed.
PEP is in the Wyckoff Accumulation phaseThis Week (July 8 - 12):
Support: The recent consolidation shelf around $130.00 is the first line of defense. The absolute low and our line in the sand is the Selling Climax low at $127.60.
Resistance: The 20-week moving average at $138.30 is the immediate ceiling it needs to break through.
Next Month (July/August):
Support: The $127.60 low remains the critical long-term support.
Resistance: If it can clear the $140 level, the next major area of resistance to watch is around $150.00, a previous support zone that will likely attract sellers.


PEP Long-Term Buy Opportunityhi Traders,
The chart presents a compelling long-term buying opportunity for PepsiCo (PEP). The price is currently sitting in the identified "buy zone", a historically reliable area for accumulation. If we experience further dips, it’s still considered a buying opportunity all the way down to the 200 EMA, which currently sits at $120.62.
Historically, every time PEP’s price approached or touched the 200 EMA on the monthly time frame, it marked a major bottom and a strong reversal point. We believe this time is no different—the long-term trend remains intact and the fundamentals continue to support value.
Additionally, the RSI has reached oversold conditions on the monthly chart, which is rare for this stock and signals a potential undervaluation. Oversold RSI levels have consistently aligned with excellent long-term entry points.
Our target is the previous all-time high (ATH) of $196.48, with expectations to break beyond it as the recovery unfolds. This setup offers a favorable risk-to-reward ratio for long-term investors and swing traders alike.
Summary:
✅ Price in the buy zone
✅ Buying opportunity down to the 200 EMA ($120.62)
✅ Monthly RSI in oversold = undervaluation signal
🎯 Target: Previous ATH and beyond ($196.48+)
Long-term bulls, this is your moment.
Do you agree? Leave your comments!

Update on $PEP: The price finally made its move. Breakout of our Level 0 and confirmed bullish crossover on the daily chart (that is still bearish)
Massive Volume coming.

[PEP] Pepsi investmentI took my first and main position on NASDAQ:PEP just before this little spike.
My target is very high because I want to hold this stock for a while and maybe I will hold even more than what you see on the graph.
Strong confidence for the long run ...
Great Trade !


$PEP Bullish Swing Setup – Oversold & Ready to Rebound ?PepsiCo ( NASDAQ:PEP ) is sitting at a major long-term support after a deep pullback — this could be a strong opportunity for a risk-defined bounce. Here's what the chart is signaling:
🔹 Entry Zone: Price is currently near $128 — a historically significant level that acted as resistance in the past and now aligns with a potential support flip.
🔹 Oversold & Stretched: After a consistent downtrend, NASDAQ:PEP is looking oversold. A bounce is likely as sellers exhaust and dip buyers return at this key level.
🔹 Reversal Structure Building: Early signs of a bottoming pattern are emerging, with potential higher lows forming. If the current structure holds, we could see a climb toward the next resistance zones.
🎯 Targets:
TP1: $154 – minor resistance and previous consolidation zone.
TP2: $197 – major resistance and range high, aligning with earlier highs.
🛡️ Stop Loss: Below $102 — invalidates the support thesis and breaks structure.
💡 Why Price May Rise:
PEP is a defensive name with strong fundamentals, often benefiting during uncertain macro cycles.
Valuation is now more attractive after the sell-off.
The setup offers a high reward-to-risk ratio, especially if broader markets stabilize.
⚖️ Setup Summary:
Entry: ~$128
SL: $102
TP1: $154
TP2: $197
📌 Watching for confirmation with volume or bullish candle structure over the next few sessions.
🚫 Not financial advice — just a technical outlook based on structure and probability.

PEP Earnign call target 158 and 160 The main reason it becuase if we see on the las two quarters on earnings they did not beat the stock has been down -12 percent in 3 months.
Disclaimer- it a opinion

PEP – Bullish Divergence at Weekly DemandPepsiCo (PEP) has retraced into a key weekly demand zone, where price previously launched long bullish legs. At the same time, a bullish divergence is forming between price and RSI, suggesting selling momentum may be weakening.
Structure has clearly shifted bearish over the past two years, with multiple breaks of structure (BoS). However, the current setup shows strong confluence for a potential mean reversion or reversal swing.
Two key supply zones are mapped:
First target (5:1 R:R) at the $141 area — recent supply.
Second target (12:1 R:R) near $162 — major macro supply.

PepsiCo (PEP): At a Critical Long-Term Technical JuncturePepsiCo (PEP): At a Critical Long-Term Technical Juncture - Is the Dip an Opportunity?
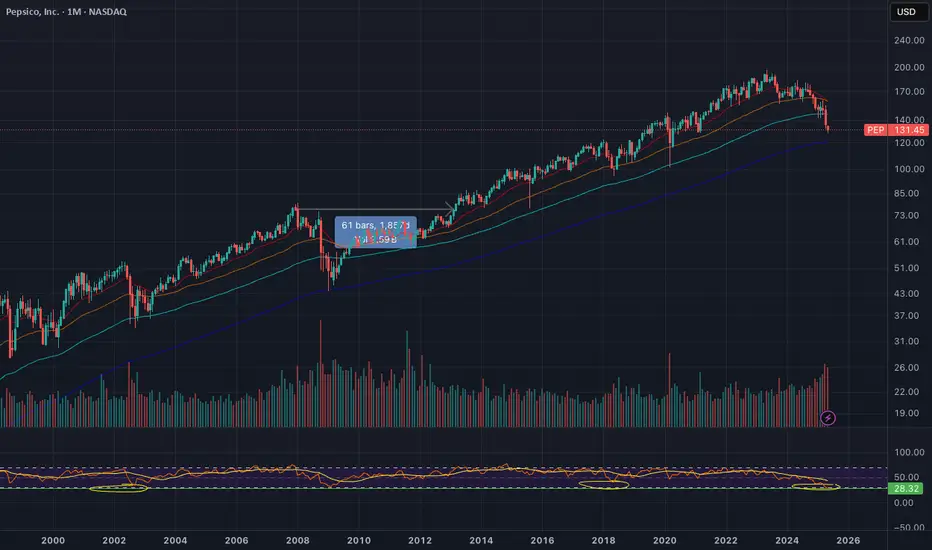
Looking at PepsiCo's (PEP) monthly chart, I observe a remarkably strong and consistent uptrend spanning over 15 years, clearly defined by a robust long-term trendline (light blue diagonal line). This trendline has historically acted as significant support, bouncing the price multiple times (highlighted by blue circles).
Technical Outlook:
The most striking feature of the current chart is that PEP is currently trading right at this crucial long-term trendline, around the
129-130 mark. This level represents a pivotal point.
Potential Support: If this historic trendline holds, it could provide a strong bounce, consistent with its past behavior. The "1st Target 155" zone (former support, now potential resistance) could be a near-term upside target if the bounce materializes.
Critical Breakdown Level: A decisive break below this long-term trendline would signal significant weakness and could open the door for a deeper correction towards the "100 to 110 Very Strong Level," which appears to be a historical consolidation zone providing very strong support.
Fundamental Context:
This technical crossroads coincides with recent fundamental headwinds for PepsiCo, explaining why the stock has pulled back to this significant level from its all-time highs:
Recent Performance & Guidance: The stock retreated from its highs primarily due to its Q4 2023 earnings report, which presented a cautious outlook for 2024 (projecting slower organic revenue growth) and highlighted continued volume declines, especially in North America. This indicated increasing consumer price sensitivity.
Underlying Strength vs. Short-Term Headwinds: Despite these near-term challenges, PepsiCo remains a fundamentally strong company. Its diversified portfolio of iconic snack and beverage brands, global reach, and consistent dividend history make it a defensive powerhouse. The current P/E valuation, after the pullback, is seen as more attractive by many analysts, balancing the slower growth against its stability.
Investor Dilemma: This creates a classic technical-fundamental intersection. For long-term income-focused investors, the current price at a critical support offers a potentially attractive entry point, betting on the company's resilience and the trendline holding. However, those prioritizing short-term growth or concerned about further volume erosion might wait for clearer signs of a rebound or a hold of the trendline.
Conclusion:
PepsiCo (PEP) is at a decisive moment. Its ability to hold the long-term trendline at the current price level will be a key indicator. A successful bounce from here, supported by its strong underlying business fundamentals and attractive dividend yield, could present a compelling long-term opportunity. Conversely, a sustained break below this trendline would necessitate a reassessment of its near-term support levels. Investors should monitor this technical level closely while considering PepsiCo's long-term stability versus its current growth challenges.
Disclaimer:
The information provided in this chart is for educational and informational purposes only and should not be considered as investment advice. Trading and investing involve substantial risk and are not suitable for every investor. You should carefully consider your financial situation and consult with a financial advisor before making any investment decisions. The creator of this chart does not guarantee any specific outcome or profit and is not responsible for any losses incurred as a result of using this information. Past performance is not indicative of future results. Use this information at your own risk. This chart has been created for my own improvement in Trading and Investment Analysis. Please do your own analysis before any investments.

PEP: Long Buy OpportunityPEP is about to touch the 200 Monthly Moving Average. This last 2009.
The RSI is touching less than 30, which last happened in 1973.
PEP is a Dividend King which has increased it's dividend for 53 years. Did Warren Buffett say compounding is the 8th wonder of the world? Oh no, it was Einstein.
Evidence suggests great Long Term BUY opportunity on the price and momentum signals. Compelling.
#PEPSICO (PEP)
PepsiCo: In the Target ZonePepsiCo is currently trading in the middle of our active Long Target Zone (coordinates: $133.53 – $125.10). Although all technical requirements for the correction of wave a in beige have already been met here, we still see some remaining downward potential for the subordinate wave 5 in turquoise within our Target Zone. There's even a 36% chance that the price will fall below our Target Zone as part of the beige wave alt.a , which is relevant for any stop-loss orders and could potentially cause a significant short-term drop. In both our scenarios, however, we expect significant increases after the wave a low.
📈 Over 190 precise analyses, clear entry points, and defined Target Zones - that's what we do.

Great RR trade PEP has been sold off so much, it's down to a huge level daily bullish divergence on the RSI, squeeze is reset, MACD is tight and curling up, bands are tight, it either bounces or gets cooked. My PT is $140 and will be playing June 20 140C. Super excited for this trade, played it back in Feb when it went on that little rip show mid month, sad to say I was out at 150% while a guy I traded this with held runners to 600%. Absolutely worth a stab right now from a technical perspective in my opinion.

PEPSICO 2nd try...First of all I have to say my first thesis was wrong , even though I mentioned Pepsi as a great countercyclical opportunity to usual stocks , it still got sold off together with the whole market. Not only did it make a retracement , it did a full historical retracement in that time , which gives now a grreat opportunity to buy , because now there is a turnaround signal. Pepsico is a company of basic needs , in this case food and so it is a safe product model with low growth potential. The reason it is countercyclical to usual stocks is because the "Big Boys" seek safe havens in times of uncertain markets. We do not only have the issue with uncertain stocks due to Trumps comments , but also uncertain Bonds. Bonds were seen as save havens in case of uncertain stocks but when you have Trump who influences both Big Boys seek differnet investments , such as countercyclical stocks , companies which can survive in bad economical times because they provide basic need such as Pepsico. Of course there are many many other things influencing the stock price not only economical situation but you see this comment is more than long enough already.

Quick View: $PEP(hourly) Consolidation with Bullish Crossover after a drop of 15%
(weekly), still bearish.
This is a very early signal
Watching $133 as key resistance.
Support → $130/$126

PEP - L1 Bullish Weekly Exhaustion SignalNASDAQ:PEP has triggered a level 1 bullish exhaustion signal on the weekly. This signal has triggered 20 times in the stock's history with a 90% win rate and avg move of 8.2% over the following 10 candles.

One Last Chance This is the last chance for Pepsi to bounce on the monthly trendline before I completely close my position on it. It has been getting destroyed for way too long...

PEPSI BUY ZONE!!We have now reached the optimal buy level for Pepsi with good long term projection. Buy this stock and forget.
Our Target will be the previous all-time-high with the high likely good of continuing beyond.

$122 incoming?Pepsi continues to look bearish. But as rates will likely come down towards the end of the year, the safer dividend plays become more attractive. Pepsi offers an attractive dividend yield and is considered a safe business to park money into.
The chart suggests we will head towards the $122 level where there is a confluence of support. I'll patiently wait for a reaction at this level before jumping into the trade.
