Procter & Gamble Could Be StrugglingProcter & Gamble (PG) fell sharply two months ago. Now, after a rebound, it could be struggling.
The first pattern on today’s chart is the big drop on May 18 after Target’s (TGT) weak quarterly report hammered retailers. PG rebounded toward $149 before making a new 52-week low under $130. It then retraced most – but not all – of the drop. The result was a slightly lower high below the late-May pivot.
Next, the stock hit resistance at its falling 50-day simple moving average (SMA). Notice the candlesticks with high tails July 6-13, showing an inability to close above the SMA. It’s also back below its 21-day exponential moving average (EMA), another sign of a downtrend.
Third, stochastics are dropping from an overbought status.
TradeStation has, for decades, advanced the trading industry, providing access to stocks, options, futures and cryptocurrencies. See our Overview for more.
Important Information
TradeStation Securities, Inc., TradeStation Crypto, Inc., and TradeStation Technologies, Inc. are each wholly owned subsidiaries of TradeStation Group, Inc., all operating, and providing products and services, under the TradeStation brand and trademark. You Can Trade, Inc. is also a wholly owned subsidiary of TradeStation Group, Inc., operating under its own brand and trademarks. TradeStation Crypto, Inc. offers to self-directed investors and traders cryptocurrency brokerage services. It is neither licensed with the SEC or the CFTC nor is it a Member of NFA. When applying for, or purchasing, accounts, subscriptions, products, and services, it is important that you know which company you will be dealing with. Please click here for further important information explaining what this means.
This content is for informational and educational purposes only. This is not a recommendation regarding any investment or investment strategy. Any opinions expressed herein are those of the author and do not represent the views or opinions of TradeStation or any of its affiliates.
Investing involves risks. Past performance, whether actual or indicated by historical tests of strategies, is no guarantee of future performance or success. There is a possibility that you may sustain a loss equal to or greater than your entire investment regardless of which asset class you trade (equities, options, futures, or digital assets); therefore, you should not invest or risk money that you cannot afford to lose. Before trading any asset class, first read the relevant risk disclosure statements on the Important Documents page, found here: www.tradestation.com .
4PG trade ideas

PG - Ripe for an upside. Consumer staples FTWPotential cup and handle information and we have a two strategies approach to it. One is to play on the breakout of the resistance at US$147.44 and wait for a retracement back to the demand zone at US$139.22

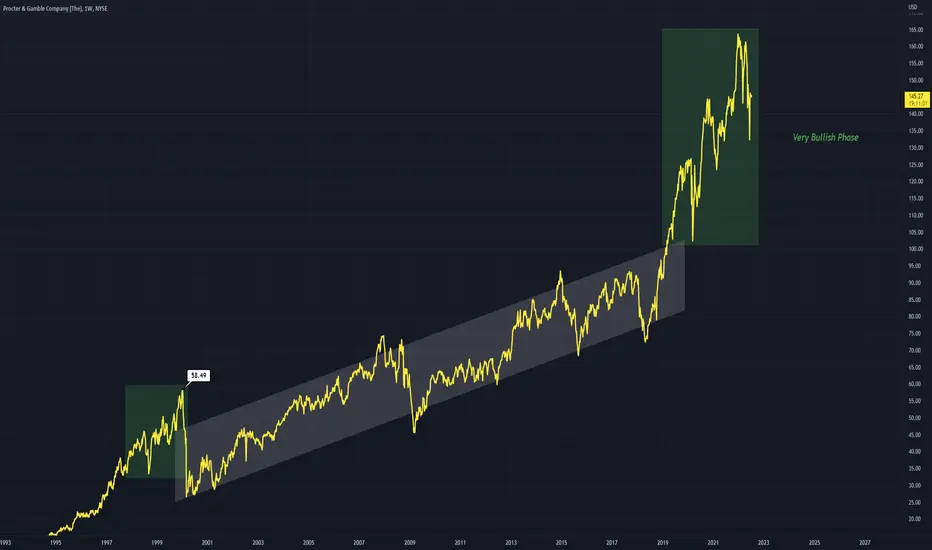
PG - Non Log AnalysisComparative bullish phases, strong movement upward but in a staggered fashion
Following this is a large up channel
Non Log chart
PG sitting on good support shelfPG was green today while the market and most stocks sat red. Shelf could act as good bounce zone. I'd like to see 140 hold if there is short term downside.

Inverted H and S on PG?I like this possible inverted H and S. Nice retest and bounce of the RTG a few days ago.

PG looks to be break out soonWith interest rates going up, and people shunning away from high growth tech, semi stocks and into more of defensive stocks is a bullish environment for NYSE:PG . Now with a solid chart with strong technicals has made me add more at these levels as I put my around 505 cash back to work

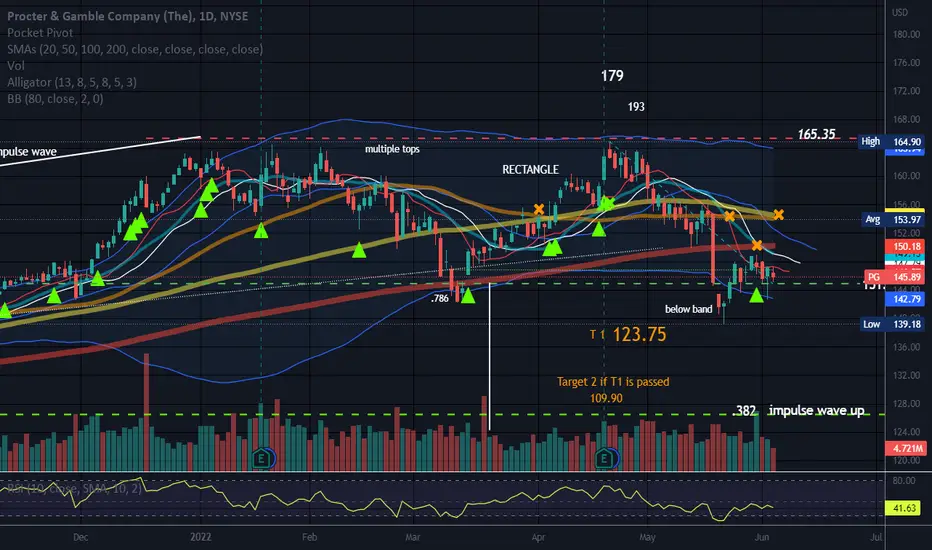
Rectangle Top//Rising Wedge//OUCH!Major sell off in progress.
Ugly red candles with a bunch of sellers inside.
PG fell from a rectangle top and sellers have been brutal.
The 50% retracement of the last trend up is not far below.
Price is below the bands and oversold. This condition can last for extended periods of time, especially in a bear market.
Price looks stretched to the down side. Selling may exhaust soon.
Rising Wedge noted inside of the rectangle top. The Rising Wedge is a bearish pattern that begins wide at the bottom and contracts as prices move higher and the trading range narrows. It is different from a symmetrical triangle as both trendlines slope up. Rising wedges have a bearish bias and are not valid until the bottom trendline is broken. Price can break to the upside from a rising wedge, but in the end which can sometimes be months or years, this trendline is broken.
Rising Wedges during the bull market would barely break the bottom trendline or even break the upper trendline and continue to the upside. In this market, they appear to be a bit more dangerous as when price falls as of late, there is so much resistance overhead and panic selling seems more likely to occur. The Rising Wedge can send a security in to a free fall in a bear market.
It looks like price is due for a bounce up very soon as price is very stretched to the downside. Even sellers exhaust eventually.
Possible short after bounce up if it occurs.
There is a lot of resistance overhead.
No recommendation.
Is the selling justified? I guess it is what it is.

RectangleRectangles are neutral until a trendline is broken with a Confirmed trend in that direction.
Targets above rectangle are for a break to the upside with the larger type being T1, and the smaller type is T2 is target 1 is broken.
Orange type below rectangle are possible targets if it breaks to the downside.
No Recommendation/Neutral until a trendline is broken with conviction.
Analysis-downtrendHere as you see on the chart we will have a big probability of a downtrend.thanks.

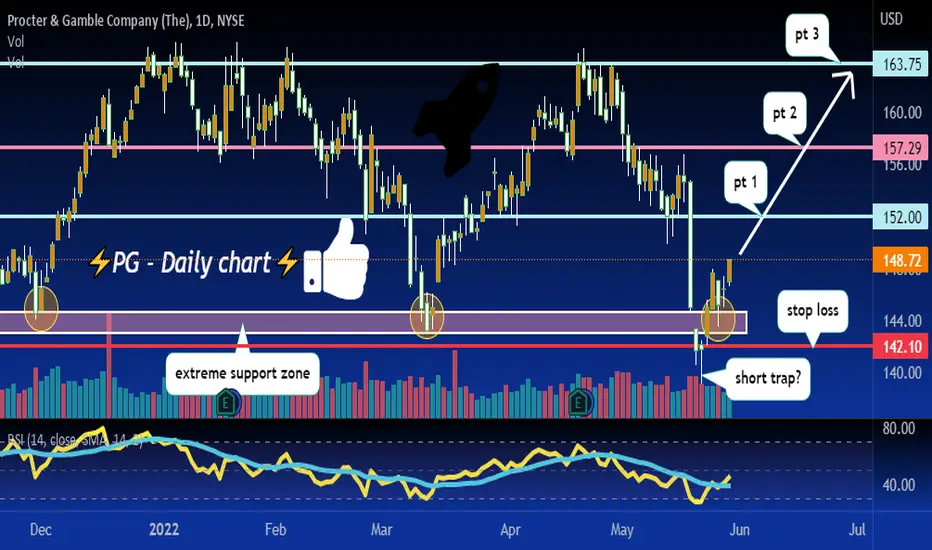
short traps, thats the stuff I do like! 🚀seems like we are ready to rally after a short trap on the most recent break below support, potential targets are 152-159.58-163.75
PG Hello friends! now let 's analyze the PG company my Wyckoff Line indicator, which you can access and which clearly defines the liquidity zone of professionals , as well as with which you can determine the liquidity zones and, accordingly, understand where the accumulation is .
Where is the distribution absolutely clearly and determined the repulsion from the liquidity zone at the very bottom
You can also see that I recently made a deal on the chart , this mark is marked with the mark b 1 ,
which also absolutely clearly indicated the purchase before the decline
On the right we see the relative strength index , which shows that at the moment the company is still in a negative moment relative to the market and it is not yet ripe for purchase at the moment and we must definitely wait until the price reaches the liquidity zone , after which we will already look at the relative strength index and certainly by sector
Thank you all
Click like subscribe necessarily if the review came in! Then I will post more ideas .
My chat of learning and analysis Wyckoff Analytics search in chats and subscribe
Friends, I conduct training in an individual format and in a limited number of students, since a large number will interfere with my trading!
The training course includes :
The Wyckoff Method
Demark method
VSA
A trading method tailored to your psychotype
Psychology of trading
For details, write in a personal message
I can also introduce you to my own unique indicators , of my own design
Wykoff Zone (You determine the activity and zones of smart money and also gives buy and sell signals )
is a Demark indicator that has no analogues on the platform - since most of the indicator are far from the essence of the Dymerka technique and are too simplified , which violates the basics of the principle
For investors, I can shift a 2-week lazy investor course where you can learn how to invest correctly and in which stocks + the tic-tac-toe method
supplemented
with your own developments taking into account the imbalance of supply and demand

PG rebounded. Consumer staples ftw PG rebounded with a tweezer bottom and a piercing line candle. However, we expect some resistance at US$157.02 region.

Long scalp PGBased on its uptrend, rebound from support and a familiar chart pattern confirmed by my technical indicators, I expect at least half a percent in profits IF PG exceeds today's high of $156.76 during tomorrow's session.

$PG for long term?$PG robust 10% organic growth is bolstered by higher prices and sales volume, especially the price due to inflation. Lately, the stock has been down-trending for the past few days reacting to overall market sentiment. in terms of technical analysis, the stock might continue to trend down based on historical patterns and indicators. if you look at the 4hr chart it seems that the stock is just make a breakthrough just above the 200MA but still looking bearish.. As the market slowly shifts to a cyclical rotation, most investors are looking for defensive stocks like basic needs, health care and energy.
Below is my target for entering and exiting for PG.
Day trade or scalp target play: 04/227/22
Buy call above 157.51 sell at 159.23 or above.
Buy puts below 153.25 sell at 152.26 or below.
option open interest: ideal expiration date: (risky) 06/17/22, 7/15/22
Hello everyone,
Welcome to this free technical analysis . ( mostly momentum play )
I am going to explain where I think this stock might possibly going the next day or week play and where I would look for trading opportunities
for day trades or scalp play.
If you have any questions or suggestions on which stock I should analyze, please leave a comment below.
If you enjoyed this analysis, I would appreciate it if you smash that LIKE button and maybe consider following my channel.
Thank you for stopping by and stay tune for more.
My technical analysis is not to be regarded as investment advice. but for general informational proposes only.

PG is Bullish!PG sets to complete its inverse head & shoulder formation which would shoot the price to an ATH. It is the best time to make an entry now with the formation of Bullish Harami Candle.
Also, Bullish Divergence, ABCD pattern and retracement of price from 0.5 Fib level supports the idea.
Entry - 156
Target - 165
Stoploss - 153
Disclaimer: Not a financial advise. Do your own due diligence.

V BottomPossible stop under a pocket pivot or where you see support.
Earnings in July.
Long entry level is a level above resistance and is often used as a level to enter the security at or above this level, unless already in the security.
PG has met targets for the ABC Bullish pattern.
No recommendation
Support levels, trendlines and patterns can fail.

$PG with a Bullish outlook following its earnings #Stocks The PEAD projected a Bullish outlook for $PG after a Positive Under reaction following its earnings release placing the stock in drift A with an expected accuracy of 71.43%.

analysis on PGAs we see on this graph we have a big probability of downtrend so we have a breakout of the support line and the vwap indicator.

Proctor & Gamble PG - Yet Another Lovely Short SetupPG approaches my short zone. Risk/reward is looking excellent.

ABC BullishPG is fighting resistance the last few days and it may knock price down a notch. Support and resistance levels are often broken or the market would be ranging all the time (o:
Long candle wicks (TOPS) can show a struggle with resistance. Long candle tails can show price reaching for support.
Hopefully PG has completed it's fall from the ugly top.
I have noted over the years that the old reliable stocks pull back on a positive day for growth stocks.
This also looks like a make shift Inverse head and shoulders bottom.
No recommendation.
EPS (FWD)
9.99
PE (FWD)
24.70
Div Rate (FWD)
$5.52
Yield (FWD)
2.24%
Short Interest
0.81%
Market Cap
$185.34B

PG is breaking outCrossed the 50 & 200 SMA and current markets conditions favour consumer staple stocks.

Inside bar with the main trend.Buying the main trend looking to make around 15-16% return over the next few months.

$PG in the up side?$PG just close above the ema lines last friday showing some possible momentum move.
recently PG got downgraded to neutral by two agencies due to inflation. but the downgrade
is not bad. average move per of PG is about 1.50-2.00+
Day trade or scalp target play: 04/04 /22
Buy call above 155.49 sell at 156.35 or above.
Buy puts below 154.32 sell at 153.56 or below.
option open interest expiration date: 4/14/22 or 5/20/22 expiration.
Hello everyone,
welcome to this free technical analysis . ( mostly momentum play )
I am going to explain where I think this stock is going to go over the next day or week play and where I would look for trading opportunities
for day trades or scalp play.
If you have any questions or suggestions which stock I should analyze, please leave a comment below.
If you enjoyed this analysis, I would definitely appreciate it, if you smash that LIKE button and maybe consider following my channel.
Thank you for stopping by and stay tune for more.
My technical analysis is not to be regarded as investment advice. but for general informational proposes only.
