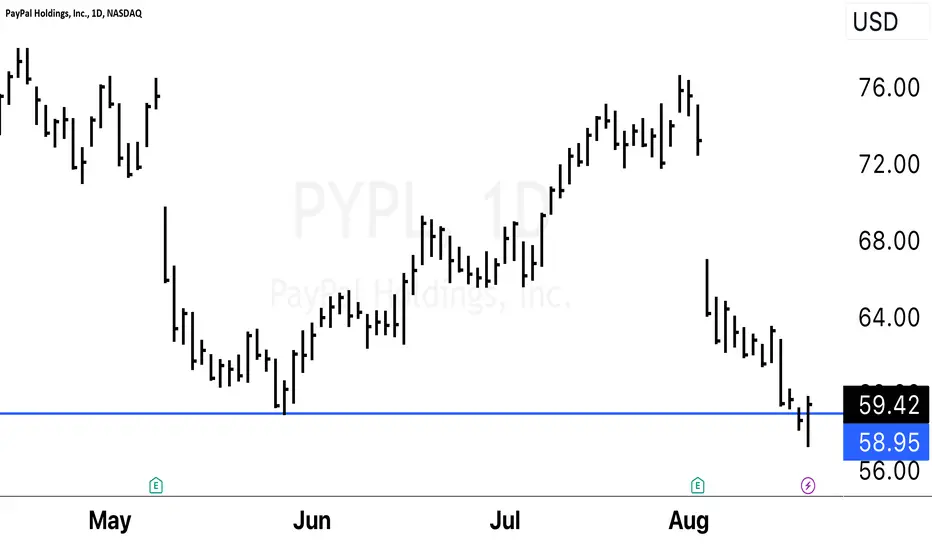
resistance = support, my favorite pattern! 😇PYPL trend resistance from FEB 2023 has now acted support on multiple occasions, first on July 7th which resulted in rally from 66 to 76.
Now today we are seeing the second time trend resistance is acting as support.. bounce here and break of 66.93 then we can target 74-78 resistance zone 🎯
boost and follow for more.. thanks 💛
4PYPL trade ideas

Long the AB=CD Here's a good general rule for things that go hyper parabolic and then crash.
-They'll typically come down 80 - 90%.
- The crash will typically end after spiking out where the parabolic phase begins.
Once these have happened, there's speculative value long and extreme warnings for shorts.
PYPL has these conditions in place and also has an AB=CD into the current price.

PYPL Bullish Trend Reversal aheadNASDAQ:PYPL 4H candles shows lower lows, while Momentum making higher lows - this is a sign for a possible trend reversal.
This idea is supported by looking at the RSI - it was oversold and now starts rising again.
Profit target is the monthly pivot point at around 72.76

Symmetrical triangle hereYou know what it means, a good company, good results, waiting for a CEO (Elon Musk maybe) making that part of the 20 years plan for X, but, we have that Symmetrical triangle with a potential 60% in the next months, and two huge falling wedges., Why PYPL have now a crypto?, the answer is X!

$PYPL Double Bottom Bullish closeNASDAQ:PYPL Double Bottom Bullish close
It sounds like you're discussing technical analysis concepts in the context of trading. A "double bottom" is a bullish reversal pattern that occurs after a downtrend and is characterized by two consecutive lows at a similar price level, followed by a breakout above the pattern's neckline. This pattern suggests a potential reversal from the downtrend to an uptrend.
A "false breakdown" occurs when a price breaks below a support level but quickly reverses and closes back above it. This can be interpreted as a bullish sign, indicating that the selling pressure wasn't sustained, and buyers stepped in to push the price back up.
The idea that "the best moves come from failed moves" is a common adage in trading and investing. It suggests that when a market or a security initially breaks out or breaks down and then reverses, it can lead to strong price movements in the opposite direction. This is often attributed to the idea that traders who were positioned on the wrong side of the initial move are forced to close their positions, contributing to the momentum in the opposite direction.
It's important to note that while these concepts are commonly discussed in trading circles, they are not foolproof strategies. Technical analysis is just one approach to understanding price movements in financial markets, and it should be used in conjunction with other forms of analysis and risk management strategies. Markets can be unpredictable, and there is no guarantee that any pattern or signal will always lead to a profitable outcome.
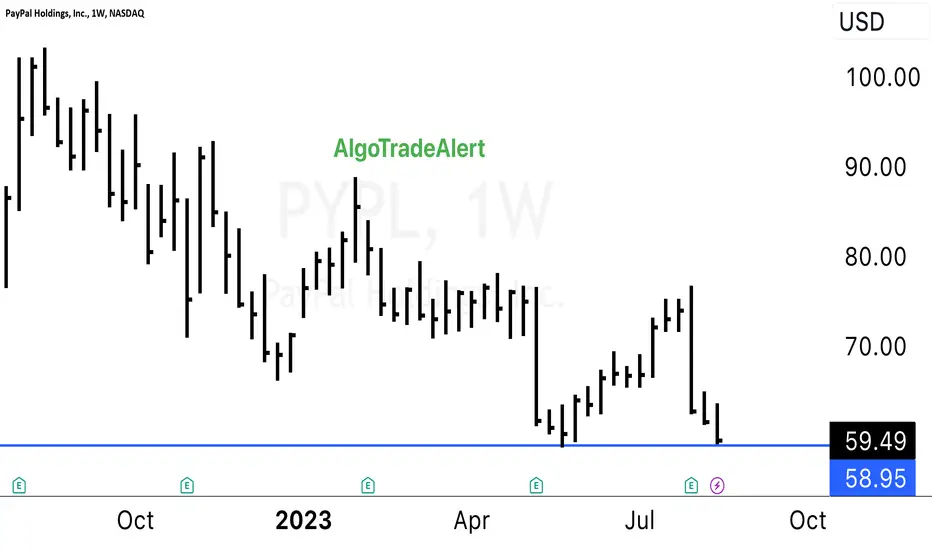
Hope at last for PayPal? Falling wedge in sightIt has been a very, very rough past 2 years for $PYPL. After seeing highs of $300+ in July of 2021, the stock sits at a staggering 59.42 after seeing absolutely no recovery from the recent market bull run.
But, there may be some hope…
Although the company is currently facing many different issues, it’s not like PayPal is going away anytime soon. When was the last time you used PayPal or a service connected with PayPal? Can garuntee you’ve had some connection with it in the past 24hrs shopping online.
With that all being said, it appears we may have a falling wedge pattern forming, bullish. If this pattern does play out, would first target $100 and then see if the stock can pull off a full recovery. This of course also depends on the overall market direction…
I personally do like this stock though long term and believe a recovery should be coming soon.
paypal possible longPaypal is one of the stock that have been under pressure lately.
Possible 1w bull div .Still nearly 1 hour to close.

PayPal : Going long as planned The detailed analysis is already posted. Connecting that analysis underneath. Do check that out.

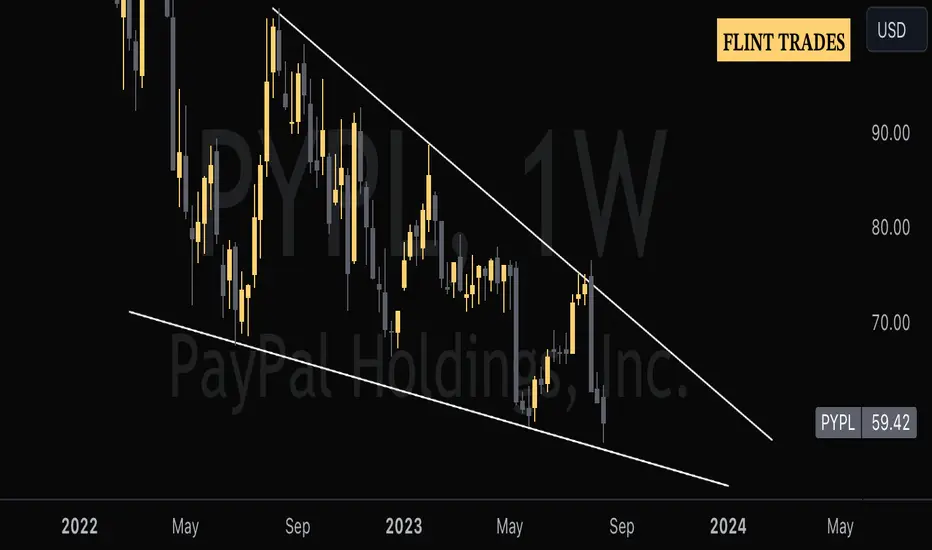
PayPal : A value buy and the reward is worth the riskTechnicals :
From a pattern perspective, from April 2022 onwards, each time a major low was created, there was some sort of descending channel formation. Now it is a case of pattern inside a pattern and we can see the same formation even inside the internal pattern.
I did take two entries at two major inflection points and the market rallied after both of them. But I didn't book any profits since I'm in it for the long game. Now the price is coming back to create a third inflection point.
So I'll be taking a third and final entry in this levels expecting a high probability for a rally to at least the start of the larger descending channel, which is a move of about 60% from the current levels. The total allocation after this entry will sum up to 2.5% of my portfolio.
But I also do consider the possibility for the price to not hold on to this level and crash further along with the broader market. If that happens 45 to 47 USD will be a level, which I'll consider adding on, depending upon the fundamentals and technicals at that time. There is a gap to be filled at those levels.
Fundamentals :
Pros :
- Revenue and profitability is increasing.
- There is good enough cash flow.
- A large user base who trust the company with their services.
- PayPal owns Venmo which is very popular among youngsters and the brand has become a verb.
- Elon Musk has this idea to make x.com an all in one app and integrate payment services in it. So there is a possibility that in future Elon might even considering taking over PayPal since he also has a history with the company.
Cons :
- Highly competitive sector since major giants also offer payment services like Apple Pay, G Pay, Amazon Pay, Shopify Pay etc.
- Effective September 27, 2023, senior Intuit executive Alex Chriss will become PayPal’s president and CEO, replacing current CEO Dan Schulman. Need to see how the new management is going to run the company and what major changes will be implemented from here on.
Closing Statement :
I believe that all the cons mentioned herewith are already factored in to the current valuation and hence at current levels PayPal is a value buy. I will update when I make any changes in my positions, underneath this post.

Buy PYPL @ 73-74 Buy PYPL at 73–74. with a stop loss at 56.95. This trade has a positive risk-reward ratio.

Long Term Trade With PYPLPayPal is one of the best stocks to hold for the long term as they just got a new CEO and made a crypto coin.
My wave targets are:
Wave 1: 103
Wave 2 79-83
Wave 3: 175
Wave 4: 140
Wave 5: 225
One of the most bullish long terms stocks there is.

$pypl heading to $51NASDAQ:PYPL The next support is at $51. If that support level breaks then NASDAQ:PYPL will dip further.

PYPL | 200DMAStuck right below 200DMA, few attempts to break. Highly likely it will break, will depend on earnings next week. Look out for breakout.

PayPal Long?PYPL has been a slow grinder lower. Each time it gains momentum it somehows manages to lose it.
The only positive thing about this chart is the long divergence that is occurring between price & RSI.
When will this divergence bear fruit? Anyone's guess but you do have it on the daily, Weekly & Monthly time frame.

$PYPL PayPal Double BottomThe main reason why I like NASDAQ:PYPL PayPal it has a Double Bottom another one of the reasons why I am starting a small starter position is because Jim Cramer hates the stock.
1. Business Model:
PayPal is a leading digital payment platform that offers a range of online financial services, enabling individuals and businesses to make payments, transfer money, and conduct transactions electronically. It serves as a bridge between buyers and sellers in the digital marketplace.
2. Revenue Streams:
PayPal generates revenue primarily through transaction fees charged to merchants for processing payments, as well as fees for certain value-added services. These services include PayPal Business Solutions, Venmo (a peer-to-peer payment platform), and Xoom (a digital money transfer service).
3. User Base and Market Reach:
PayPal boasts a vast user base, with its services available in more than 200 countries and supporting multiple currencies. The platform is widely used by consumers, businesses, and merchants for various online financial transactions.
4. Acquisitions and Diversification:
PayPal has strategically acquired several companies to diversify its offerings and expand its market presence. Notable acquisitions include Venmo (a social payments platform), Braintree (a payment gateway), Xoom (a digital money transfer service), and Honey (a browser extension that helps users find discounts and deals).
5. Strong Partnerships:
PayPal has formed strategic partnerships with major e-commerce platforms, payment processors, and financial institutions. These collaborations enhance the reach and convenience of its services, as well as drive transaction volume.
6. Mobile-Centric Approach:
Recognizing the increasing reliance on mobile devices, PayPal has invested in creating user-friendly mobile applications for seamless mobile payments and money transfers. Its subsidiary, Venmo, has become especially popular among younger users for peer-to-peer payments.
7. Financial Performance:
PayPal's financial performance has shown consistent growth over the years. The company's revenue and net income have been steadily increasing, driven by the growing adoption of online and mobile payments, as well as expansion into new markets and services.
8. Innovation and Technology:
PayPal remains at the forefront of financial technology innovation. The company has explored blockchain technology and cryptocurrencies, allowing users to buy, hold, and sell select cryptocurrencies through their PayPal accounts.
9. Regulatory and Compliance Considerations:
Operating in the financial services industry, PayPal is subject to various regulatory and compliance requirements. Adhering to these standards is essential for maintaining trust and securing user data.
10. Competitive Landscape:
The digital payment industry is highly competitive, with players like Square, Stripe, and traditional financial institutions vying for market share. PayPal's ability to innovate, adapt to changing trends, and offer seamless user experiences contributes to its competitive advantage.
In summary, PayPal is a pivotal player in the digital payments landscape, offering a wide range of services that facilitate online transactions and money transfers. Its user base, partnerships, technological innovation, and strategic acquisitions have propelled its growth and solidified its position in the industry. However, like any company, PayPal faces challenges related to competition, regulatory changes, and cybersecurity. Staying ahead of these challenges through continuous innovation and customer-focused services will be crucial to its sustained success.
$PYPL clear break-away gapNASDAQ:PYPL Elliott Wave Analysis
We clearly have a break-away gap that is pinpointing to wave 3 of 3.
So that gap is in fact middle of the impulse wave down.
We have completed wave 4 in my opinion and now we are in wave 5.
Once wave 5 is done expect for an abc correction up.
What do you think? Are you a buyer or a seller here?
Legal Disclaimer: The information presented in this analysis is solely for informational and educational purpose and does not serve as financial advice.

💥 $PYPL Drop: What Every Trader Needs to Do NEXT!Analysis:
As Macro PVVM and Micro PVVM decline, the close price of NASDAQ:PYPL also drops from 73.43 to 59.47. This decline corresponds to the bearish momentum shown by both metrics.
The sharpest price drop occurs between 2023-08-02 and 2023-08-03, where the close price goes from 73.2 to 64.18, corresponding to a significant drop in both Macro and Micro PVVM values.
The sharp decline and move into negative territory signals a strong bearish movement. The last value is considerably negative, indicating a strong downward pressure.
Critical Points for Traders:
Yesterday, NASDAQ:PYPL reaches an oversold position in the Micro PVVM, which can signal a potential bounce back or reversal in the short term.
Traders should watch the Macro PVVM as well. If it crosses below 0, it could be a confirmation of a bearish long-term trend.
Proposed Trade Strategy:
Short-Term Traders: Given the strong bearish momentum in the Micro PVVM, traders might have already taken a short position. However, as it's reaching an extreme oversold condition, traders should be prepared to take profits as a bounce back or a reversal is possible.
Price Prediction for the Next 7 Bars:
Depending on the strength of the rebound, the price may stabilize or continue its decline if no significant bullish momentum is observed.
In numerical terms, we might expect the close price to move in a range between 55 to 65 until EOW (end of week), with potential spikes depending on the market sentiment.

$PYPL - Can we bounce?NASDAQ:PYPL has dropped 22% from its recent high, wiping out all of its gains since June.
If you are one of those who are saying "I missed the boat," well now is your chance. 😂
The current price level of $59 needs to hold, or else we will see a further breakdown. There are no strong support levels below. We could even see the price check back to the lower trend line somewhere around $52-51.
There is also a gap around $45.
Here are the support levels that I am watching for a potential reversal:
$59.64 (current support)
$51-52
$46
$45 (the worst case)
I will post an updated chart once I see the reversal.
Good luck bulls. We need it. Let's pray that it bounces tomorrow and never looks back.
Like and follow me for more charts.

HOOD vs PYPL, almost identical chartsLooking at all the indicators Set Up for both charts, although they are at different price points they're almost all in Sinc so you'd think they're the same chart but PayPal is a little bit more advanced. I'm thinking there could be a double play here if PayPal moves first and then you can flip the gains into Hood shortly afterwards. Need to keep a close eye on both as they're still both pretty bearish but looking like they could bounce after a brief consolidation period. Looking for an entry point.

PYPL | Buy the Fear!!! | LONGPayPal Holdings, Inc. operates a technology platform that enables digital payments on behalf of merchants and consumers worldwide. The company provides payment solutions under the PayPal, PayPal Credit, Braintree, Venmo, Xoom, PayPal Zettle, Hyperwallet, PayPal Honey, and Paidy names. Its payments platform allows consumers to send and receive payments in approximately 200 markets and in approximately 150 currencies, withdraw funds to their bank accounts in 56 currencies, and hold balances in their PayPal accounts in 25 currencies. The company was founded in 1998 and is headquartered in San Jose, California.

Possible Support of PYPLPYPL has been crushed recently and has not participated in the most recent tech squeeze. Accumulation maybe taking place and a short term bounce to resistance is possible. Not financial advice.

PAYPAL ALL TIME HIGH!! - PYPLI have observed similar chart patterns on numerous occasions (please refer to the comment section for an analysis of the Psychology of a Market Cycle).
The stock experienced a notable decline following the Q2 earnings. At present prices, there is a possibility of witnessing a rebound and potential gap fill. However, this might be followed by another downward movement, potentially testing or even breaching the 52-week low, before subsequently regaining momentum.
Considering PayPal's Stablecoin Strategy, along with their earnings growth and the anticipated $5 billion in total share repurchases during the second half of 2023.
The question is whether or not you have the patience to stick it out until then.

Paypal bullish divergencePaypal isn't performing well. Previously PYPL was downtrending, but the Relative Strenght Index (RSI) is showing regular bullish divergences forming. Long term we expect the price to rise 185 %.
FInal target would be 174 USD.
