QCOM doughAnalysis done on 25/05/2020
Fundamental
→ 20 & 40 SMA sloping up
→ 20MA > 40MA
→ Low of daily bar touches 20MA or goes below 20MA
→ Close above 40MA
Awaiting buy trigger
→ CCI <-100
Pull trigger
→ Buy 1 bid above previous day high
→ Sell 5 bars later exclusive of initial bar
Stop Loss
→ 50% below price bought
4QCOM trade ideas

Anybody believe in this trade?Let me know what you think?
___________________▄▄▄▀▀▀▀▀▀▀▄
_______________▄▀▀____▀▀▀▀▄____█
___________▄▀▀__▀▀▀▀▀▀▄___▀▄___█
__________█▄▄▄▄▄▄_______▀▄__▀▄__█
_________█_________▀▄______█____█_█
______▄█_____________▀▄_____▐___▐_▌
______██_______________▀▄___▐_▄▀▀▀▄
______█________██_______▌__▐▄▀______█
______█_________█_______▌__▐▐________▐
_____▐__________▌_____▄▀▀▀__▌_______▐_____________▄▄▄▄▄▄
______▌__________▀▀▀▀________▀▀▄▄▄▀______▄▄████▓▓▓▓▓▓▓███▄
______▌____________________________▄▀__▄▄█▓▓▓▓▓▓▓▓▓▓▓▓▓▓▓▓▓▄
______▐__________________________▄▀_▄█▓▓▓▓▓▓▓▓▓▓_____▓▓____▓▓█▄
_______▌______________________▄▀_▄█▓▓▓▓▓▓▓▓▓▓▓____▓▓_▓▓_▓▓__▓▓█
_____▄▀▄_________________▄▀▀▌██▓▓▓▓▓▓▓▓▓▓▓▓▓__▓▓▓___▓▓_▓▓__▓▓█
____▌____▀▀▀▄▄▄▄▄▄▄▄▀▀___▌█▓▓▓▓▓▓▓▓▓▓▓▓▓▓▓__▓________▓▓___▓▓▓█
_____▀▄_________________▄▀▀▓▓▓▓▓▓▓▓█████████████▄▄_____▓▓__▓▓▓█
_______█▓▓▓▓▓▓▓▓▓▓▓▓▓▓▓█▓▓▓▓▓██▓▓▓▓▓▓▓▓▓▓▓▓▓▓▓██▄▄___▓▓▓▓▓█
_______█▓▓▓▓▓▓▓▓▓▓▓▓▓▓▓█▓▓███▓▓▓▓████▓▓▓▓▓▓▓▓▓▓▓▓▓██▓▓▓▓▓▓█
________█▓▓▓▓▓▓▓▓▓▓▓▓▓▓█▓█▓▓██░░███████░██▓▓▓▓▓▓▓▓▓▓██▓▓▓▓▓█
________█▓▓▓▓▓▓▓▓▓▓▓▓▓▓██▓░░░░░█░░░░░██░░░░██▓▓▓▓▓▓▓▓▓██▓▓▓▓▌
________█▓▓▓▓▓▓▓▓▓▓▓▓▓▓███░░░░░░░░____░██░░░░░░░██▓▓▓▓▓▓▓██▓▓▌
________▐▓▓▓▓▓▓▓▓▓▓▓▓▓▓██░░░░░░░________░░░░░░░░░██████▓▓▓▓▓█▓▌
________▐▓▓▓▓▓▓▓▓▓▓▓▓▓▓██░░░░░░___▓▓▓▓▓░░░░░░░███░░███▓▓▓▓▓█▓▌
_________█▓▓▓▓▓▓▓▓▓▓▓▓▓██░░░░░___▓▓█▄▄▓░░░░░░░░___░░░░█▓▓▓▓▓█▓▌
_________█▓▓▓▓▓▓▓▓▓▓▓▓▓█░░█░░░___▓▓██░░░░░░░░▓▓▓▓__░░░░█▓▓▓▓██
_________█▓▓▓▓▓▓▓▓▓▓▓▓▓█░███░░____▓░░░░░░░░░░░█▄█▓__░░░░█▓▓█▓█
_________▐▓▓▓▓▓▓▓▓▓▓▓▓▓█░█████░░░░░░░░░░░░░░░░░█▓__░░░░███▓█
__________█▓▓▓▓▓▓▓▓▓▓▓▓█░░███████░░░░░░░░░░░░░░░▓_░░░░░██▓█
__________█▓▓▓▓▓▓▓▓▓▓▓▓█░░░███████░░░░░░░░░░░░░░_░░░░░██▓█
__________█▓▓▓▓▓▓▓▓▓▓▓▓█░░░███████░░░░░░░░░░░░░░░░░░░██▓█
___________█▓▓▓▓▓▓▓▓▓▓▓▓█░░░░███████░░░░░░░░░░░█████░██░░░
___________█▓▓▓▓▓▓▓▓▓▓▓▓█░░░░░░__███████░░░░░███████░░█░░░░
___________█▓▓▓▓▓▓▓▓▓▓▓▓▓█░░░░░░█▄▄▄▀▀▀▀████████████░░█░░░░
___________▐▓▓▓▓▓▓▓▓▓▓▓▓█░░░░░░██████▄__▀▀░░░███░░░░░█░░░
___________▐▓▓▓▓▓▓▓▓▓▓▓█▒█░░░░░░▓▓▓▓▓███▄░░░░░░░░░░░░░░░______▄▄▄
___________█▓▓▓▓▓▓▓▓▓█▒▒▒▒█░░░░░░▓▓▓▓▓█░░░░░░░░░░░░░░░▄▄▄_▄▀▀____▀▄
__________█▓▓▓▓▓▓▓▓▓█▒▒▒▒█▓▓░░░░░░░░░░░░░░░░░░░░░____▄▀____▀▄_________▀▄
_________█▓▓▓▓▓▓▓▓▓█▒▒▒▒█▓▓▓▓░░░░░░░░░░░░░░░░░______▐▄________█▄▄▀▀▀▄__█
________█▓▓▓▓▓▓▓▓█▒▒▒▒▒▒█▓▓▓▓▓▓▓░░░░░░░░░____________█_█______▐_________▀▄▌
_______█▓▓▓▓▓▓▓▓█▒▒▒▒▒▒███▓▓▓▓▓▓▓▓▓▓▓█▒▒▄___________█__▀▄____█____▄▄▄____▐
______█▓▓▓▓▓▓▓█_______▒▒█▒▒██▓▓▓▓▓▓▓▓▓▓█▒▒▒▄_________█____▀▀█▀▄▀▀▀___▀▀▄▄▐
_____█▓▓▓▓▓██▒_________▒█▒▒▒▒▒███▓▓▓▓▓▓█▒▒▒██________▐_______▀█_____________█
____█▓▓████▒█▒_________▒█▒▒▒▒▒▒▒▒███████▒▒▒▒██_______█_______▐______▄▄▄_____█
__█▒██▒▒▒▒▒▒█▒▒____▒▒▒█▒▒▒▒▒▒▒▒▒▒▒▒▒▒█▒____▒█▓█__▄█__█______▀▄▄▀▀____▀▀▄▄█
__█▒▒▒▒▒▒▒▒▒▒█▒▒▒████▒▒▒▒▒▒▒▒▒▒▒▒▒▒▒█_______█▓▓█▓▓▌_▐________▐____________▐
__█▒▒▒▒▒▒▒▒▒▒▒███▒▒▒▒▒▒▒▒▒▒▒▒▒▒▒▒▒▒█▒_______█▓▓▓█▓▌__▌_______▐_____▄▄____▐
_█▒▒▒▒▒▒▒▒▒▒▒▒▒▒▒▒▒▒▒▒▒▒▒▒▒▒▒▒▒▒▒▒▒█▒▒_____█▓▓▓█▓▓▌__▌_______▀▄▄▀______▐
_█▒▒▒▒▒▒▒▒▒▒▒▒▒▒▒▒▒▒▒▒▒▒▒▒▒▒▒▒▒▒▒▒▒▒███████▓▓█▓▓▓▌__▀▄_______________▄▀
_█▒▒▒▒▒▒▒▒▒▒▒▒▒▒▒▒▒▒▒▒▒▒▒▒▒▒▒▒▒▒▒███▒▒▒▒▒▒▒██▓▓▓▓▓▌___▀▄_________▄▀▀
█▒▒▒▒▒▒▒▒▒▒▒▒▒▒▒▒▒▒▒▒▒▒▒▒▒▒▒▒▒██▒▒▒▒▒▒▒▒▒▒▒▒▒█▓▓▓▓▓▀▄__▀▄▄█▀▀▀
█▒▒▒▒▒▒▒▒▒▒▒▒▒▒▒▒▒▒▒▒▒▒▒▒▒▒▒▒█▒▒▒▒▒▒▒▒▒▒▒▒▒▒▒▒██▓▓▓▓██▄▄▄▀
█▒▒▒▒▒▒▒▒▒▒▒▒▒▒▒▒▒▒▒▒▒▒▒▒▒▒▒█▒▒▒▒▒▒▒▒▒▒▒▒▒▒▒▒▒▒▒████
█▒▒▒▒▒▒▒▒▒▒▒▒▒▒▒▒▒▒▒▒▒▒▒▒▒▒█▒▒▒▒▒▒▒▒▒▒▒▒▒▒▒▒▒▒▒▒▒█
_█▒▒▒▒▒▒▒▒▒▒▒▒▒▒▒▒▒▒▒▒▒▒▒▒▒█▒▒▒█▒▒▒▒▒▒▒▒▒▒▒▒▒▒▒▒▒▒█▄▄▄▄▄
_█▒▒▒▒▒▒▒▒▒▒▒▒▒▒▒▒▒▒▒▒▒▒▒▒█▒▒▒▒█▒▒▒▒▒▒▒▒▒▒▒▒▒▒▒███▒▒▒▒▒▒██▄▄
__█▒▒▒▒▒▒▒▒▒▒▒▒▒▒▒▒▒▒▒▒▒▒▒█▒▒▒▒█▒▒▒▒▒▒▒▒▒▒▒▒███▒▒▒▒▒▒▒▒▒▒▒▒▒█▄
__█▒▒▒▒▒▒▒▒▒▒▒▒▒▒▒▒▒▒▒▒▒▒▒█▒▒▒▒█▒▒▒▒▒▒▒▒▒▒▒█▒▒▒▒▒▒▒▒▒▒▒▒▒▒▒▒▒▒█
__█▒▒▒▒▒▒▒▒▒▒▒▒▒▒▒▒▒▒▒▒▒▒▒█▒▒▒▒█▒▒▒▒▒▒▒▒▒██▒▒▒▒▒▒▒▒▒▒▒▒▒▒▒▒▒▒▒▒█
___█▒▒▒▒▒▒▒▒▒▒▒▒▒▒▒▒▒▒▒▒▒▒█▒▒▒▒█▒▒▒▒▒▒▒▒█▒▒▒▒▒▒▒▒▒▒▒▒▒░░░░▒▒▒▒▒▒▌
____█▒▒▒▒▒▒▒▒▒▒▒▒▒██▒▒▒▒▒▒▒█▒▒▒▒█▒▒▒▒▒▒█▒▒▒▒▒▒▒▒▒░░░░░░░░░░░░░▒▒▌
____█▒▒▒▒▒▒▒▒▒▒▒▒▒▒▒█████████████▒▒▒▒▒█▒▒▒▒▒▒▒▒░░░░▒▒▒▒▒▒▒▒▒▒▒░▒▌
_____█▒▒▒▒▒▒▒▒▒▒▒▒▒▒▒▒▒▒▒▒█_______▐▒▒▒▒█▒▒▒▒▒▒▒░░░▒▒▒▒▒▒▒▒▒▒▒▒▒▒▒░▌
______█▒▒▒▒▒▒▒▒▒▒▒▒▒▒▒▒▒▒▒█________█▒▒█▒▒▒▒▒▒░░░▒▒▒▒▒▒▒▒▒▒▒▒▒▒▒▒▒▒▌
_______█▒▒▒▒▒▒▒▒▒▒▒▒▒▒▒▒▒▒█________█▒█▒▒▒▒▒▒░░░▒▒▒▒▒▒▒▒▒▒▒▒▒▒▒▒▒▒▒▌
________█▒▒▒▒▒▒▒▒▒▒▒▒▒▒▒▒▒▒█________█▒▒▒▒▒▒░░▒▒▒▒▒▒▒▒▒▒▒▒▒▒▒▒▒▒▒▒█
_________█▒▒▒▒▒▒▒▒▒▒▒▒▒▒▒▒▒▒█________█▒▒▒▒░░▒▒▒▒▒▒▒▒▒▒▒▒▒▒▒▒▒▒▒▒█
_________█▒▒▒▒▒▒▒▒▒▒▒▒▒▒▒▒▒▒█________█▒▒▒░░░░░░░▒▒▒▒▒▒▒▒▒▒▒▒▒▒█▀
__________█▒▒▒▒▒▒▒▒▒▒▒▒▒▒▒▒▒▒█_______█▒░░░▒▒▒▒▒░░░░░░░░▒▒▒█▀▀▀
___________█▒▒▒▒▒▒▒▒▒▒▒▒▒▒▒▒▒▒█_______█░▒▒▒▒▒▒▒▒▒▒▒▒▒░░░░█▀
____________█▒▒▒▒▒▒▒▒▒▒▒▒▒▒▒▒▒▒█_______█▒▒▒▒▒▒▒▒▒▒▒▒▒▒▒█▀
_____________█▒▒▒▒▒▒▒▒▒▒▒▒▒▒▒▒▒▒█_______█▒▒▒▒▒▒▒▒▒▒▒▒█▀
_____________█▒▒▒▒▒▒▒▒▒▒▒▒▒▒▒▒▒▒▒█_______▀▀▀███████▀▀
______________█▒▒▒▒▒▒▒▒▒▒▒▒▒▒▒▒▒▒▒█
_______________█▒▒▒▒▒▒▒▒▒▒▒▒▒▒▒▒▒▒▒█
________________█▒▒▒▒▒▒▒▒▒▒▒▒▒▒▒▒▒▒▒█
_________________█▒▒▒▒▒▒▒▒▒▒▒▒▒▒▒▒▒▒▒█
__________________█▒▒▒▒▒▒▒▒▒▒▒▒▒▒▒▒██▒█
___________________█▒▒▒▒▒▒▒▒▒▒▒▒▒██▒▒▒▒█
___________________█▒▒▒▒▒▒▒▒████▒▒▒▒▒▒▒█
___________________█████████▒▒▒▒▒▒▒▒▒▒▒█
____________________█▒▒▒▒▒▒▒▒▒▒▒▒▒▒▒▒▒▒▒█
____________________█▒▒▒▒▒▒▒▒▒▒▒▒▒▒▒▒▒▒▒█
_____________________█▒▒▒▒▒▒▒▒▒▒▒▒▒▒▒▒▒▒░▌
_____________________█▒▒▒▒▒▒▒▒▒▒▒▒▒▒▒▒▒▒░▌
______________________█▒▒▒▒▒▒▒▒▒▒▒▒▒▒▒▒░░▌
_______________________█▒▒▒▒▒▒▒▒▒▒▒▒▒▒░░█
________________________█▒▒▒▒▒▒▒▒▒▒▒░░░█
__________________________██▒▒▒▒▒▒░░░█▀
_____________________________█░░░░░█▀
_______________________________▀▀▀▀
I JUST WANTED TO TRY IF I CAN EMBED A GIF HERE:

QCOM - Changing direction?QCOM created a nice bottoming pattern inv. H&S
the only thing is price hasn't broke above neckline resistance at 81.8
posting for tracking for the next few days


$QCOM On Breakout Watch
Possible entry level on break of resistance @ $81
Upside targets as high as $89 short term.
Major downtrend may also be the neckline of inverse H&S

QCOM PUTTso this is my simple analysis on QCOM. I would go for a putt position because the price had broke the trendline and make a retracement on the breakout level. The red horizontal line will be the stoploss for this trade while the support level below will be the take profit zone. Thank you so much . Follow me .

QCOM - strong company, heavy buying volume today, good supportEntered a long position here today - feel like this one will reverse pretty good along with overall QQQ

QCOM Inverted cup and handleQCOM breaking down of an ascending wedge, retesting the previous support, was rejected pretty handedly.
I would expect it to bounce off the .382, and get rejected again, forming a head and shoulder, inside of a handle, to complete the cup and the handle in higher time frames.


QCOMtrading in the channel. Held 20 MA today. MACD turning bearish, if it breaks down channel could fall to 50 MA.

QCOM: Key levels and test-driving a new indicatortest-driving my new "VolumeViewer" using QCOM - to find key supply / demand balance levels.
the key balance levels are found either as the VV crosses 0, or when it changes direction and they usually correspond to S&R levels for the underlying.
note: i'm long QCOM and looking for opportunities to add to position.

Riding on the wave of 5G technologyQualcomm is well positioned to benefit from the 5G technology. It has good partnership with Apple to launch 5G phone sets. Once the 5G phone launch by Apple in its usual September product launch is announced, we can expect this stock together with Apple will soar higher.
I will be nibbling some to ride on the trend as it has good prospects in the future.

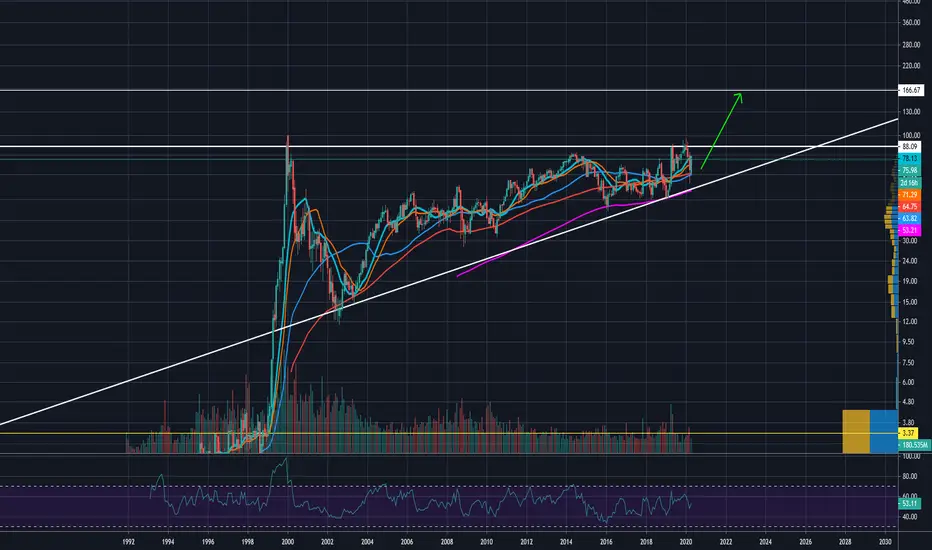
QCOM close to huge breakoutQCOM looks very close to breaking out of a 20 year consolidation a monthly close over 88 would confirm this.Target is 166 or higher.
Qcom prediction We can see breakout form trend line if the candle close above the trend line thus a long position is prefer.
TP and SL are shown in the diagram
Do always use trailing profit
If you like my analysis do like and comment below whether you agree or disagree from my analysis and do follow me. As I regularly post the prediction on all major forex currency pairs,gold,bitcoin,and stocks like Tesla
Note this is not a trading advice and I am wrong 100%


short to buy level at weekly timeframe by put option to $50short to buy level at weekly timeframe by put option to $50
QCOM Short Supply zone Confirmed Condition:
1. Supply zone Confirmed
2. Up trendline break (TLB)
Entry at 72.5 (below 73)
Stop: 75 (Above trend line)
Target1: 65; risk/reward=1:4
Target2: 60; risk/reward=1:6
This is a trading school homework. I need 6 months to practice trading plan.
If you like it, thank you for your support. Please use SIM/Demo account to try it, until my trading plans get high winning rate.

Will it stay above or below the line? There seems to be two different resistance lines going on at the moment. Let's see if it can stay above the first or it could likely drop to the second very quickly

QCOM trade and the (Fisherman) setupTook a long position today on QCOM , and it worked well. entry point was $75, and the first target is $83.6, with a possibility that i just hold it for a long term (I like QCOM for the 5G motion)
i wanted to share this trade cause it's a classic example of a setup that i call "the fisherman" - and while it's very easy to learn and use, it can provide high probability trades.
here's how the fisherman works...
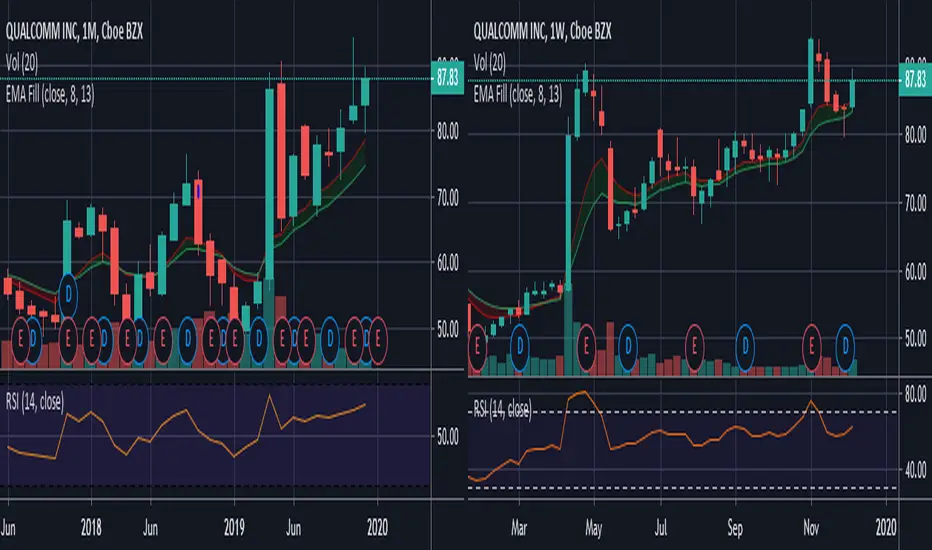
- first we need to look at a Renko chart - you can see from the dual view here how super easy it is to see the signals on a Renko vs a regular bar or candle chart - Renko is a real secret weapon -- maybe we talk more about that in future posts
- on the price chart, i have the MagicWave - ignore the Wave (aqua/orange) line, the other lines are a 10sma (purple) and a 30ema (blue) -- easy to add to the chart individually. the main one we need is the 30ema
- on the lower panel there's my own version of the Balance Of Power - but you can use the Dual RSI indicator that i published before. why we need this? cause it shows momentum for 2 periods, a fast and a slow - and that's important for the signal we want to see. use a fast length of 5 (yes we want this to be really fast) and a slow length of at least 6 to 8 times the fast - we don't want the slow length to be "too sensitive".
how does the fisherman setup work? what signals do we look for:
1- the price will cross the 30ema going up (the yellow circle), at the same time, both the fast and the slow momentum (RSI) will go positive (as in the yellow box)
2 - the price will retrace back towards the 30ema then will bounce off the 30ema (the green circle), and at the same time, the 30ema will start moving up creating a bottom - the shape in our green circle looks like a "hook" - that's the fisherman's hook :)
3 - super important, while the price is doing "the hook", the fast momentum moves down, maybe even into the negative zone, *but* the slow momentum remains green - the setup fails if the slow momentum also goes negative - we need to have a positive "backdrop" that shows there's a prevailing commitment to the upside
4 - The Entry: you're the fisherman, you have the hook, and now you need to "catch" an entry as low as possible for maximum profit - yes, we will be "bottom fishing" here :). in today's trade, i got lucky and caught the $75.
5 - The Position: once in the trade, we set the target and exit loss .. and back to our regular programming :)
i hope some find this useful - practice the fisherman setup and add it to your arsenal of possible setups or even as a way to validate your good trades and entries
(the fisherman can also be used in catching a good entry for a short, the hook will be the other way around. see if you can identify the 2 other fisherman setups on QCOM since the beginning of March - zoom our the Renko as needed)
good luck!..


Waiting for the support or oversold RSIWaiting until the dead cat finish its bounces to buy QCOM on the support or the RSI touches the oversold range

Saham syarikat QCOMQCOM kod bagi syarikat QUALCOMM Inc yang diperbuat dari segi sektor Teknologi. Mengikut pemerhatian gelombang sahlun tentang saham ini adalah downtrend@bearish dengan penurunan sebanyak 16.20% dalam tempoh 3 bulan lepas. Dari segi Syariah, saham ini adalah Patuh Syariah
