Flag Flutters Precariously: Navigating the Sky of Greed.The Siemens flag, once a symbol of ambition, now hovers in the sky of opportunistic buyers. Previously, it was plummeting toward the ground, but a swarm of butterfly-like buyers, armed with unwavering determination, managed to lift it back up using a sturdy candlestick.
However, in this latest turn of events, the flag now hangs precariously between two vast voids, abandoned by the overconfident grip of greedy crab buyers. Their hold appears too weak to keep the flag aloft, and it seems destined to fall from the lofty height of 214 euros—ironically referred to as the "golden level of the crab." It seems that gravity, much like the harsh reality of the market, inevitably prevails.
4SIE trade ideas

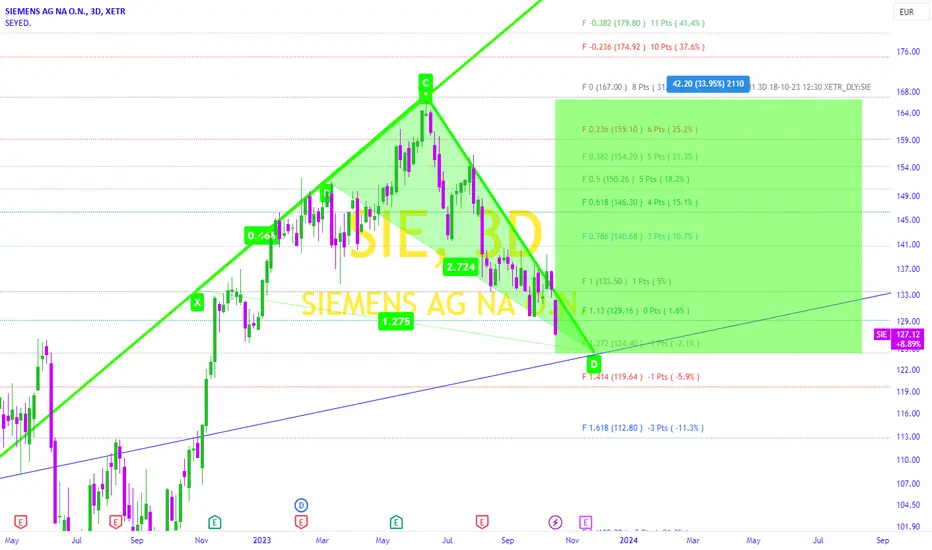
Effort of the Young Green Butterfly to Raise the Siemens Flagthe detail is shown in the above Chart.
I made this Idea based on Candlestick Analysis and Fibonacci Tool .
The Buyers' Crab could reach the highest point at the price of 167 euros.
The Bearish trend started and siemens flag is falling and approaching to the golden level of buyers crab .
The past trend of sellers' candles has formed a motivated green butterfly pattern
So we can expect this young Butterfly to raise the Siemens flag again.
Siemens Is Great .
Good luck.
Short, target 184.9Following Siemens in daily chart.
I am mostly bearish in German stocks. For Siemens, I got a weekly short call o Monday and today a short call again in daily chart.
TP1 188.6
TP2 186.2
TP3 184.9 - my main target.
You can stop above 195 daily candle close.

parallelChannel+Fib0.61: Siemensnice HH-HL forming at monthly level, curent price level is close to HL, 0.61 fib level and at monthly support. seems nice setup to trade with good R:R


[S-004] Siemens AGIdea number S-004 | Siemens stock could fall toward support in the 126/124 EUR area.
The setup is negative, the stock is trading below the 20-day and 50-day moving averages. The MACD is negative and below its signal line. The RSI is trading below 30. This could mean that the stock is in a sustained downtrend or that it is simply oversold and therefore a rebound could take shape. In that case I would protect a possible bearish position with a tight stop loss on the pivot point as I show below:
📉 Short Entry at 134.8 EUR
💰 Take Profit at 124 EUR
💸 Stop Loss at 140 EUR

Siemens ,,, Buy opportunity Uptrend
It's a breakout and as you see the trend is favorable for getting a buy position be setting SL at a good place. Next target can be about 157 .


SIE // Inverted shoulder head shoulder formationAlthough there is an inverted shoulder head shoulder formation on the chart, pay attention to the wedge resistance in the weekly time frame. Targets are determined according to Fibonacci.

#SIEMENS long idea (+25%?)Hello dear Traders,
Here is my idea for #SIE
Price closed above yellow line (previous month high)
Price closed above purple trigger line to enter trade.
Targets marked in the chart (black lines)
Invalidation level marked with red line
Good luck!
❤️Please feel free to ask any question in comments. I will try to answer all! Thank you.
Please, support my work with like, thank you!❤️

Trading Idea - #SiemensAGMy trading idea for Siemens AG - SHORT
Target: EUR 89.00 (profit potential 12%)
The Siemens AG share is in an intact downward trend. In mid-June, there was a sharp drop below the support level of 114.00 EUR. The resistance around the EUR 109.00 mark was then confirmed several times. The next historical support at EUR 89.00 is expected to be targeted.
Like the entire industry, Siemens is also expected to be slowed down by weakening demand and an unfavourable price-cost ratio.
Analysts estimate a profit decline of up to 20% for 2023.

Long SiemensI am long on XETR:SIE
- 61.8% Retracement on the Weekly
- Supply & Demand zone
- Upcoming eanrings 11 Aug
entry @ $100
SL @ $98
TP @ 110
@Hendry2005


siemens FALLING WEDGESiemens is actually not a buy, there is a risk it will make a move till 120€, which could be buy area...


Short term bet that Siemens will fall from hereSiemens looks a bit overbought and so does the DAX, fingers crossed.

Long Entry Prediction SIE 20-07-2021Long entry for SIE predicted by our AI algorithm. The time horizon of the prediction is approximately 5 days.

place sell stop orderchannel breakout and pullback set an excellent opportunity for sell stop below resistant/support zone.

Siemens AG (SIE)This is one of the largest and best managed companies in the world. Over the last few years, the company has transformed itself significantly, dividing the management of many of the related companies and it is now branding itself as a digital technology company focused on factories and urban infrastructure. The Digital Industries division is already Siemens’ largest by sales, and operates at the highest profit margin. We believe that the support level of 120,00 euro, as shown in chart, is indeed a good entry point for a medium and long term investment, also considering the interesting dividend yield of 2.6%.

SIE Daily TF ConsiderationsOn the daily time frame, SIE adheres to a rising wedge pattern. The chart shows higher highs and higher lows with bearish divergence on MACD and RSI. Volume seems stable but leans on the stagnant side as well. There's also a gap to be filled at 125€ to 130€. The stock can also be considered overvalued from a financial/business standpoint (e.g. see Morningstar's or Sven Carlin's analysis) and Siemens is certainly not a sexy growth stock.
On the positive side, we're still within the channel and above the 200 MA. A bounce could happen from here towards the 145€ to 150€ region since price still respects the channel and has rejected lower levels multiple times. However, it's not a buy in my book at this level because of the poor risk reward ratio since the price could break down at any point now. Selling at these levels without confirmation is also a poor decision since I expect support at the 200 MA where the gap is to be filled.
For now this stock goes onto the watchlist. If it makes another push towards 150€, it's a sell at that point. If the wedge pattern breaks down now, a short term buy at the 200MA could be an interesting proposition before the wedge is retested for a larger breakdown of structure (levels to be determined at that point).

Siemens can go till 117 no buySiemens is actually not a buy, there is a risk it will make a move till 117€, which could be buy area...
So actually i am bearish with Siemens stock for the short term.
