$T owns DirecTV, what more do you need to know?Idea is that some of their investments are performing poorly and it isn't because of COVID but due to a changing world. Target is based on month of acquisition approval of DirecTV, $24.20
See here for FA:
Timeframe for trade: I am hoping for U.S. elections to accelerate downfall, will keep an eye for HLs
4T trade ideas


TBased on my analysis:
1. T at a support level 27.25 USD & formed hammer .
2. Stochastic shows price in oversold region.
3. I expect T will going up to 28.90 USD.
4. Overall, MA 20,50 & 200 indicate T in downtrend.
Syeikh Hafiz
Stock Market Analyst


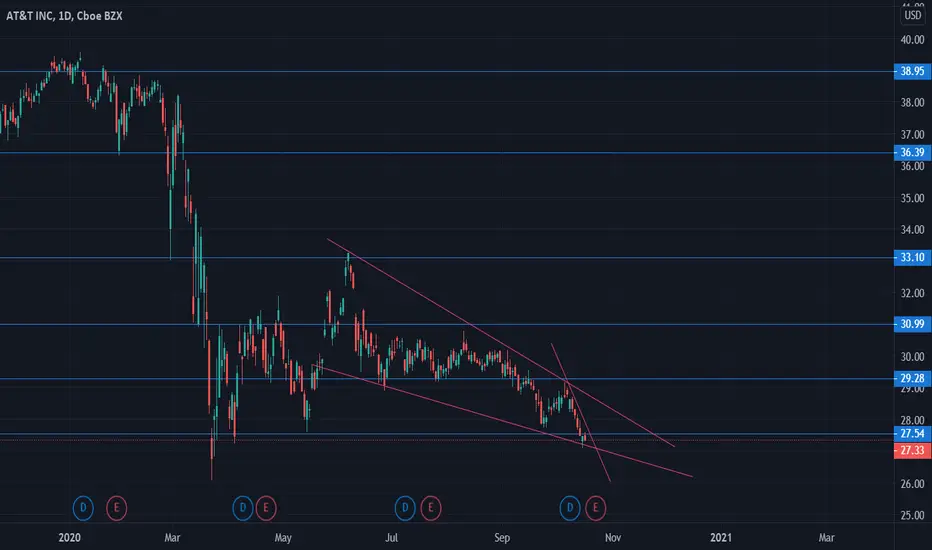
LONG STANDING TRENDLINE LOOKIN TO BE BREACHED? Looks like selling volume is falling, tapping the long running trend line support. I do feel like we are going to retest the lows again for sure. I do not feel optimistic about returning to this trend line again any time soon. I'm normally not very bearish and I do hold maybe a percent or two in AT&T . SO we shall see.
Hope y'alls families are safe and you guys are doin well.
Any tips or insight is greatly appreciated as I am not a financial advisor, and have only been learning for a few years now.


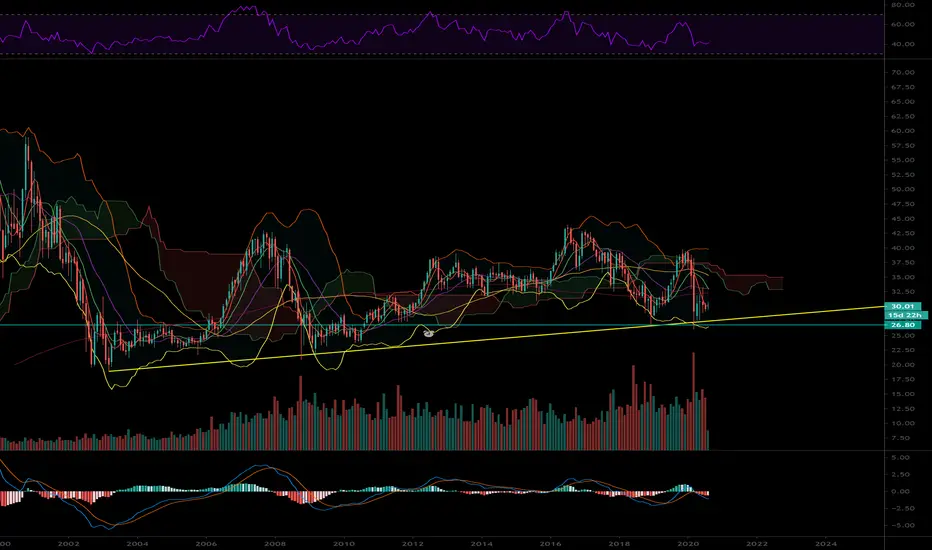
T - AT&T buy support zones analysisHello traders,
Description of the analysis:
AT&T corp. ( T ) support zones ideal for timing long positions (gray). Trade what you understand, trade carefully and sparingly according to the business plan.
About me:
Hi, my name is Jacob Kovarik and I´m trading on stock exchange since 2008. I started with a capital of 3000 USD. My first strategy was based on OTM options. (American stock index and their ETF ). I´ve learnt on my path that professional trading is based on two main fundaments which have to complement each other, to make a bussiness attitude profitable. I´ve tried a lot of techniques and many manners how to analyze the market. From basic technical analysis to fundamental analysis of single title. My analytics gradually changed into professional attitude. I work with logical advantages of stock exchange (return of value back to average, volume , expected volatility , advantage of high stop-loss, the breakdown of time in options, statistics and cosistent thorough control of risk). At the moment, my main target is ITM on SPM index. Biggest part of my current bussiness activity comes from e mini futures (NQ, ES). I´m trader of positions. I´m from Czech republic and I take care of a private fund (over $4.000.000 USD). During my career I´ve earned a lot of valuable experience, such as functionality of strategies and what is more important, control of emotions. Professional trading is, in my opinion, certain kind of mental training and if we are able to control our emotions, accomplishment will show up. I will share with you my analysis and trades on my profile. I wish to all of you successul trades.
Jacob


T is still on saleNow only if our economy could recover like AT&T stock.
Looks like when it's on sale, it doesn't stay on sale long! But at these levels it appears to still be on sale today.
First profit exit - 30.15
It may be worth it to perpetually hold some T cuz did i mention 7+% dividends?


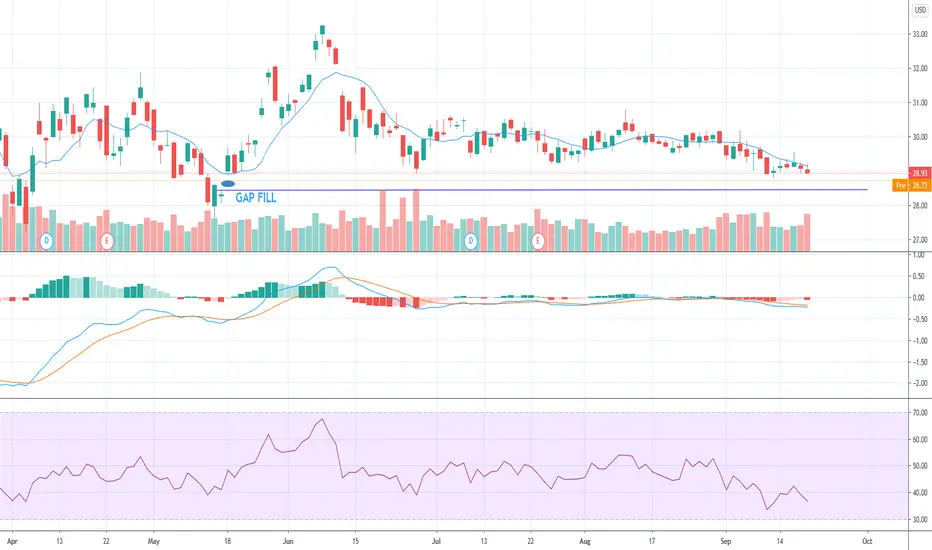
AT&T showing signs of bottiming outLooks like there may be another day or two to fill the gap but it is showing signs of bottoming out. Looking at reversal soon. I am long at this time, (this is a long trade with a time period of 1 year)
AT&T break!About to break - up or down?
The thing about AT&T is that the technical analysis alone doesn't paint the full picture. AT&T is on the fed's balance sheet. It cannot lose, so basically it's just on sale right now, and a perfect opportunity to buy. I'm predicting a breakout. Afterall, if it breaks down, it gets propped up. There's never been a time like this - the normal rules don't apply.


AT&T Moving south in the near future?AT&T looks to be fighting trending resistance, and is further being pressured out of its horizontal channel, falling out of the 28.92/30.04 price range. A light friday candle, arguably a doji, will not hold up this slight move in price northward. Good volume, however, and RSI Indicator suggesting a possible reversal off the 28.92 support. The question - Will it hold?
The current trend says no - 8 EMA is now acting as resistance as well, and the last several weeks are pushing it south. Put/call volume ratio is 1.43, with put volume exceeding call volume. What's hard to tell, imo, is this - is this hedging volume, straddle/strangle strategies?
I do believe, as in the recent past, this opens/pushes bull initially then falls bear. My top 2 strategies;
$T (29.00) 28 P 09/18 0.08
Strategy #1 - Limit/market buy 0.08
OR
$T (29.00) 28.50 P 09/18 0.15
Strategy #2 - LIMIT Buy @ 0.08, thinking
this will open and run north to 29.26,
dropping premium to my limit buy 0.08
Strategy #2 fulfills 3 things - a great discount toward a put buy, a better put strike position, being 0.50 closer to underlying price and better delta!!
*Let's see what happens*
DISCLAIMER - I am not a professional trader. These are merely my thoughts and possible moves; i enjoy watching these stocks validate my process or slap me across the face lol. If you are in need of professional assistance with your trades, don't look here. I am not that guy.


T giving you chance to accumulate here.Will start buying here in the low 29's and add in the low 28's


Trade 6: $T Calls30 - $0.16 T $30.50 calls for 8/21
Rules:
1. No earnings plays (post earnings )
2. No increasing/averaging down, use a stop loss of 20-30%
3. Charting based on triangles/ wedges and SMAs (sitting on all the SMAs , rising RSI , MACD ready to make a move)
4. At the money/near the money (check)
5. Risk/reward 1/3 or greater (next week cheap calls, but stock doesn't move much, need a quick 2-3% move in the next few trading days)
6. Buy 45 days out approx. (the way I trade, I may need to scrap this and work on timing of the purchase of the contract)
7. After the first week, get out and reassess if it still hits all these criteria (will update likely to a few days based on my trading habits, we'll see)
Trade 1: BA call $250 to $480 ($130 net)
Trade 2: ARMK call $435 to 435 ($0 net - still $480 principal)
Trade 3: MGM call $435 to $315 ( -$120 - $360 principal)
Trade 4: WFC call $354 to $255 ( -$99 -$261 principal)
Trade 5: GOOS call $85 to $280 ($195 - $541 principal)
Trade 6: T calls $480 to ....
Bought too early in the day, poor price compared to what I could buy now, but GOOS turned around next day maybe this will as well
