7/22/25 - $tmo - Probably top 10 HC name on my "buy" list7/22/25 :: VROCKSTAR :: NYSE:TMO
Probably top 10 HC name on my "buy" list
- as HC (healthcare) stonks are at multi-year lows and basically everyone is bearish - positioning is important to account for when calling stock inflections
- i'd say... here's a pick and shovel name that has great FCF yields, better than utilities (4%+) but more like a consumer staple (also staples trade 2-3.5%) and not *really* exposed to consumer
- yea i "get" the negative bias here
- but the setup is that if result is simply "not bad" and speech is "not bad" you'll probably see this as a "haven" within HC bid and possibly HC becomes a safe haven bid to higher multiple tech/ meme cht names
- so +ve reaction i'd guess
V
4TMO trade ideas

$TMO, Long, TP>15-25%NYSE:TMO , Long, TP>15-25%
Fundamentally the stock is good.
Choose an entry point and do not forget about a protective order if you are trading with leverage.
Don't risk it if you're not sure.
Good luck to everyone.

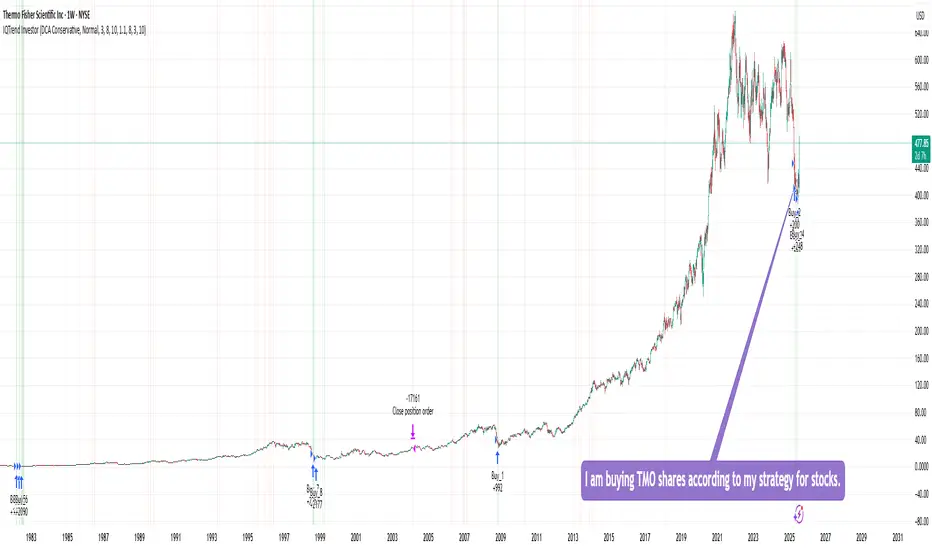
Buying TMO sharesI am buying TMO shares according to my strategy for stocks, ETFs, and precious metals.
This strategy shows 100% performance on this stock on a weekly timeframe. Therefore, I am investing a small percentage of my deposit in it and will wait for it to perform. I hope that everything will work out this time too :)
Of course, the price may go even lower, but I will buy more if the strategy shows a buy signal. In the long run, I think there will be an excellent profit.
DYOR
TMOclearly oversold, waiting for buy signal. first target would be VWAP around 436. this is also right where a massive volume shelf is...

3 Oversold Stocks Poised for a Rally – MAS, IQV & TMOBelow is today’s SmartApingAI snapshot of three highly oversold names showing early signs of a rebound. Scroll down for a quick refresher on each company’s fundamentals, key technicals, and what makes them attractive at current levels.
1. Masco Corp ( NYSE:MAS )
What They Do:
Masco designs, manufactures and sells a broad range of home-improvement and new-construction products, including faucets, cabinets, hardware, coatings and architectural products.
Customers:
• Homeowners tackling renovation projects
• Professional contractors and builders
Income Source:
Primarily through the sale of mid-range to premium fixtures, cabinetry systems and paint/coatings.
Geographic Footprint:
• ~85% North America
• ~15% Europe
Product Pricing:
Mid-range to premium, with strong brand recognition in kitchen and bath fixtures.
SmartAping AI Model Target Price:
$81.36
Technical Snapshot:
• Broke below—and then bounced off—the $57 weekly support zone
• Now trading at $60.42, up from the intra-week low
• WiseStrat Macro ASI: deeply oversold at –120, turning bullish
• WiseStrat Micro ASI: still bearish, suggesting cautious position sizing
Why Watch:
Home-improvement spending has held up despite moderating housing starts, and MAS’s disciplined balance sheet and dividend yield (~2%) make it a compelling recovery play if consumer confidence picks up.
2. IQVIA Holdings Inc ( NYSE:IQV )
What They Do:
IQVIA provides data analytics, research services and technology solutions that power clinical trials, market research and real-world evidence for the life-sciences industry.
Customers:
• Pharma and biotech firms
• Medical device companies
• Healthcare providers and payers
Income Source:
Subscription and project-based fees for data platforms, consulting and trial execution services.
Geographic Footprint:
• 50% Americas
• 30% EMEA (Europe, Middle East & Africa)
• 20% Asia-Pacific
Product Pricing:
Variable, tailored to project scope—from high-volume data subscriptions to multi-million-dollar trial outsourcing contracts.
SmartAping AI Model Target Price:
$275.35
Technical Snapshot:
• Dropped below the $137 weekly support last week, then staged a relief rally
• Currently at $150.28
• WiseStrat Macro ASI: extremely oversold at –127, now in bullish reversal mode
• WiseStrat Micro ASI: turning positive, hinting at building short-term momentum
Why Watch:
With global R&D spend on track to exceed $250 billion this year, IQVIA’s blend of analytics and CRO services is in high demand. A seasonal uptick in trial starts could catalyze upside toward our $275 target.
3. Thermo Fisher Scientific Inc ( NYSE:TMO )
What They Do:
Thermo Fisher supplies scientific instruments, reagents and software used in research, diagnostics, manufacturing and safety testing across life-sciences and industrial markets.
Customers:
• Academic, government and corporate research labs
• Clinical and diagnostic facilities
• Biopharma manufacturers
Income Source:
Sales of equipment (from a few hundred to multi-million dollars), consumables, and service contracts.
Geographic Footprint:
• ~50% North America
• ~30% Europe
• ~20% Asia-Pacific & other
Product Pricing:
Ranges widely: entry-level lab kits to high-end sequencers and complete lab automation lines.
SmartAping AI Model Target Price:
$645.83
Technical Snapshot:
• Tested and held the $412.73 weekly support last week, bouncing back to $424.24
• WiseStrat Macro ASI: oversold at –129, now showing bullish tilt
• WiseStrat Micro ASI: still negative, cautioning potential retest of $412
Why Watch:
Strong long-term secular drivers—gene therapy, personalized medicine and diagnostics—remain intact. A washout in biotech funding fears has left TMO trading at a rare discount to growth peers.

Still uncertain of continuing decline on 2 oscillatorsThe support matches that of the past, a fall from a 100 may not be enough to stop it, but inside the channel, as long as the break from it lands on that support line shy of 500, then we have a counter bounce which could prove a significant possibility gaining 20 points. Target 520 with a trailing stop.
Plus on Thermo Fischer. TMOThe last take on TMO brought 7.5% profit in 13 days. It was manly based on Harmonic/RSX OBOS combo signature. The change in the candle stick tendency now might be an earliest of the earliest signs of a pivot. This is a very risky take, given limited evidence: Stoch/RSI cross, vWAP cross, US support and bullish encompassing candle, thus the stop is very tight.

Betting on Cool Down at Thermo Fischer. TMOIt's not a perfect butterfly, but I am willing to take a shot given the wealth of evidence in the background from our algorithmic indicators. MIDAS cross line plus resistant vWAP and US, which also crossed 4-5 candles ago, plus cross on VZO and heralding cross on Stoch/RSI. BB %PCT is about to flip also. Highly, highly suggestive picture.

TMO Long Idea- Price has retested and held the weekly descending trendline
- on the daily timeframe, price has formed 5 waves and is holding the 0.618 retracement
- enter now with a stop loss at the previous swing low around 494
- upside levels to watch: 540, 570, 620
- beyond 620, new ATHs can be expected

looking at sub 500 levels just can't seem to find the bottomReading many timeframes and patterns, it's a simple concept along with good or bad fundamentals, and of course, the catalyst is to sell the news or buy the speculation. In this case, reading the chart, we see oscillators that are turning to the downside, we don't see confirmation of the bottom, we see moving averages about to turn bearish with a death cross, and we can see the buying pressure versus the room to continue selling on the stochastic. RSI, we also see that the volume dried up toward the end of the year; we see fib retracement continue to bounce up and down, creating an H&S pattern on the second try before its demise from 7 pivots at resistance in the 620 regions. It seems like a smaller area of distribution before the next leg, but I do see a break of 500. Short-term bears.

Lot of indicators poised to allow this to move up to 570With crossovers, indicators are poised to bet big on the retrace combined with consolidation and moving back to an area of high volume into 570 territory. We believe this is oversold and has room to run. Target 570.

TMO Thermo Fisher Scientific Inc. (TMO) is currently experiencing a mixed financial and market performance. Here is a technical analysis of the stock as of November 2024:
1. **Recent Performance**: TMO's Q3 2024 earnings per share (EPS) came in at $5.28, slightly exceeding analyst estimates of $5.25, with revenues of $10.60 billion, marginally below the $10.63 billion expectation. The company's revenues grew by 0.2% year-over-year, signaling stability despite broader sectoral challenges.
2. **Growth Outlook**: The company is positioned for future growth, with potential benefits from easing pandemic-related slowdowns, strengthening biotech and pharmaceutical markets, and improved global funding conditions. Analysts project a full-year EPS of approximately $21.67 for 2024.
3. **Valuation and Buybacks**: TMO is considered attractively valued near its bottom range, with a robust stock buyback plan of $4 billion announced recently, demonstrating confidence in long-term financial health.
4. **Key Ratios and Metrics**: Thermo Fisher's net margin is 14.48%, and its return on equity stands at 17.49%, indicating efficient management of resources. However, its stock shows some volatility, with a neutral momentum score under multi-factor models.
5. **Dividend**: The company declared a quarterly dividend of $0.39 per share (annualized yield of 0.30%), reflecting a conservative payout ratio of 9.78%.
6. **Market Sentiment**: TMO is regarded as a strong contender in the medical equipment sector, but its high valuation may deter some investors. Analysts suggest a fair value estimate of $610, marking potential upside from current levels.
While Thermo Fisher remains a leader in the life sciences and diagnostics space, potential investors should weigh the stock's valuation against its long-term growth trajectory and current macroeconomic conditions.

$TMO with a bullish outlook following its earnings #StocksThe PEAD projected a bullish outlook for NYSE:TMO after a negative under reaction following its earnings release placing the stock in drift D with an expected accuracy of 100%.

$TMO breaking out of a 15 month wedge Looking at Thermofisher breaking out of a 15 month or so wedge which is strong. Look to target 672.34 as a first stop and see if it breaks the resistance. GO!

$TMO bullishbreaking contr-resistance line. There is a potential of 18% until next resistance zone. easy stop loss above prevues lows

TMO mid term analysis: 2024 is at risk By using the wave analysis we can forecast the future move of the price from a statistical mathematical perspective on NYSE:TMO .
A minimum of swing at 474 dollars was broken down, that swing is the checkpoint for a T+6 (2 years wave).
As the wave was broken to the downside on the 12 of October only after 234 days, we might expect a new yearly wave, potentially in development, with short term opportunities to the upside, but by the end of the new yearly wave (July 2024/ February 2025), the price should go lower than 415 dollars.

$TMO PRICE FORECASTPosted this eariler but matrix was attacking original post below
And remember kids you can make a million

TMO daily (Bullish Scenario) After being rejected from its Dynamic Resistance , ThermoFisher's stock has now reached a significant range around ( 540 ). If it manages to hold above this area once again, it could potentially launch upwards.

Monitoring for potential breakoutprev. resistances needs to continue to hold as support. there is a bullish abcd pattern set up on the monthly chart. I'm interested in buying the dips. This is also a Nanotechnology play

BUYING TMO Starting a long position along with call options.
The expectation of strong upcoming earnings will be priced in very soon!

MyMI Option Trades - TMO Potential CallsTMO just bounced off of their strongest Support Level since July 2021 which was once the stock's strongest resistance level. Once the stock surpassed that July 2021 Resistance Level, it quickly continued to ride to its All-Time Highs of $672.34.
Looking for potential long-term options on this as it's also at the bottom of its upward trend level that was formed since that July 2021 Breakout.

TMO with a bullish outlook following its earnings #StocksThe PEAD projected a bullish outlook for TMO after a negative over reaction following its earnings release placing the stock in drift C with an expected accuracy of 25%.

TMO trading channel TMO has been trading in a parallel channel since Jun 21
Looking at volume profile a lot of buying happened at 552
Right now from 3rd May till 17 May there was a bearish run and now there is a slight confirmation of the bull move and can run till 550
Entry @ 529
TP1 551
SL 510
