TRV eyes on $265.51: Golden Fib break should run to new ATHTRV has been struggling with a Golden Covid fib at $265.51.
This is a MAJOR landmark. proven by the many rejections.
This break may be the ONE, the one to hit All Time Highs.
4TRV trade ideas

Uptrend is still steadyNYSE:TRV Travellers is looking at a continued upside after a mild correction at 27 Nov 24. The double top fails to conclude a 1:1 move and rebounded heavily. Currently, the stock rose above all ichimoku indicators and the stochastic plus the ROC is showing signs of rising bullish momentum.
Hence, we are looking at a buy to US$300.00 on a longer-term basis

$TRV with a bullish outlook following its earnings #StocksThe PEAD projected a bullish outlook for NYSE:TRV after a positive under reaction following its earnings release placing the stock in drift A with an expected accuracy of 70%.


Travelers: One last climbWe expect Travelers to continue its corrective rise in the form of the magenta wave (B) to just below resistance at $232.75 before a significant sell-off sets in. If, on the other hand, the price were to decline earlier and slip below the support at $200.40, our alternative scenario will come into play (35% likely). In this case, we will expect a lower low of the magenta-colored wave alt.(A).

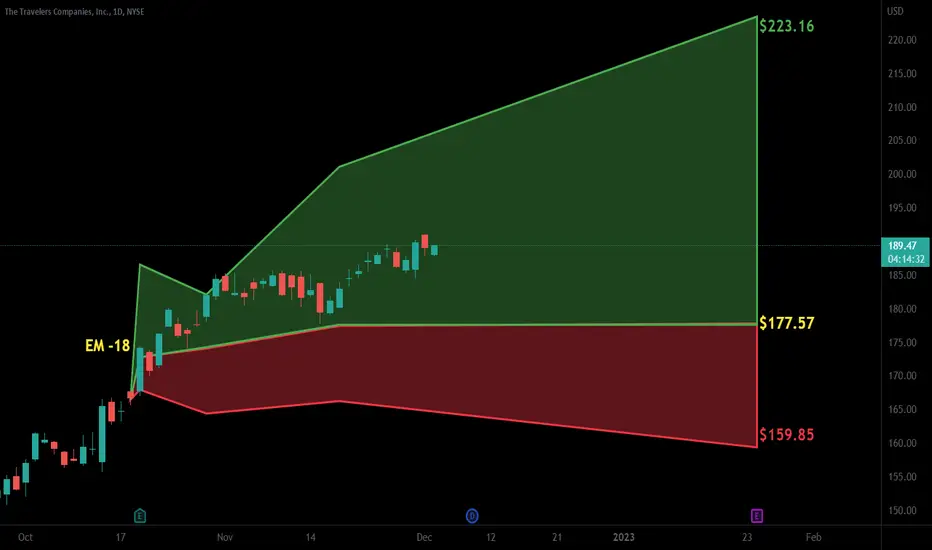
Travelers: On an excursion 🗺️ 🚎The Travelers stock could once again honor its name and undertake a volatile journey. We now locate the stock in the magenta wave (y), which should undercut the support at $157.33 and then bring the superior wave (4) in green to its end. It should be noted that it is also 39% likely that the stock has already established the low of the larger correction with wave alt.(4) and will next break out directly above resistance at $173.47. Following the deposited wave (4) low - whether by primary or alternative means - we expect significant price gains

📈📊 #ChartPattern Alert! 📈📊 📈 Falling Wedge 📈📈 What is a Falling Wedge? The Falling Wedge is a bullish chart pattern characterized by two converging trendlines, with the lower trendline sloping upward more than the upper trendline. It typically signals a potential bullish reversal, with the price likely to break upward after the wedge pattern.
📈 How to Identify:
Draw a trendline connecting at least two higher highs (upper trendline).
Draw another trendline connecting at least two higher lows (lower trendline).
📈 What it Signals: The Falling Wedge suggests a potential bullish reversal, with buyers gaining strength as the price reaches higher lows within the wedge. It often forms during downtrends and can precede a significant price move to the upside.
📈 Trade Strategy:
Consider buying when the price breaks above the upper trendline of the Falling Wedge.
Set profit targets based on the pattern's height added to the breakout point.
Implement a stop-loss to manage risk in case of a false breakout.
Remember to validate your analysis with other technical indicators and conduct thorough research before making any trading decisions. Happy charting and trading! 📈💹

April Gainers (TRV, account up 1.06%)11th trade in April is NYSE:TRV .
Holding period is 37 days (3/13/23-4/19/23).
Account is up 1.06%.
Total return in April is 3.05%.

Travelers (TRV) hits Major SupportI had an alert set for Travelers NYSE:TRV that hit this morning. It is the 50% Retracement Support on the Daily for the last 2 quarters of price action. This sets up a good long to retest the high should the level hold.

$TRV with a Bullish outlook following its earnings #Stocks The PEAD projected a Bullish outlook for $TRV after a Positive Under reaction following its earnings release placing the stock in drift A with an expected accuracy of 62.5%.
Some Sectors Deserve NoticeWhile many are still looking for lower market lows, It's important to see that some sectors of the market are on fire! All the talk is on Energy stocks but insurance companies have been on a tear. Higher interest rates will certainly benefit these shares.

TRV $TRV Initial ShortTRV $TRV Initial Short. TP and SL on chart. Move SL on TP. After TP2, trail with 0.5ATR step and 1.5ATR offset.

$TRV with a Bearish outlook following its earnings #Stocks The PEAD projected a Bearish outlook for $TRV after a Negative under reaction following its earnings release placing the stock in drift C with an expected accuracy of 80%.

TRV Initial Short on the DailyTRV Initial Short on the Daily. 30x leverage. SL and TPs on the chart.

$TRV with a Bearish outlook following its earnings #Stocks The PEAD projected a Bearish outlook for $TRV after a Negative Under reaction following its earnings release placing the stock in drift D with an expected accuracy of 77.78%.

Idea for a breakoutWatching how price acts after breaking this bullflag
There are two area of supports I am watching. Price will either breakout and attempt a new high after taking Friday's highs, or we can go back to the second support area where it would offer a better R:R

TRV: RECTANGLE PATTERN BREAK WATCHRectangles can extend for a few weeks or many months, and provide great trade opportunities every time the stock touches the top or bottom of the rectangle, until it finally breaks to the upside or downside.
TRV has been trading in a range (146.75 / 162.77) since February, forming a rectangle pattern. Generally, the longer the pattern, the more significant the breakout .
I will watch for a break of 162.77 and enter a long trade only if we break this level.
First target at more or less 180.


The triangle pattern on TRV is finished | What's next?Today, we will look at a beautiful chart from a technical perspective and all the relevant levels that we should pay attention to.
Key Elements on the chart:
a) The dynamic Resistance level working since 2018. That's our Major level in terms of defining the turning point for bullish movements. Once we have clarity about "major levels," we may see two types of behavior there. Either the level keeps working, and you observe a reversion. OR the price creates sideways structures below on the edge or above, and generally speaking, we tend to observe new impulses coming out of those structures.
b) The ABCDE triangle pattern: Corrective Structures are not more than a tool, and when used as isolated signals, it is a great formula to achieve nothing. However, when we add context to a corrective structure, we increase our odds of being in front of a situation where the price may start a new massive impulse or wave. In this case, the proportions with the previous impulse are perfect, and the inner formation of it is from a technical analysis book. So we can consider it finished.
Activation level and directions:
a) Targets: we are using fibo extensions to define the possible targets of this movement. Remember, we ALWAYS use 1.618 as taking profit and 1.272 as a level to be cautious and protect the full position or part of it.
b) Activation Level: the ONLY way to say "My Bullish view is active" is IF the price reaches our horizontal green line, which basically means a new ATH. IF that becomes true, my invalidation level will be below C; at that point, I would say, "I'm hesitant of the bullish hypothesis," therefore I'm out. However, if the price doesn't reach our activation level, there's nothing to do more than wait or cancel the idea if the price starts falling.
Thanks for reading! Share your view or charts on the comment.

TRV Triangle Trade DevelopingIn this update we review a potential ascending triangle trade in Traveller Company listed on the NYSE, we identify a high probability trade & target

THE TRAVELERS COMPANY : CMP 154Stock Breaking dailytime Correction...once Break 160 levels stock will Expected to hit 210 in next 6-9 months...whereas 140 will be stoploss

TRV - WATING FOR A BREAKOUTTRV is looking bullish
consolidating under 160-162 area forming an accending triangle
long at breakout to resistance area at 175-180
support at 152-164

Is Travelers Going Places?Travelers doesn’t get much attention, but maybe it should.
The insurance stock trended steadily upward since October. It made a new all-time high above $160 last week when Chubb bid for Hartford. TRV quickly pulled back, creating a potential opportunity for buyers.
Notice the trend line running along the lows of late October and early February. Price held that support yesterday. The 50-day simple moving average (SMA) is almost in exactly the same place.
Next, consider the recent relative strength in the Dow Jones Industrial Average. It’s up nearly 4 percent in the last month, quadruple the gain of the S&P 500. TRV is the smallest member of the Dow, weighing in a just $37 billion. (That’s less than two-thirds of the Nasdaq-100.)
Its parent bucket, financials, is also the second-best performing sector this year. (Energy is No. 1.)
Finally, TRV falls under the “value” umbrella thanks to its trailing P/E ratio of just 14x.
TradeStation is a pioneer in the trading industry, providing access to stocks, options, futures and cryptocurrencies. See our Overview for more.
