TESLA Always Pay YOURSELF! Tsla Stock were you PAID? GOLD Lesson
⭐️I want to go into depth regarding the this topic but it is a long one with PROS & CONS for doing and not doing it.
Every trader must choose what's best for them but you will SEE when I finally get to the write up that MANY OF THE PROS are NOT FINANCIAL but PSYCHOLOGICAL❗️
Another of 🟢SeekingPips🟢 KEY RULES!
⚠️ Always Pay YOURSELF.⚠️
I know some of you chose to HOLD ONTO EVERYTHING and place your STOP at the base of the WEEKLY CANDLE we entered on or the week priors base.
If you did that and it was in your plan GREAT but... if it was NOT that is a TRADING MISTAKE and You need to UPDATE YOUR JOURNAL NOW.
You need to note EVERYTHING. What you wanted to see before your exit, explain why not taking anything was justified to you, were there EARLY exit signals that you did not act on. EVERYTHING.
🟢SeekingPips🟢 ALWAYS SAYS THE BEST TRADING BOOK YOU WILL EVER READ WILL BE YOUR COMPLETE & HONEST TRADING JOURNAL ⚠️
📉When you read it in black amd white you will have YOUR OWN RECORD of your BEST trades and TRADING TRIUMPHS and your WORST TRADES and TRADING ERRORS.📈
✅️ KEEPING an UPTO DATE JOURNAL is STEP ONE.
STUDYING IT IS JUST AS IMPORTANT👍
⭐️🌟⭐️🌟⭐️A sneak peek of the LESSON after will be HOW & WHEN TO ENTER WHEN THE OPEN BAR IS GOING THE OPPOSITE WAY OF YOUR IDEA.👌
🚥Looking at the TESLA CHART ABOVE you will see that we were interested in being a BUYER when the weekly bar was BEARISH (GREEN ARROW) and we started to consider TAKE PROFITS and EXITS when the (RED ARROW) Weekly bar was still BULLISH.🚥
4TSLA trade ideas

Time to bounceLooking like a good place to buy Tesla for a short term trade. Probably gets up to the $310 area.

First let's go down a little more and then retest broken supportFifth Elliott wave is forming. This wave may possibly extend to $160.
It is likely to test the support it broke later around $250.
* The purpose of my graphic drawings is purely educational.
* What i write here is not an investment advice. Please do your own research before investing in any asset.
* Never take my personal opinions as investment advice, you may lose your money.


Tesla Forecast 2025 - Key Support Level on $209
NASDAQ:TSLA and AMEX:SPY are both down significantly, with the former reflecting a market shift from a Keynesian economy—reliant on government spending that benefits a few well-connected corporations—to an Adam Smith-inspired liberal economy driven by the invisible hand. Could this transition, with all the buzz about tariffs, fuel inflation? That depends on how these new policies are executed, especially since $2.2 trillion of the Fed’s 2020–2022 QE remains in the system. Definitely, pushing for interest rate cuts now would be a premature shortcut.
This new approach to economic policy will sap vitality from large corporations that thrived on U.S. government spending—spanning defense contractors to retailers—while favoring innovative companies like $TSLA. Firms such as NASDAQ:TSLA , which focus on efficiency and generate real wealth rather than nominal gains, stand to gain. Technically, NASDAQ:TSLA ’s key support level on the five-year weekly chart is $209, a critical and pivotal threshold.

Tesla (TSLA) Long-Term Analysis: Retesting Key SupportHello traders! Let’s dive into a long-term analysis of Tesla (TSLA) on the monthly chart to understand where the stock might be headed next. I’ll walk you through my thought process, focusing on a comparison between the recent correction and a similar setup in 2020, while also analyzing the current correction’s alignment with the triangle formation from the 2021–2024 consolidation. My goal is to help you see the context of this setup and make an informed decision if you’re considering a trade.
Step 1: Understanding the Big Picture and Historical Context
Tesla has been in a strong uptrend since 2013, as evidenced by the ascending channel (highlighted in blue). This channel has guided the stock’s long-term trajectory, with the lower trendline providing support during pullbacks and the upper trendline acting as resistance during peaks. Within this uptrend, Tesla has experienced significant breakouts followed by corrections, and I’ve identified a compelling similarity between the current price action and a setup from 2020, alongside a key technical level from the recent consolidation.
Step 2: Comparing the Recent Correction to 2020
In 2020, Tesla consolidated in a range between $12 and $24 (labeled "Consolidation 1" on the chart). It then broke out, rallying to a high of $64.60—a gain of about 169% from the upper end of the consolidation range. Following this breakout, Tesla experienced a sharp pullback, dropping to $23.37, which represents a 63.8% correction from the $64.60 high. After finding support at this level, Tesla resumed its upward trajectory, soaring to $166.71—a 613% increase from the pullback low. Now, let’s look at the current situation: Tesla broke out of "Consolidation 2" (around 2021–2024), rallying from $212.11 to a high of $488.54—a 130% increase. It has since corrected by 51%, dropping to the current price of $239.43. This 51% pullback is slightly less severe than the 63.8% correction in 2020, but the structure is similar: both followed significant breakouts from consolidation zones.
Step 3: Current Price Action and the Triangle Retest
Tesla is currently trading at $239.43, down 55% from its recent high of $488.54. If the correction deepens to around 60%, it would bring the price to approximately $195.42 (calculated as $488.54 × (1 - 0.60) = $195.42), which aligns perfectly with the upper trendline of the triangle formation from "Consolidation 2" and the "Retest support?" zone around $170–$200. This confluence suggests that the current correction could be setting the stage for a significant bounce, just as the 2020 correction did. If this $170–$200 level fails to hold, I’m watching for a deeper pullback to the "Retest support" zone around $138–$150, which aligns with the lower trendline of the ascending channel and has acted as support during previous pullbacks (e.g., in 2023).
Step 4: My Prediction and Trade Idea
Here’s where I put myself in your shoes: if I were trading Tesla, I’d be watching for a retest of the $170–$200 support zone as a potential buying opportunity, drawing from both the 2020 playbook and the current technical setup. Why? In 2020, Tesla found support at $23.37 after a 63.8% correction, which set the stage for a 613% rally to $166.71. Similarly, a 60% correction now would bring Tesla to the upper trendline of the Consolidation 2 triangle at $170–$200, a level that could act as a springboard for the next leg up. If Tesla holds this support, I expect a move back toward the $300–$339 range, where it faced resistance before the recent drop. A break above $339 could signal a continuation toward $488.54, retesting the recent high.
Profit Targets and Stop Loss
Entry: Consider buying around $170–$200 if the price retests this support and shows signs of reversal (e.g., a bullish candlestick pattern or increased volume).
Profit Target 1: $300 (a conservative target based on recent resistance).
Profit Target 2: $339 (a more aggressive target at the prior resistance zone).
Stop Loss: Place a stop below $160 to protect against a breakdown of the $170–$200 support zone. This gives the trade a risk-reward ratio of up to 13:1 for the first target.
Risks to Consider
If Tesla fails to hold the $170–$200 support, we could see a deeper correction toward $138–$150, and potentially even $64–$90, another historical support level. Additionally, keep an eye on broader market conditions, as Tesla is sensitive to macroeconomic factors like interest rates and consumer sentiment in the EV sector. While the 2020 setup and the triangle retest provide a historical and technical parallel, the current 55% drop suggests heightened volatility, so be prepared for potential whipsaws around these key levels.
Conclusion
Tesla’s recent 55% correction from $488.54 to $239.43 echoes the 63.8% pullback in 2020 after the breakout from "Consolidation 1." If the correction deepens to 60%, it would retest the upper trendline of the Consolidation 2 triangle at $170–$200, suggesting a potential opportunity for a high-probability trade with clear profit targets and a defined stop loss. This setup could mirror the 2020 recovery, where Tesla rallied 613% after finding support. What do you think of this setup? Let me know in the comments—I’d love to hear your thoughts!

Long TSLA Next Week: Targets and Analysis
- Key Insights: Tesla's brand may face challenges, but its advancements in
autonomous driving and robotics technology provide a strong foundation for
potential growth. Despite ongoing volatility and political distractions, the
focus should be on Tesla's technological and innovative strengths. A mixed
sentiment from analysts suggests monitoring reversal signals for possible
entry points.
- Price Targets: Next week's targets for a long position are set at $255 (T1)
and $262 (T2), with stop levels at $217 (S1) and $190 (S2).
- Recent Performance: Tesla, along with other tech stocks, has faced significant
volatility influenced by broader market weaknesses. Breaking key levels
within major indices like the S&P 500 and NASDAQ 100 has affected Tesla's
technical outlook. Despite this, there's potential for a V-shaped recovery
led by improvements in the tech sector.
- Expert Analysis: Analysts present a dual sentiment, acknowledging the brand
issues while highlighting innovations like Tesla's role in autonomous
driving. Predictions suggest holding Tesla stock with specific price targets
in mind to leverage potential future growth.
- News Impact: Factors such as tariffs, US-China trade tensions, and
disappointing Q1 vehicle sales continue to challenge Tesla's market
position. Political actions from Elon Musk and discussions around vandalism
incidents contribute to brand challenges. However, Tesla's progress in AI
and robotics remains promising for future growth. The situation warrants
close attention to market shifts and reversal signals.

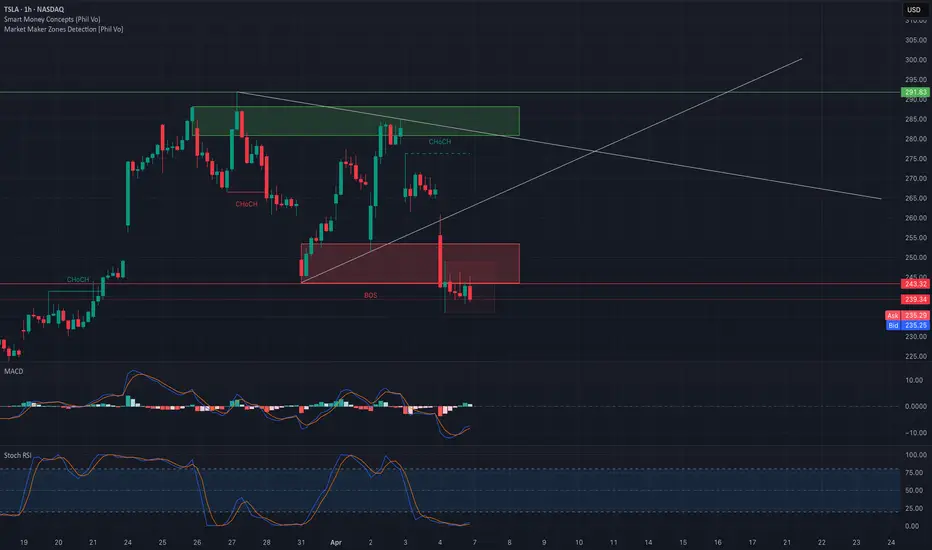
TSLA Enters the Breakdown Zone – Is $222 Next? Prepare or Avoid the Trap!
🧠 Market Insight:
The recent Trump tariff announcement has shocked the tech and EV sectors, triggering a broad sell-off across growth names. With sentiment rattled and gamma exposure skewing aggressively negative, traders are facing a high-risk, high-opportunity zone. TSLA is now sitting at a critical juncture—with both Smart Money Concepts (SMC) and Options Market positioning flashing red flags. Caution is essential, but opportunity awaits the prepared.
🔍 Technical Analysis (1H Chart):
* Break of Structure (BOS) at $243 confirms bearish intent after multiple Chochs.
* Price is holding below a major supply zone ($250–$272), now turned resistance.
* Strong bearish channel structure forming, with price consolidating just below BOS—often a sign of continuation.
* MACD is below the signal line but slightly curling upward—showing potential for a relief bounce.
* Stoch RSI is oversold, indicating exhaustion in short-term bearish momentum. Watch for a bullish crossover.
🔐 Key Levels:
* Resistance: $243.32 (prior BOS), $249.89 (HVL / NETGEX wall), $272.5 (2nd Call Wall).
* Support: $235 zone (current), $222.28 (recent swing low), $215–$210 (GEX danger zone).
💣 Gamma Exposure (GEX) Insights:
* Highest Negative NETGEX at $250 – now acting as a gamma barrier, suggesting strong dealer hedging may suppress rallies.
* Heavy put walls layered down from $235 to $210, with the 2nd PUT Wall (-66.72%) at $215, marking a likely magnetic downside zone.
* IVR: 95.2 with Call$ at 60.5% – Options are still expensive, and call bias may indicate dip-buying interest, but negative GEX outweighs that for now.
📈 Trading Scenarios:
🐻 Bearish Continuation (High Probability):
* Entry: Below $235
* Target: $222 → $215
* Stop: Above $243 BOS
* Reason: Clean break of BOS, trapped longs, negative gamma buildup
🐂 Bullish Reversal (Less Likely – Monitor):
* Entry: Bounce from $235 with strong volume + bullish MACD crossover
* Target: $243 → $249.89
* Stop: Below $230
* Reason: Oversold Stoch RSI + high IV environment may cause volatility pop
💡 Strategy Suggestions:
* Scalpers: Trade between gamma walls, especially $235 to $222 zone with tight stops.
* Swing traders: Wait for reclaim of $243 to consider long.
* Options: Buying puts carries risk due to inflated IV. Consider spreads (put debit or bear call).
⚠️ Final Thoughts:
TSLA has lost key support and sits in a high-volatility, dealer-driven gamma pocket. Directional plays are dangerous unless you're trading with the flow and reacting quickly. Be surgical, respect your stops, and scale into conviction—not noise.
🧨 This analysis is for educational purposes only and does not constitute financial advice. Always do your own research and manage your risk before trading. 🧨
TESLA: Will Keep Growing! Here is Why:
Balance of buyers and sellers on the TESLA pair, that is best felt when all the timeframes are analyzed properly is shifting in favor of the buyers, therefore is it only natural that we go long on the pair.
Disclosure: I am part of Trade Nation's Influencer program and receive a monthly fee for using their TradingView charts in my analysis.
❤️ Please, support our work with like & comment! ❤️

TESLATSLA is still in correction, we will wait for market to break above 295 and show us reaction before any buys.
Disclosure: We are part of Trade Nation's Influencer program and receive a monthly fee for using their TradingView charts in our analysis.

$TSLA $160-180? I think..."Technical bounce on NASDAQ:TSLA at 160-180? – Possible long???"
📉 Nasty drop on TSLA, broke below the $250 level.
🎯 Potential short setup now, with a target around $160-180.
That’s where I’ll start buying—if we get a daily or weekly reversal candle, with a stop just below support.
👉 Follow me for more updates on stocks and futures.

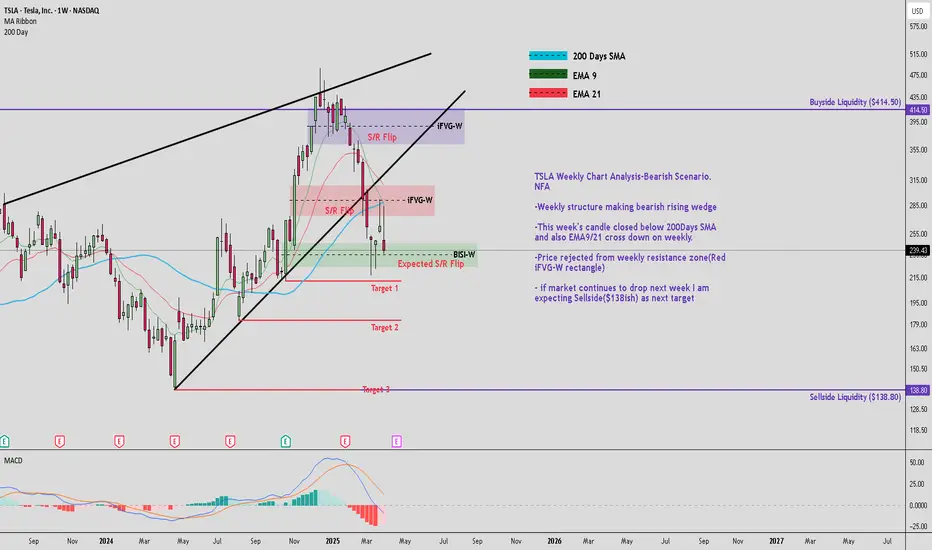
TSLA Weekly Chart Analysis-Bearish Scenario. NFATSLA Weekly Chart Analysis-Bearish Scenario. NFA
-Weekly structure making bearish rising wedge
-This week's candle closed below 200Days SMA and also EMA9/21 cross down on weekly.
-Price rejected from weekly resistance zone(Red iFVG-W rectangle)
- if market continues to drop next week I am expecting Sellside($138ish) as next target
April 5th 2025 tsla chart analysisApr 5 th #tsla #tesla NASDAQ:TSLA chart analysis on the daily chart-
Resistance levels - 294.09,286.36,282.49
Support levels- 224.40,218.08,212.33,203.71,184.17,166.93,139.92

nazis arent from south africawhat do u want me to say...
weekly chart here w/ weekly trendlines (aggressive & conservative- dashed)
earnings report on the 22nd line up at 200$ for Q1. awfully close at the 173/169 dollar too.
what does the FOMC have to say on the 9th???
i have an alert at 200, i'll buy @ 175$ (wait n see a week or two)
the Left losing their minds!!!!!!!

TSLA is coming down to my buy zoneTSLA is coming down to my buy zone. I will be accumulating at 229 and below.
I will start first by selling cash covered naked puts to collect credits until it drops to that zone. The goal is to get assigned with the naked put options at a cost of 229 and below to purchase TSLA shares.
There is a good possibility that the next earnings of TSLA will disappoint and we might get a quick dip. In that case we may even see early 200s. I would be adding more shares there.
Note that this is a weekly chart so it will take some time to play out.
This is a long term hold for me.
Upside Target:
- Nearest upside target is 11.9% above the current price, approximately $267.86.
Downside Target:
- Nearest downside target is -1% below the current price, approximately $237.04.
- Next downside target is approximately $195.65-196
- Support and Resistance: Monitor the support at $217.02 and resistance at $291.85 for potential breakouts or breakdowns.
- Action: Given the bearish sentiment, consider waiting for a clearer bullish signal or confirmation of support holding before entering long positions. Up Volume to Down Volume Ratio 30-Days is 0.86 and 50-Days is 0.78, both below 0.8, indicating bearish sentiment in the near term so wait for it to come down to the buy zone.

TSLA looking for a bounce in the buyer's garageOn the NASDAQ:TSLA 1W chart, the price is currently pulling back below the 78.6 Fibonacci retracement level after a significant move up, and the zone between 224 and 182 presents an attractive area for potential long entries. The Ichimoku cloud (10, 20, 40, 10) shows bearish momentum, but a change in market structure on the daily chart such as a break above a previous swing high would strengthen the bullish case. The Trend Strength Index (20, 10) is in overbought territory, signaling caution, but if the price fails to reverse soon, it could continue falling toward the 146 to 109 range, a historically strong support zone where price has rebounded multiple times. This area would become a key long term investment opportunity if reached.
Disclaimer: This content is for educational and informational purposes only. It does not represent financial advice or a recommendation to buy or sell any financial instrument. Trading involves risk, and you should only trade with money you can afford to lose.

TSLA theoryWe are ina bear market this year, But I'm optimistic long term.
This is a gem to accumulate, dca when is sideways.

TESLA Expected Growth! BUY!
My dear subscribers,
My technical analysis for TESLA is below:
The price is coiling around a solid key level - 239.33
Bias - Bullish
Technical Indicators: Pivot Points Low anticipates a potential price reversal.
Super trend shows a clear buy, giving a perfect indicators' convergence.
Goal - 257.40
About Used Indicators:
By the very nature of the supertrend indicator, it offers firm support and resistance levels for traders to enter and exit trades. Additionally, it also provides signals for setting stop losses
Disclosure: I am part of Trade Nation's Influencer program and receive a monthly fee for using their TradingView charts in my analysis.
———————————
WISH YOU ALL LUCK

Tesla Stock Drops 9%+ After Q1 Deliveries Drop to Three-Year LowTesla (Nasdaq: NASDAQ:TSLA ) is trading at $242.52 as of 1:04 PM EDT on April 4th, down 9.26%. The stock fell $24.76 after reporting weak Q1 2025 results. This came two days after Tesla closed its worst quarter since 2022, shedding 36% in market value. The company delivered 336,681 vehicles in Q1, missing analysts’ expectations of 360,000 to 377,590. This marked a 13% drop compared to Q1 2024, when it delivered 386,810 units. Production also fell to 362,615 vehicles from 433,371 in the prior year.
Tesla produced 345,454 units of its Model 3 and Model Y. Deliveries for those models stood at 323,800. Other models, including the Cybertruck, accounted for 12,881 deliveries. The quarter saw partial factory shutdowns to upgrade lines for a redesigned Model Y.
CEO Elon Musk said this model could again be the world’s best-selling car in 2025. But now the question is, will it?
Looking at it, Tesla faces several challenges, including increased EV competition and reputational damage tied to Musk’s political involvement. Of late, the CEO’s position in Trump’s Department of Government Efficiency (DOGE) has drawn backlash.
Protests, boycotts and vandalism against Tesla facilities and vehicles spread across the U.S and Europe. In Germany, Tesla’s EV market share dropped from 16% to 4%. Across 15 European countries, market share fell to 9.3% from 17.9%.
China also posed challenges. Tesla sold 78,828 EVs in March, an 11.5% year-on-year decline as domestic competitors like BYD increased their market presence. In Canada, Tesla claimed 8,653 EV sales during a January weekend to qualify for subsidies. The transportation ministry froze the payments and launched a probe into the claim.
Technical Analysis: Price Approaches Key Support Zone
Tesla’s price has declined sharply since hitting an all-time high of $488 in late December 2024. Since January, the stock has been in a downtrend, respecting a descending trendline. In early February, it broke a key support level at $290 and retested the level in late March before continuing downward.
Currently, the stock is approaching support at $190, a critical level for short-term price action. If it holds, the stock could attempt to break the descending trendline and move toward the $290 resistance.
If Tesla's bearish bias persists and breaks below $190, the next support sits at $140. This aligns with the head of a previously completed head-and-shoulder pattern. Breaking this level could trigger further losses.
The next few weeks will determine if it rebounds or slides deeper, with earnings report expected on Apr 22nd, 2025.

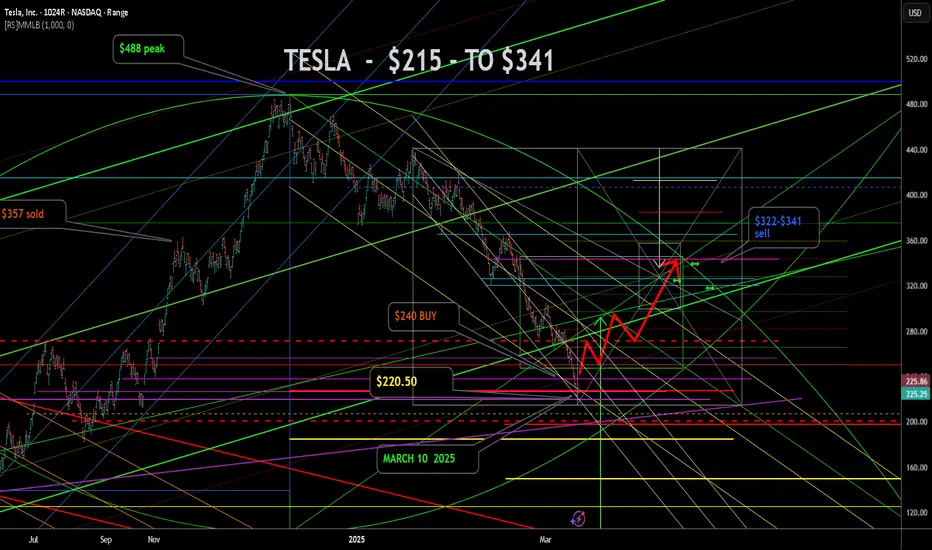
TSLA - BUY NOW - $240 I have been waiting for the low in Tesla . TSLA. Today is good enough at $240. Had to keep lowering the entry . Todays Legacy Media bad news bears were my trigger. You can always count of Corruption to help refine your technical signals. Murrey Math, Elliotwave, Kumar wave being used. Sell $340 for now. May $340 calls are a good way to play. Entertainment purposes only. Just having fun. Comments always welcome.

TESLA - THE CLIMB BACK TO $341 This is a pretty tough call to make right here. And I may get humbled. But the charts say to me - Kumar, there was a short term low today. And the next point of exhaustion is $341. Lets see what happens. This chart is likely a mess to most, but harmonious art work to me. Elliot, Murrey and Kumar being used for the analysis. Comments always welcome. Happy Trading.
TSLA - A false start? UPDATE : Tesla is unfortunately not starting on the right foot. The price action since the low is NOT impulsive to use an Elliot Wave term. So this is very unlikely to be the low. I will be selling my $265 calls near $255 price levels. And then patiently wait to see if we drift down for the true wave 5 down to $187. Additionally, the Murrey Frame 1/8ths line is also down there, as well a the Red dashed P line from the last break out. So..... if this take is wrong, and we manage to leave the channel gate move above $260 I will update. Until then its prayers to offload these longs profitably, and reset lower. Comments always welcome. And remember, trading is hard work, Sometimes we fish for a long time to catch the tastiest fish in the sea. Bona Fortuna!

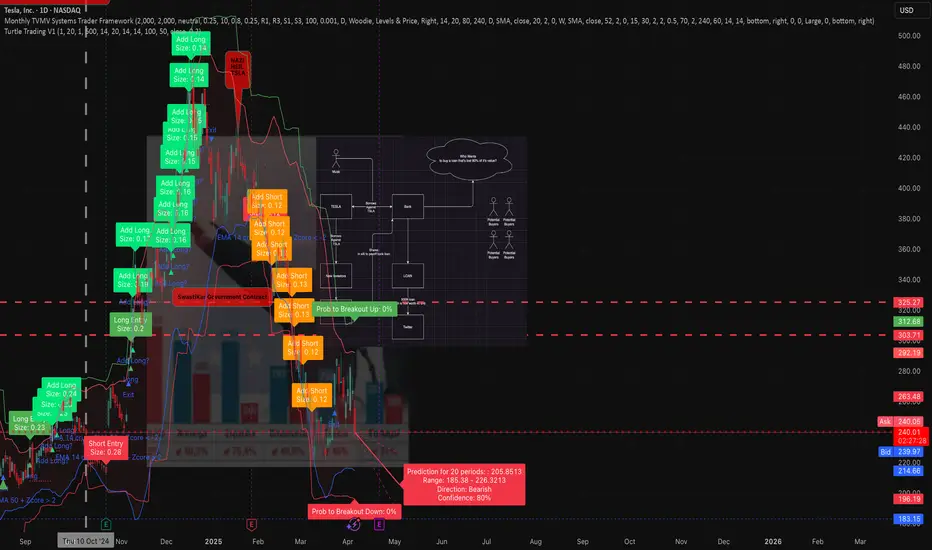
TSLA still bearish like I said. Why you should sue the board.This chart uses an unpublished modified turtle trader indicator / strategy combined with the unpublished TVMV framework using MFT candle sticks (published as separate indicator) and Bollinger bands. The max monthly position size is determined by seasonal probabilities, while the individual trade position sizes are determined by the turtle style volatility sizing based off the former's capital.
Nothing has changed about TSLA.
It has a work from home CEO who is who disconnected from reality and accountability that the stock will not recover. No amount of government contracts can over come the damage this man has done to the brand.
Sales and deliveries are down in every market and the car owners are afraid to drive their cars.
This recent pump had no basis. It lacked both fundamental value and technical value.
TSLA will break below 222 and may go as far as 109 by EOY if the board of directors does not fulfill their fiduciary obligations to share holder to remove Musk permanently .
Shareholders should seriously consider filing a class action law suit against the board of directors in collaboration with NY .