Here's Why I'm Bullish on TSLA: Smart Money is Buying...Here's Why I'm Bullish on NASDAQ:TSLA Multi-Timeframe Analysis Using Larry Williams' Methods
After a significant downtrend, NASDAQ:TSLA is presenting multiple bullish signals based on Larry Williams' methodology. The weekly and daily timeframes are aligning for a potential reversal opportunity with clearly defined risk parameters.
Weekly Timeframe Analysis
The weekly chart reveals several key bullish indicators:
- The COT Proxy Index shows commercials are buying at significantly higher levels compared to 6 months ago, 1 year ago, and 3 years ago.
- Seasonality patterns have reached a turning point, now indicating the beginning of an uptrend phase
- The WillVal indicator shows NASDAQ:TSLA is currently undervalued at multiple securities (DXY, QCCH, ZBLU all showing "Under")
- ADX reading above 60 (currently at 62.42) signals the existing downtrend is likely exhausting and nearing completion
Daily Timeframe Analysis
On the daily chart, we're seeing initial confirmation signals but still waiting for the optimal entry setup:
- The general market has created a Rally Day, and we're now watching for a Follow Through Day to confirm the new uptrend
- Price structure requires further confirmation through a change of character before entry
- The ProGo indicator has already turned positive, providing an early bullish signal
- Williams %R is showing oversold conditions, suggesting a potential bounce
- We need the Large Traders index to turn its slope upward for additional confirmation
Entry Strategy
I'm looking for one of these entry triggers:
- Primary : First pullback after change of character , using Williams %R for precise timing
- Alternative : Entry on first pullback after price moves above the WillTrend line
- Aggressive option : Entry if price breaks above the $245 resistance level
Profit Targets & Risk Management
Targets:
- First target: $327 (1.27 Fibonacci level)
- Second target: $390 (Larry Williams Target Shooter -> 2.00 Fibonacci level )
Risk Management:
- Initial stop loss: $228 or 120% of ATR(3) from entry point
- Once in profit, trailing stop based on price closes at WillTrend levels
The confluence of indicators across timeframes suggests a significant reversal potential in NASDAQ:TSLA , but waiting for daily chart confirmation will provide a higher probability setup with clearly defined risk parameters.
DISCLAIMER
This analysis is provided for informational and educational purposes only. The ideas and strategies presented should never be used without first assessing your own personal and financial situation. This content is not financial advice and should not be construed as a recommendation to buy, sell, or hold any securities or to engage in any specific investment strategy. All investment carries risk, including the possibility of losing some or all of your initial investment. Past performance of securities, including the patterns, signals, and indicators discussed, is not indicative of future results. The author does not guarantee the accuracy, completeness, or usefulness of any information presented. Each investor should conduct their own research and consult with qualified financial professionals before making investment decisions. Trading Tesla ( NASDAQ:TSLA ) stock involves significant risks that may not be appropriate for all investors. You should only invest funds that you can afford to lose.
4TSLA trade ideas

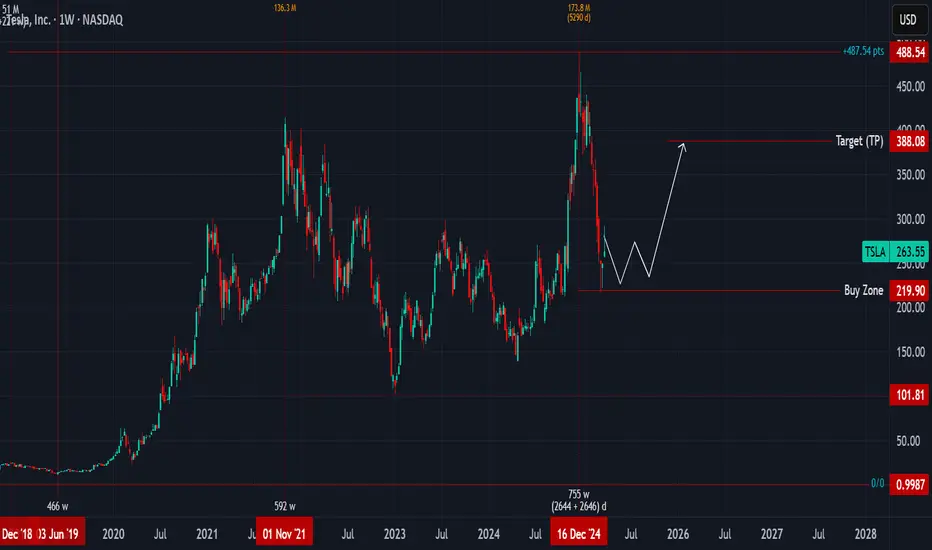
Tesla Analysis & Target.I have analyzed the chart based on the range, trend, chart pattern and There is high probability that price can come down further till Apple(Target). I have also considered one year price cycle in it.

$TSLA - A Sustained Breach of $269 Opens the Path for A Gap FillNASDAQ:TSLA - NASDAQ:TSLA - A sustained breach of $269 opens the path for a gap fill towards 250-244.

Go Long on TSLA: Targeting a Bullish Rebound Next Week
- Key Insights: Tesla's stock is presently experiencing heightened volatility,
influenced by delivery figures, significant corporate updates, and economic
conditions. The anticipation around Tesla's delivery report and advancements
in AI and autonomous vehicles suggests possible bullish movements if current
trends hold.
- Price Targets: Next week’s price target ranges for a long position are set
between $274 (T1) and $282 (T2). Stop levels are strategically placed below
current market sentiment impacts, with S1 at $252 and S2 at $250 to manage
downside risks.
- Recent Performance: Tesla's recent market activity reflects significant
fluctuations tied to delivery data and broader tech sector challenges. The
stock's price has hovered around key resistance and support levels,
indicating potential readiness for an upward movement should positive
catalysts emerge.
- Expert Analysis: Influential figures like Cathie Wood maintain a positive
outlook on Tesla, driven by the company's AI advancements and potential in
the autonomous vehicle sector. Analysts have pointed out that Tesla's
exposure to international tariffs is relatively moderate compared to its
competitors, possibly positioning it advantageously within the automotive
market.
- News Impact: Key upcoming reports, particularly Tesla's delivery announcement
on April 2nd, could dramatically affect stock perception and investor
sentiment. Advancements in AI, particularly the potential launch of Robo
taxis, are seen as game-changers for Tesla's market valuation. Meanwhile,
operational and regulatory challenges remain, including the uncertain impact
of geopolitical moves such as tariff implementations.

Which levels will break this month for $TSLA ?They say Buy the DIP. Which one ?
I like to SELL PUTS lower and let the market decide.
Start 30 days out and go out 90 days.
Buy small and load up 50% to 75% lower.
If you like the company then you want to buy when everyone hates it.
I still think Tesla is growing.

Tesla’s Value Proposition: Navigating Noise Toward Long-Term UpsTesla retains significant intrinsic value despite recent volatility. The post-election rally, driven by FOMO (fear of missing out), reflected emotional momentum rather than solid fundamentals. Currently, the stock sits in a robust technical demand zone, supported by key chart levels. Yet, uncertainty lingers among investors, fueled by two primary risks: Elon Musk’s foray into politics and its potential impact on Tesla’s strategy, alongside physical attacks on its vehicles as a social backlash against his persona.
My market experience suggests time aligns price with fundamentals, and Tesla won’t be an exception. Let me expand: Musk, in tandem with Donald Trump, appears to champion an economic and social revitalization agenda in the U.S.—a critical lens for analysis. Global geopolitical tensions remain high, boosting safe-haven assets like gold while pressuring cyclical sectors like automotive. Add to this the U.S. power transition amplifying uncertainty, and Musk’s politicization exposing Tesla to unprecedented scrutiny and polarization.
Still, the long-term outlook shines brighter. If Musk and Trump’s policies deliver tangible economic and consumer benefits—and there’s reasonable ground to believe they might—sentiment toward Tesla could turn bullish. A more confident consumer base, paired with easing geopolitical strains, would act as a catalyst for revaluation. Then there’s Musk’s unique edge: a track record as a disruptive innovator. Breakthroughs in electric mobility, AI, or new business verticals could outpace market expectations and solidify Tesla’s dominance.
In short, while the near term is clouded by noise and risks, Tesla’s fundamentals and Musk’s vision signal substantial upside for strategic investors. Tracking the macro environment and the company’s operational resilience will be key.
#TeslaAnalysis #MarketInsights #ElonMusk #Investing #StockMarket #Geopolitics #Innovation #BullishCase #TradingStrategy

Tesla to SUB $200 then back to $500?! Here's WHY!Tesla - NASDAQ:TSLA
A breakdown of this bear flag leads us right back to the massive multi-year inverse h&s diagonal retest.
Breakdown = 🎯$169 by May2025⏳
Successful retest and bounce here takes us to the original inverse h&s mm of $546 🎯 by Mar2027⏳

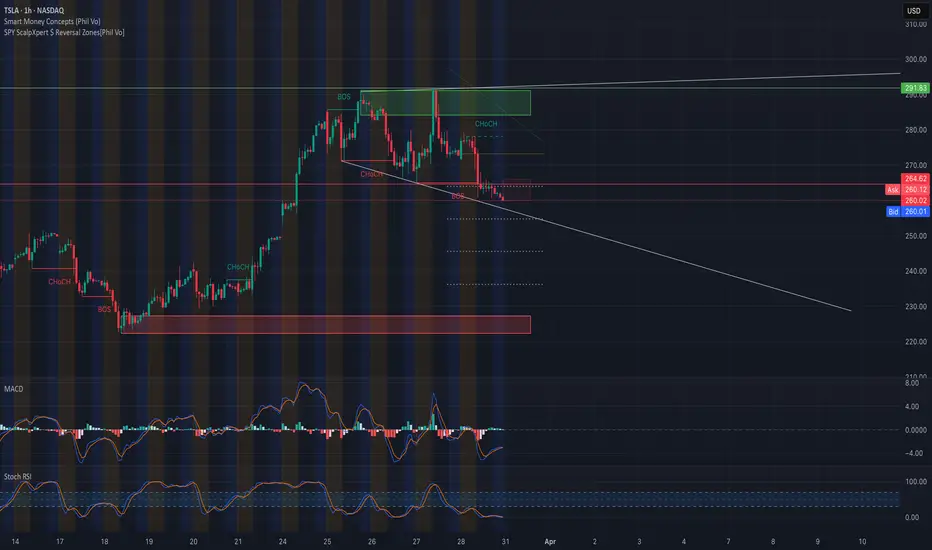
TSLA at a Decision Point! Will This Support Break or Bounce?⚡Market Structure & Price Action:
TSLA has shown a breakdown from its recent consolidation following a Break of Structure (BOS) and two Change of Character (CHoCH) signals. Price is now compressing downward in a falling wedge toward a key support zone around $260, suggesting a potential reversal or continuation setup.
* Bearish order block from the $290–$300 zone remains unchallenged.
* Current price action is hovering right at a support level with small-bodied candles, indicating indecision.
GEX & Options Flow Insights:
* IVR: 37.8
* IVx avg: 22.6
* Put Positioning: 71% (very defensive positioning by institutions)
* GEX: 🔴🔴🔴 (Strong bearish gamma exposure)
🧨 Highest negative GEX zone and Put support are stacking around $554–$550, acting as a gamma magnet and potential short-term floor if selling pressure accelerates.
Key Levels to Watch:
* Support Zones:
* $260.01 (current bid zone)
* $249.89
* $230 (lower wedge support)
* Resistance Zones:
* $275 (gap fill resistance)
* $291.83 (strong supply + BOS origin)
* $304.50 (major swing resistance)
Indicator Insights:
* MACD: Bullish crossover forming but lacking strong momentum
* Stoch RSI: Oversold territory, curling upward, hinting a potential short-term bounce
* Volume: Increasing on red candles, showing heavy sell pressure dominance recently
Scenarios:
🔼 Bullish Play:
* Entry: Above $264.50
* Target 1: $275
* Target 2: $291
* Stop-loss: Below $255
Confirmation needed via bullish CHoCH and break above descending wedge.
🔽 Bearish Play:
* Entry: Below $258 breakdown of wedge
* Target 1: $249
* Target 2: $230
* Stop-loss: Above $267
Watch for continuation if macro weakness persists and options flow remains bearish.
GEX Outlook Summary:
TSLA is entering a low-liquidity pocket with strong bearish gamma exposure. High IVR and heavy put concentration suggest institutional hedging, increasing the chance of a further breakdown unless buyers show up at key reversal zones.
Conclusion:
TSLA is at a make-or-break zone. If bulls can reclaim $265+, we may see a relief bounce. However, bearish options pressure and gamma positioning suggest the path of least resistance could still be down, especially toward $250.
Disclaimer: This analysis is for educational purposes only and does not constitute financial advice. Always do your own research and manage risk wisely.
TESLA is up 47X vs the SPX. Can it do another 6.9X?An extraordinary unicorn enterprise, or a collection of companies and intellectual properties, led by the most prominent CEO in the history of public companies.
TESLA and ELON are impossible to overlook, and this chart has kept many observers on the sidelines for over 14 years. In the initial 6 to 9 years, Wall Street analysts and commentators failed to grasp the bigger picture, focusing excessively on the balance sheet and evaluating the company merely as an automaker. They completely missed the groundbreaking technologies being developed and advanced.
Today, we stand on the brink of fully autonomous vehicles becoming commonplace, artificial intelligence integrating into our everyday lives, and affordable space exploration becoming a reality, not to mention the myriad of other innovative technologies emerging from this remarkable company.
Individuals often enjoy predicting market peaks and labeling stocks as overvalued.
However, this chart comparing Tesla to the S&P 500 indicates that the stock may be gearing up for another surge to new heights.
Picture 10 million robotaxis cruising through our streets.
Envision a fleet of vehicles that not only generates income but also undergoes upgrade cycles, in contrast to traditional cars that face maintenance cycles, and are bogged down by Human operator's.
This development is poised to significantly transform the self-hailing ride-sharing market and the food delivery sector, potentially eliminating the role of human drivers.
In fact, Uber could very well become Tesla's largest client!

LONGTesla reached +487 points from the primary low, we made several publications about this level and what lies above and below it, the significance of this level and when they show up on time and price schedules.
Below are some shots of this monster level
We would take a tight long entries with targets at 385 price level.
Manage risk responsibly
$TSLA - Just watch for nowNASDAQ:TSLA is currently sitting on a support level. If it fails, it could revisit a recent low around the $210 area. The range from $260 to $210 is a demand zone.
In a bullish case, it breaks out of that channel and travels to the $330 area.
In a bearish case, it could retest the trendline around the $180 area.

TSLA Volatility Continues?NASDAQ:TSLA
Outlook - -GEX and -DEX with put support at 220 which would fill the Earnings gap up from last October.
Weekly -- Rejected the EMA
Daily -- Closed right above EMA
Hourly -- Consolidating
10m -- Consolidating
Bias - Neutral until one side breaks. Too much volatility to pick a side.
Pivot - 263.5
Upside Targets:
* 263.46--274.06--277.63--287.26
Downside Targets:
* 258.04--256.43--253.48--249.63

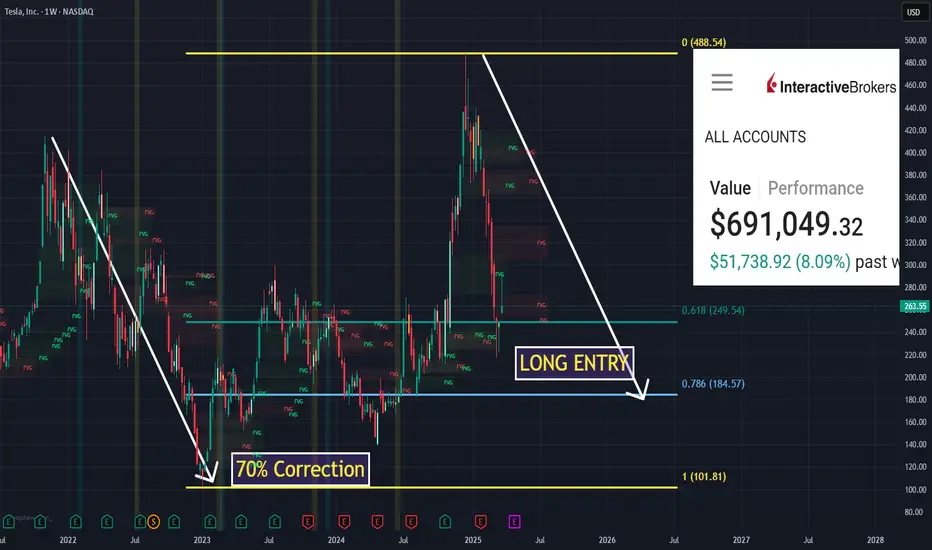
$TSLA RARE Fibonacci DIP BUY ALGOTESLA has retraced over 70% in past corrections
SUB 200 would be a SWEET deal I am looking for 185 and a 6 figure play will alert yall step by step show me some LOVE
I am currently long with my last buy at 237!

Tesla's Tipping Point: The $662 Bet That Could Return $12K TSLA bearish play thesis focused on buying 2 contracts of the $190 PUT (May 2, 2025) at $3.31 each. This version scales up all profit/loss values and ROI calculations to reflect a 2-contract position (i.e., 200 shares total).
🧠 TSLA Bearish Earnings Thesis – 2 Contract Play
Earnings Date: April 28, 2025
Option Expiration: May 2, 2025
Strategy: Buy 2x TSLA $190 PUTs @ $3.31
Total Cost (Premium Paid): $662 ($3.31 × 100 × 2)
Breakeven: $186.69
Thesis: Multiple Converging Catalysts Suggest Sharp Downside Risk
Tesla is facing a perfect storm of fundamental, technical, and sentiment-driven challenges. These create a highly asymmetric opportunity for short-dated PUT buyers heading into earnings.
⚠️ 1. Earnings Risk – Underperformance Expected
Delivery Misses: Q1 delivery numbers fell short of analyst expectations. Slower ramp in key markets like China and Europe due to economic slowdowns.
Margin Compression: Aggressive price cuts to maintain volume are eating into margins. Expectations for gross margin contraction YoY are high.
Disrupted Guidance: Potential downside revision to full-year forecasts as competition heats up (BYD, Ford, Rivian, etc.).
❝ Street is pricing in perfection. Any earnings or margin disappointment could send shares sharply lower. ❞
🧨 2. Brand Boycotts & Political Fallout
Public Backlash: Tesla faces intensifying boycott pressure in parts of Europe and the U.S. due to Elon Musk's political affiliations and controversial stances.
Brand Dilution: Musk’s polarizing presence has damaged Tesla's once-premium EV image. High-income, eco-conscious buyers are switching brands.
Retail Sentiment Shift: Reddit, X (formerly Twitter), and retail forums show sharp decline in "diamond hand" loyalty.
❝ Tesla’s brand equity is eroding. Negative sentiment is now a structural overhang. ❞
🔺 3. Headline Volatility – The “Musk Premium” Now a Liability
SEC & DOJ Scrutiny: Multiple ongoing investigations. Any bad headline can crash the stock.
X (Twitter) Overhang: Distraction and capital risk tied to Musk’s ownership of X are ongoing market concerns.
AI Pivot Uncertainty: Musk’s recent AI pushes have created confusion about Tesla’s core vision, with no clear monetization path.
❝ Musk headlines, once a tailwind, are now a systemic volatility trigger. ❞
📊 Modeled P&L for 2 Contracts
TSLA Price on May 2 % Drop Option Value per Contract Total Value (x2) Net Profit ROI (%)
$220 -16.5% $30.00 $6,000 $5,338 806%
$210 -20.3% $40.00 $8,000 $7,338 1,108%
$200 -24.1% $50.00 $10,000 $9,338 1,410%
$190 -27.9% $60.00 $12,000 $11,338 1,712%
$186.69 (Breakeven) -29.2% $63.31 $12,662 $12,000 1,812%
$263.55 (No drop) 0% $0.00 $0 - $662 -100%
💡 Strategy Recap – 2 Contract Position
Metric Value
Strike $190 PUT
Contracts 2
Premium $3.31 × 100 × 2 = $662
Breakeven $186.69
Max Risk $662
Max Reward $12,662
Reward/Risk Ratio ~19:1
✅ Final Thesis (2 Contracts)
"With $662 risked, a move to $200–$210 can yield ~$8,000. A move to $190 or below offers potential returns of over $11,000, making this a powerful short-term asymmetric play post-earnings. While risky, it’s tightly capped with a clearly defined thesis."

TESLA Tesla stock drops owing to Elon political involvement in united states politics, and the rise of china EV market with BYD AND HUAWEI LEADING BACKED BY CHINESE GOVERMENT .
the on going tariff will crush tesla market shares and revenue.

closer to 200 than you may think otherwiseOverbought on many indicators, catalyst with mixed reviews, fundamentals are still strong, projections are still a gray area. But given the recent momentum, the precedence of better forecasts and the distraction, it could become a short-term drag through the mud.
TESLA: Key Days! NASDAQ Bottoms and TESLA Breaking Out!!Everyone is thinking about today, about how difficult it is to know whether a stock will rise or fall since Trump came to power!!! :-). On April 2nd, many things will become clear after the official publication of the tariffs, but it's true that with a person like Trump in power, ANYTHING CAN HAPPEN in the future!!
As with any investment, you have to analyze all the variables that could affect its performance. Today we'll analyze TESLA!! , one of the hardest hit in the American market, mainly due to TRUMP!!! , FOR BEING TRUMP'S FRIEND!! :-).
--> What does TESLA have AGAINST IT?
1) TARIFFS: If Trump punishes countries around the world with tariffs, they (mainly China) will fight back!! , and the one that WILL BE PUNISHED THE MOST will be TESLA for Elon Musk being in power alongside Trump.
2) CHINESE ELECTRIC CARS: The competition is clear! There are Chinese vehicle companies that will compete strongly with Tesla, mainly due to price, although from my point of view, Tesla will win because Tesla is a brand of reliability, while Chinese companies are not.
3) NASDAQ: If the US enters a recession or decline, all technology will fall sharply, and with it, obviously, Tesla.
--> But what STRENGTHS does it have?
1) ELON MUSK IN POWER IN THE USA: We all know Elon Musk! And once in power, he will take full advantage of it to strengthen his companies in the coming months/years.
2) TESLA: New Tesla models and the world's most efficient batteries, in addition to the release of its first line of MOBILE PHONES, which we're all sure will be IMPRESSIVE!!
3) 40% YEAR-ROUND DROP: The sharp decline accumulated through 2025 makes this a company with GREAT appreciation potential, and at the slightest bit of good news, it will rise sharply.
With these PROS and CONS, we now have the variables outside of mathematics that could affect the value. Now it's time for TECHNICAL ANALYSIS, and for that, I've published two charts: the one above for TESLA on a H1 timeframe and the one below for the NASDAQ on a H4 timeframe. Why the one for the NASDAQ? Because you always have to analyze the direction of the INDEX, since a global drop in technology would drag down the company even if the technicals were favorable.
---> How do you view the NASDAQ?
The Nasdaq is clearly bearish in a key support zone for its future. It must not lose its current zone, and in the event of an upward rebound, it will form a bottom and signal a bullish (bullish) signal for the index in the coming weeks/months, causing all technology to rise sharply.
--> How is Tesla doing?
Tesla's outlook is better than the NASDAQ's, as it is entering a zone with intentions of breaking out higher! If Tesla surpasses 293, it will end the bearish phase it has been in since the beginning of the year and begin a bullish recovery phase. Therefore, if the NASDAQ bottoms out! When Tesla surpasses 293, we will go long without hesitation!
--------------------------------------
Strategy to follow:
ENTRY: We will open 2 long positions if the H4 candle closes above 293.
POSITION 1 (TP1): We close the first position in the 325 zone (+11%)
--> Stop Loss at 242 (-17%).
POSITION 2 (TP2): We open a Trailing Stop position.
--> Initial trailing stop loss at (-17%) (coinciding with the 242 level of position 1).
--> We modify the trailing stop loss to (-1%) when the price reaches TP1 (293).
-------------------------------------------
SETUP EXPLANATIONS
*** How do I know which 2 long positions to open? Let's take an example: If we want to invest €2,000 in the stock, we divide that amount by 2, and instead of opening one position of €2,000, we'll open two positions of €1,000 each.
*** What is a Trailing Stop? A Trailing Stop allows a trade to continue gaining value when the market price moves in a favorable direction, but it automatically closes the trade if the market price suddenly moves in an unfavorable direction by a specified distance. This specified distance is the trailing Stop Loss.
--> Example: If the trailing Stop Loss is at -1%, it means that if the price drops by -1%, the position will be closed. If the price rises, the Stop Loss also rises to maintain that -1% during increases. Therefore, the risk decreases until the position enters a profit. This way, you can take advantage of very strong and stable price trends, maximizing profits.


Tesla Stock Continues to Trade Within a Bearish ChannelThe monthly movements of Tesla's stock continue to reflect persistent downward pressure, with a decline of just over 10% since the beginning of March, showing steady selling interest. The bearish sentiment has remained in place as growing discontent over Elon Musk's political positioning has damaged the brand's image, while concerns over a potential trade war have raised fears that Tesla’s international sales may be negatively affected.
Bearish Channel:
Currently, the most important formation on the chart is a strong bearish channel that has remained intact since the final days of December 2024. So far, recent bullish attempts have failed to break out of this structure, reinforcing the broader bearish bias in the long-term outlook.
MACD Indicator:
The latest movements in the MACD histogram have started to show a notable decline, indicating that momentum in the moving average trend may be fading in the short term. This is likely due to the price reaching the upper boundary of the bearish channel, where resistance remains strong.
ADX Indicator:
The ADX line is currently trending downward, hovering just above the neutral 20 level. As this pattern continues, it reflects a lack of strength in recent price movements, pointing to growing indecision, which in turn reinforces the current resistance zone where the price is consolidating.
Key Levels to Watch:
$290: A significant resistance zone, aligning with the top of the bearish channel and the 200-period moving average. Sustained buying above this level could threaten the current bearish structure and signal the start of stronger bullish pressure.
$220: A key support level, representing the recent lows in the stock. A clean break below this zone could confirm a stronger bearish trend, opening the door for more aggressive selling in the sessions ahead.
By Julian Pineda, CFA – Market Analyst

Tesla - There Is Hope For Bulls!Tesla ( NASDAQ:TSLA ) is just crashing recently:
Click chart above to see the detailed analysis👆🏻
After Tesla perfectly retested the previous all time high just a couple of weeks ago, we now witnessed a quite expected rejection of about -50%. However market structure remains still bullish and if we see some bullish confirmation, a substantial move higher will follow soon.
Levels to watch: $260, $400
Keep your long term vision!
Philip (BasicTrading)

TeslaHaters better get it in quick, because TSLA just retraced the breakout of the prior overhead. It can and probably will pump from here, because Tesla short interest remains too high. Is anyone even raise an eyebrow that Trump’s tariffs barely scathed Tesla, but hurts most other car brands, even other “American” brands. The candles don’t care if you hate Elon or not.

What Is Tesla’s Fundamental and Technical Analysis Showing?EV maker Tesla NASDAQ:TSLA is perhaps the most controversial stock in U.S financial markets right now. Sales appear to be slowing, while CEO Elon Musk's position as a Trump administration adviser has led political opponents to attack Tesla vehicles, dealerships and even some vehicle owners.
TSLA popped 11.9% on Monday (March 24), but has generally been sinking for months. What does technical and fundamental analysis say might happen next?
Let's dig in and see what we find:
Tesla’s Fundamental Analysis
TSLA rose almost 95% in the roughly seven weeks between Donald Trump’s November election victory and the stock’s $488.54 all-time intraday high on Dec. 18. After all, Musk’s close ties to Trump seemed to point to good times ahead for the company.
However, the stock’s price has been in decline ever since then, while vandalism of Tesla vehicles by Trump opponents has made owning or one a slightly risky affair.
As of this writing, TSLA was down 32.2% year to date and 44% from the stock's Dec. 18 peak.
Beyond politics, a lot of this had to do with the reality that demand for electric vehicles might have hit something of a saturation point, at least for now.
There’s also been a tremendous increase in competition in recent years for electric-vehicle purchases or leases. Volkswagen OTC:VWAGY has ramped up its EV efforts, while China is absolutely full of homegrown competitors like BYD OTC:BYDDF , Nio NYSE:NIO and XPeng NYSE:XPEV .
All in, Tesla’s vehicle sales have slackened not just in America, but also in Europe and China. But to be fair, Ford NYSE:F , General Motors NYSE:GM and Rivian NASDAQ:RIVN have all hit slowdowns in EV sales as well.
Still, add it all up and Wall Street is looking TSLA to report Q1 results in May that include $0.47 of adjusted earnings per share on $22.9 billion of revenue.
That would represent 4.4% larger earnings and about 7.5% higher revenues when compared to last year’s Q1, where Tesla reported $0.45 of adjusted EPS on $21.3 billion in revenues.
However, all 13 sell-side Tesla analysts that I can find have revised their quarterly estimates lower since current quarter began.
On the bright side, the automaker’s operating and free cash flows have remained strong for the past three quarters.
The firm ended 2024 with some $36.6 billion in cash against a $13.6 billion total debt load. That’s what many would consider a strong balance sheet that could sustain Tesla’s operations for a time if need be.
Tesla’s Technical Analysis
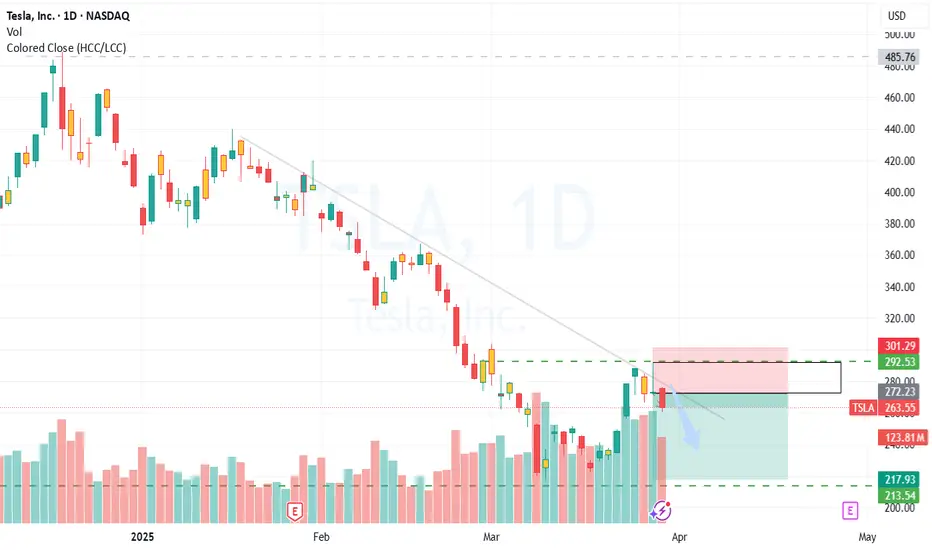
A look at Tesla’s one-year chart shows that while the stock has been falling since December, it still managed to make a stand technically in recent days:
The purple line at right in the above chart shows that TSLA found support twice in March very close to $212.30. That’s the 78.6% Fibonacci retracement level of the stock’s entire April 2024 to December 2024 run.
That purple line also shows indicates that Tesla has formed a small “double bottom” pattern of what could be a bullish reversal at the Fibonacci support level, and that the stock has since tried to rally from there.
TSLA was also able to recently take back its 21-day Exponential Moving Average (or “EMA,” denoted by the green line above). However, the stock appears to have hit resistance at the 200-day Simple Moving Average (or “SMA,” marked above with a red line).
That makes the 200-day SMA the stock's likely new pivot point.
A retaking of the 200-day SMA would allow for increased target prices. Conversely, a retest and loss of Tesla’s 78.6% Fibonacci retracement level could permit a further decline.
Meanwhile, Tesla’s Relative Strength Index (the gray line in the above chart’s top) has mostly improved recently and now stands in neutral territory.
Similarly, the stock’s daily Moving Average Convergence Divergence indicator -- or “MACD,” denoted by the black and gold lines and blue bars at the chart’s bottom -- is in a less-awful place than it was earlier this year.
The histogram of Tesla’s 9-day Exponential Moving Average (or “EMA,” denoted by the blue bars at the chart’s bottom) is now above zero. That’s historically a short-term bullish sign.
Similarly, the stock’s 12-day EMA (the black line at the bottom) is now above its 26-day EMA (the gold line). That’s typically somewhat positive, but both of those lines are still below zero -- which is historically a negative signal.
(Moomoo Technologies Inc. Markets Commentator Stephen “Sarge” Guilfoyle had no position in TSLA at the time of writing this column.)
This article discusses technical analysis, other approaches, including fundamental analysis, may offer very different views. The examples provided are for illustrative purposes only and are not intended to be reflective of the results you can expect to achieve. Specific security charts used are for illustrative purposes only and are not a recommendation, offer to sell, or a solicitation of an offer to buy any security. Past investment performance does not indicate or guarantee future success. Returns will vary, and all investments carry risks, including loss of principal. This content is also not a research report and is not intended to serve as the basis for any investment decision. The information contained in this article does not purport to be a complete description of the securities, markets, or developments referred to in this material. Moomoo and its affiliates make no representation or warranty as to the article's adequacy, completeness, accuracy or timeliness for any particular purpose of the above content. Furthermore, there is no guarantee that any statements, estimates, price targets, opinions or forecasts provided herein will prove to be correct.
Moomoo is a financial information and trading app offered by Moomoo Technologies Inc. In the U.S., investment products and services on Moomoo are offered by Moomoo Financial Inc., Member FINRA/SIPC.
TradingView is an independent third party not affiliated with Moomoo Financial Inc., Moomoo Technologies Inc., or its affiliates. Moomoo Financial Inc. and its affiliates do not endorse, represent or warrant the completeness and accuracy of the data and information available on the TradingView platform and are not responsible for any services provided by the third-party platform.
