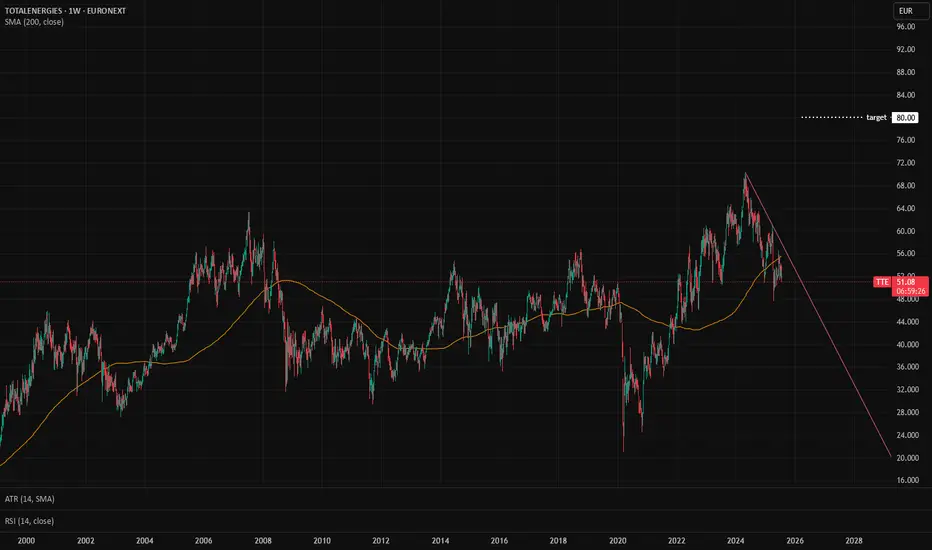
TTE: Fundamental Analysis +56 %With 2024 revenue of 195,6 billions €, Total Energies ranks among the top 10 largest energy companies in the world. EverStock identifies a fundamental revaluation potential of + 56 %.
Valuation at 7.3x net earnings
Currently valued at 115,7 billions € in market capitalization, Total Energies posted a profit of 15,76 billions € in its latest fiscal year (2024).
Balance sheet and debt
In Total Energies annual report, tangible net asset value stood at 83,62 billions €, giving a market capitalization / tangible net asset value ratio of 1.38.
The gearing ratio is good, at 0.44. (Total financial debt / net tangible assets valuation)
Current share price : 51.46 €
Target price : 80,12 €
Upside potential : +56 %
Dividend : 3.30 € (per year)
Yield : 6.41 %
4TTE trade ideas
TTE: Ready for a correction if the brent suffers from macro Correlation with Oil Prices:
TTE, being an oil and gas company, is closely correlated with WTI and Brent crude oil prices.
Market Uncertainty:
The fundamentals of industrial production are uncertain due to high commercial tariffs and evolving economic conditions, which could impact demand and slow down industrial activities.
OPEC+ Production:
OPEC+ countries are expected to increase production more than anticipated, potentially leading to a slight correction in oil prices .
Financial Strategies:
TTE has buyback plans and other financial revenues, which could provide some stability 3 4.
Stock Price Prediction:
If oil prices range between €50 and €65 per barrel, TTE's stock might vary between €42 and €55.
From a technical standpoint, breaking the €52 level on a weekly timeframe could lead to a correction down to €42.
Conversely, stable fluctuation above €52 could keep the stock in a fluctuating mode, potentially rising to €60.
Let's keep an eye on how things evolve! If you found this analysis helpful, please like and boost 😊

TOTAL - BREAK OF THE 63 ? After closing the session on Monday 26.08 up 1.13%, the share is now on a key level.
What's more, the downtrend line was broken yesterday.
The 63 level, which has acted as resistance for several sessions now, is once again under attack by investors. This level is also the one most traded by investors since the April-August period, with a POC of volume present on the 63€ level.
Despite fears about the end of the transit agreement providing for the delivery of Russian gas to Europe via Ukraine, which still represented 15 billion cubic meters (Bcm) last year. TOTAL has many reasons to be optimistic for the coming months/years.
Clearly, a break of 63€ would push the price towards 64.50€, as a first target for closing the gap between August 8 and 9.
70.11€ will remain the ultimate target for buyers, but they will need to be patient and relentless to reach this level before the end of the year.
Maxime Dominguez - Analyst at ActivTrades.
The information provided does not constitute investment research. The material has no been prepared in accordance with the legal requirements designed to promote the independence of investment research and such is to be considered to be a marketing communication.
All information has been prepared by ActivTrades ("AT"). The information does not contain a record of AT's prices, or an offer of or solicitation for a transaction in any financial instrument. No representation or warranty is given as to the accuracy or completeness of this information.
Any material provided does not have regard to the specific investment objective and financial situation of any person who may receive it. Past performance is not reliable indicator of future performance. AT provides an execution-only service. Consequently, any person acing on the information provided does so at their own risk.

TTE 1H Long Swing Conservative Trend tradeConservative Trend trade
+ long balance
+ ICE level
- above 1/2 correction
+ biggest volume 2 Sp
+ support level
Calcualted affordable stop loss
1 to 2 R/R take profit
Daily context:
"+ long impulse
+ 1/2 correction
+ SOS level
+ unvolumed 2Sp"
Monthly context:
"Trend Trade
+ long impulse
+ 1/2 correction
+ SOS level
+ support level
- historical high"
OCO 4A: Sell Shares of TTE Limit at $70.83 (Good 'til Canceled)
OCO 4B: Sell Shares of TTE Stop at $68.76 Limit at $69.19 (Good 'til Canceled)

TotalEnergies Surges Towards New Highs: Breakout WatchThe key technical level to watch is $63 per share. A decisive break above this resistance could trigger a fresh wave of buying, pushing the stock toward uncharted territory. Investors are advised to monitor the price action closely in the coming days to see if a breakout materializes.

TWO very POWERFUL Patterns for Trend Analysis!Hi, fellows!
In this Video we are going to talk about a great trend continuation pattern and also about a great trend reversal pattern, which you can add to your trading analysis!
Please keep in mind, that trading involves risk and that this video is for educational purpose only ;)

TotalEnergies is still in a trend channelTotalEnergies still on an uptrend, currently it its channel. I will stick to this plan EURONEXT:TTE

TTE - trading in the rangehi traders
TTE has been ranging for a while.
Let's keep it simple:
The price bounced from the support again an we're expecting a push up towards the key resistance level.
Long position can be taken now at 61.48$
target 1: 63.47$
target 2: 6450 $
stop loss: 60.50 $

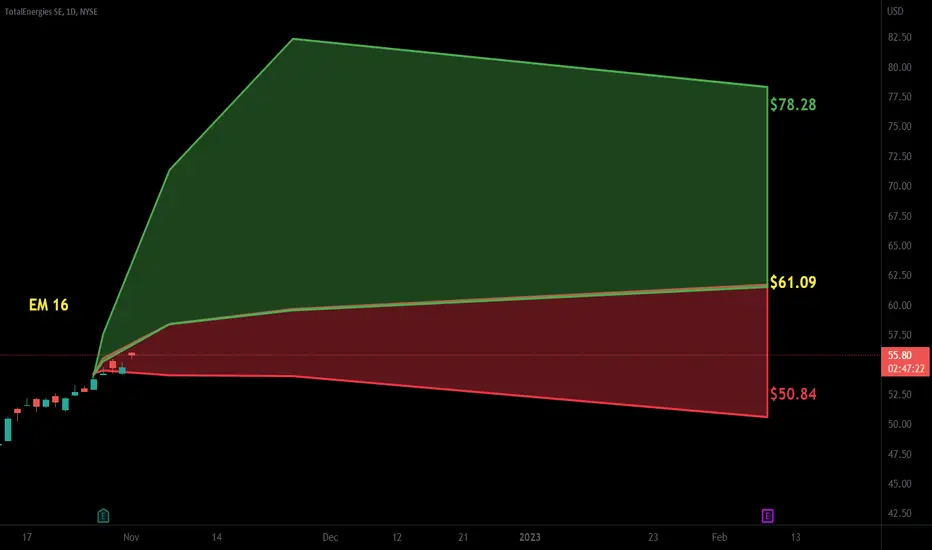
$TTE with a bullish outlook following its earnings #StocksThe PEAD projected a bullish outlook for EURONEXT:TTE after a negative over reaction following its earnings release placing the stock in drift C with an expected accuracy of 85.71%.

TTE TotalEnergies SE Options Ahead of EarningsAnalyzing the options chain and the chart patterns of PTTE TotalEnergies SE prior to the earnings report this week,
I would consider purchasing the 60usd strike price Puts with
an expiration date of 2023-9-15,
for a premium of approximately $1.80.
If these options prove to be profitable prior to the earnings release, I would sell at least half of them.
Looking forward to read your opinion about it.

$TTE with a bullish outlook following its earnings #StocksThe PEAD projected a bullish outlook for EURONEXT:TTE after a positive under reaction following its earnings release placing the stock in drift A with an expected accuracy of 33.33%.

short position on TTEMy strtegy is based on price action with the reading of certain indicators that I like whilerespecting all the values that define the stock maket

TOTALENERGIES To Keep In PortfolioTOTALENERGIES To 58 EUR.
if you have any questions do not hesitate to contact me.

short position on TTEMy strategy is based on price action with the reading of certain indicators that I like while respecting all the values that define the stock maket

50 %We have retraced the February rise by 50 % Fibonacci now. As we are in bullish consolidation I expect a renewed test of the January high.

$TTE with a bullish outlook following its earnings #StocksThe PEAD projected a bullish outlook for $TTE after a Negative over reaction following its earnings release placing the stock in drift C with an expected accuracy of 83.33%.

Neutral until 62 resistanceThe TTE action is evolgin in the middle of an ascendant traiding.
At this point a consolidation or a small pump are possible.
But in case of an augmentation, the price should decrease after hitting is long term resistance

Total Energies to see a higher correction.Total Energies - 30d expiry - We look to Sell a break of 55.39 (stop at 57.11)
We are trading at overbought extremes.
A higher correction is expected.
A break of the recent low at 55.51 should result in a further move lower.
Bearish divergence is expected to cap gains.
Although the bulls are in control, the stalling positive momentum indicates a turnaround is possible.
Current prices have reacted from a low of 55.56, however, we expect further losses to follow.
The bias is to break to the downside.
Our profit targets will be 51.21 and 50.21
Resistance: 57.30 / 58.50 / 60.44
Support: 55.50 / 53.60 / 52.20
Disclaimer – Saxo Bank Group.
Please be reminded – you alone are responsible for your trading – both gains and losses. There is a very high degree of risk involved in trading. The technical analysis , like any and all indicators, strategies, columns, articles and other features accessible on/though this site (including those from Signal Centre) are for informational purposes only and should not be construed as investment advice by you. Such technical analysis are believed to be obtained from sources believed to be reliable, but not warrant their respective completeness or accuracy, or warrant any results from the use of the information. Your use of the technical analysis , as would also your use of any and all mentioned indicators, strategies, columns, articles and all other features, is entirely at your own risk and it is your sole responsibility to evaluate the accuracy, completeness and usefulness (including suitability) of the information. You should assess the risk of any trade with your financial adviser and make your own independent decision(s) regarding any tradable products which may be the subject matter of the technical analysis or any of the said indicators, strategies, columns, articles and all other features.
Please also be reminded that if despite the above, any of the said technical analysis (or any of the said indicators, strategies, columns, articles and other features accessible on/through this site) is found to be advisory or a recommendation; and not merely informational in nature, the same is in any event provided with the intention of being for general circulation and availability only. As such it is not intended to and does not form part of any offer or recommendation directed at you specifically, or have any regard to the investment objectives, financial situation or needs of yourself or any other specific person. Before committing to a trade or investment therefore, please seek advice from a financial or other professional adviser regarding the suitability of the product for you and (where available) read the relevant product offer/description documents, including the risk disclosures. If you do not wish to seek such financial advice, please still exercise your mind and consider carefully whether the product is suitable for you because you alone remain responsible for your trading – both gains and losses.

Carefull, the ath getting nearexample of idea example of ideaexample of ideaexample of ideaexample of ideaexample of idea

$TTE with a Bullish outlook following its earnings #Stocks The PEAD projected a Bullish outlook for $TTE after a Positive Under reaction following its earnings release placing the stock in drift A.
TTE: Let's check who is rightAlthough median Analyst Target of TTE is above 70 Eur the clear H&S Motif points to 34 Region. Let's see who is tight.

Don't keep in your portfolio!!!Hello ladies and gentlemen, according to my graphical analysis, EURONEXT:TTE show a strong bearish configuration

Total Energies trading close to psychological level.Total Energies - 30D expiry - We look to Sell at 49.98 (stop at 51.21)
Weekly pivot is at 50.34.
Trading close to the psychological 50.00 level.
Daily pivot is at 50.33.
Resistance could prove difficult to breakdown.
We look for a temporary move higher.
Bespoke resistance is located at 50.00.
Risk/Reward would be poor to call a sell from current levels.
Our profit targets will be 47.41 and 46.41
Resistance: 47.00 / 49.00 / 50.00
Support: 46.00 / 45.00 / 44.00
Disclaimer – Saxo Bank Group. Please be reminded – you alone are responsible for your trading – both gains and losses. There is a very high degree of risk involved in trading. The technical analysis , like any and all indicators, strategies, columns, articles and other features accessible on/though this site (including those from Signal Centre) are for informational purposes only and should not be construed as investment advice by you. Such technical analysis are believed to be obtained from sources believed to be reliable, but not warrant their respective completeness or accuracy, or warrant any results from the use of the information. Your use of the technical analysis , as would also your use of any and all mentioned indicators, strategies, columns, articles and all other features, is entirely at your own risk and it is your sole responsibility to evaluate the accuracy, completeness and usefulness (including suitability) of the information. You should assess the risk of any trade with your financial adviser and make your own independent decision(s) regarding any tradable products which may be the subject matter of the technical analysis or any of the said indicators, strategies, columns, articles and all other features.
Please also be reminded that if despite the above, any of the said technical analysis (or any of the said indicators, strategies, columns, articles and other features accessible on/through this site) is found to be advisory or a recommendation; and not merely informational in nature, the same is in any event provided with the intention of being for general circulation and availability only. As such it is not intended to and does not form part of any offer or recommendation directed at you specifically, or have any regard to the investment objectives, financial situation or needs of yourself or any other specific person. Before committing to a trade or investment therefore, please seek advice from a financial or other professional adviser regarding the suitability of the product for you and (where available) read the relevant product offer/description documents, including the risk disclosures. If you do not wish to seek such financial advice, please still exercise your mind and consider carefully whether the product is suitable for you because you alone remain responsible for your trading – both gains and losses
