4V trade ideas

VISA potential reversal!
VISA expected to rise up to 1st resistance at 179.89 where it could potentially react off and drop down to 1st support at 171.72.
Trading CFDs on margin carries high risk.
Losses can exceed the initial investment so please ensure you fully
understand the risks.

38.2% & POSSIBLE 61.8% Retracement LONG GWAVE38.2% & POSSIBLE 61.8% Retracement LONG GWAVE.
FIB Retracement Percentage is calculated in a Higher Cartesian and or Euclidean Dimension.
PLEASE ALWAYS WAIT FOR STOCHASTIC CONFIRMATION!!! THANKS

Visa bounced from support, potential for a further rise!
Visa bounced off 169.66 where it could potentially rise further to 180.05.
Trading CFDs on margin carries high risk.
Losses can exceed the initial investment so please ensure you fully
understand the risks.

Visa bounced from support, potential for a further rise!
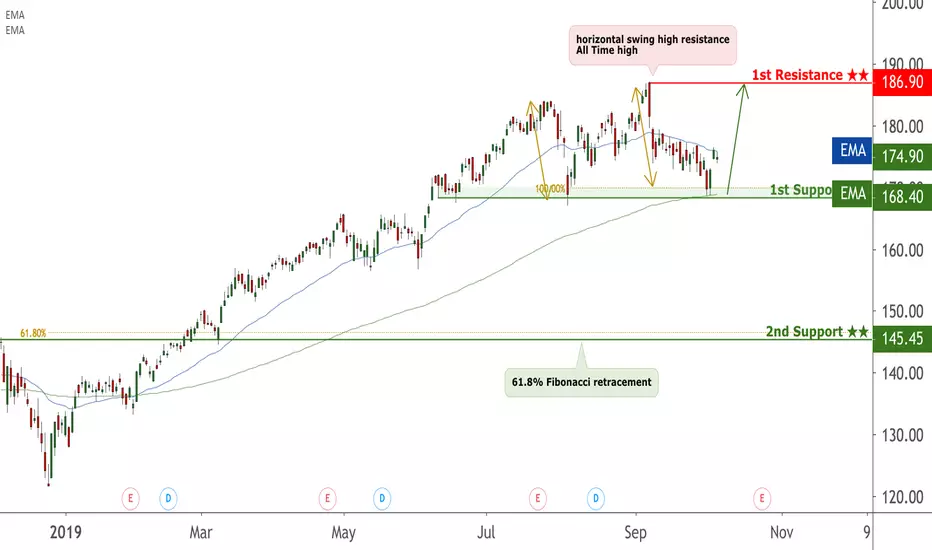
Visa bounced off 168.40 where it could potentially rise further to 186.90.
Trading CFDs on margin carries high risk.
Losses can exceed the initial investment so please ensure you fully
understand the risks.


VISA approaching support, potential for a bounce!
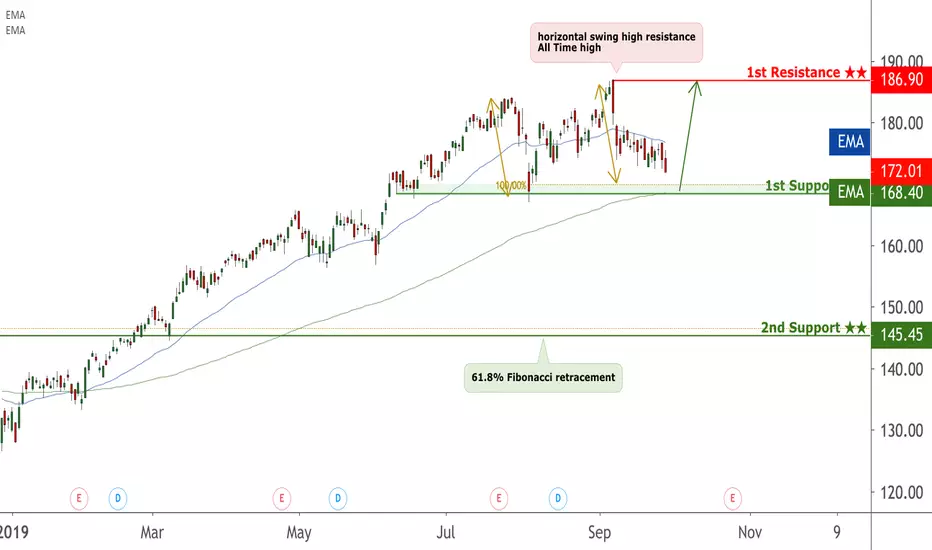
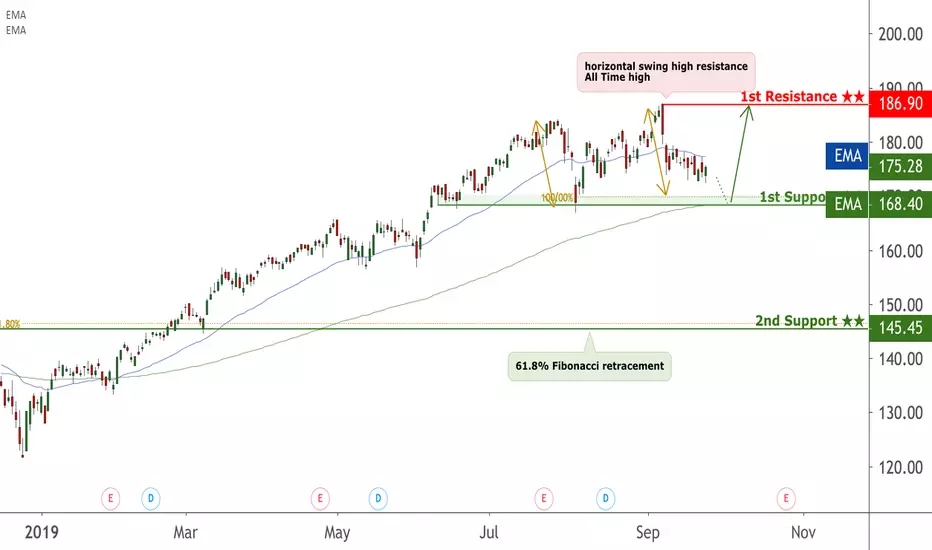
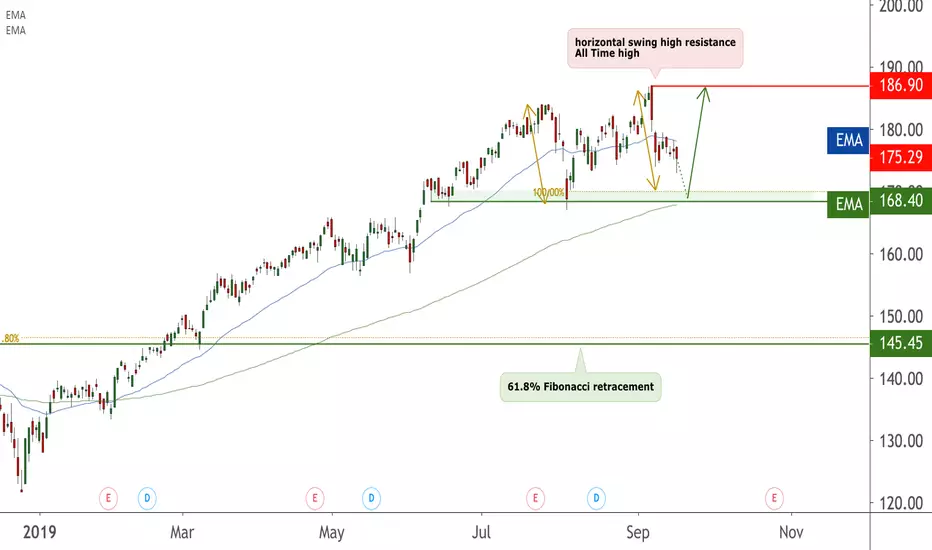
VISA is expected to drop to 1st support at 168.40 where it could potentially react off and up to 1st resistance at 186.90.
Trading CFDs on margin carries high risk.
Losses can exceed the initial investment so please ensure you fully
understand the risks.
Visa approaching support, potential for a bounce!
Visa is expected to drop to 1st support at 168.40 where it could potentially react off and up to 1st resistance at 186.90.
Trading CFDs on margin carries high risk.
Losses can exceed the initial investment so please ensure you fully
understand the risks.
Looks like $V is being supported by the 100MAIf you look back to Aug. 5th you can see that $V gapped down and was caught by the 100MA and for the past week it has been testing those levels again. I am looking for a month long call around the 185 strike range. I will continue to roll this position out if the price moves in the intended direction !


VISA approaching support, potential for a bounce!
VISA is expected to drop to 1st support at 168.40 where it could potentially react off and up to 1st resistance at 186.90.
Trading CFDs on margin carries high risk.
Losses can exceed the initial investment so please ensure you fully
understand the risks.


38.2% & POSSIBLE 61.8% Retracement LONG GWAVE38.2% & POSSIBLE 61.8% Retracement LONG GWAVE.
FIB Retracement Percentage is calculated in a Higher Cartesian and or Euclidean Dimension.
PLEASE ALWAYS WAIT FOR STOCHASTIC CONFIRMATION!!! THANKS

V long setuoV’s innovation outlook is trending up based on a current score of 74 out of 99, outperforming sector average. Jobs growth over the past year has decreased and insiders sentiment is negative. V is an Outperformer in terms of sustainability. It is most exposed to Apple Inc. as its supplier. Over the past 4 quarters V beat earnings estimates 4 times and it pays dividend lower than its peers.
For more analysis and articles visit our website .

VISA approaching support, potential for a bounce!
VISA is expected to drop to 1st support at 168.40 where it could potentially react off and up to 1st resistance at 186.90.
Trading CFDs on margin carries high risk.
Losses can exceed the initial investment so please ensure you fully
understand the risks.
$V Potential Short Swing Setup Forming I have been watching $V for a while now, along with $MA and some other major credit card companies.
In particular, $V is interesting to me because of its clear pattern in volume on the 1M chart:
On top of that, it is approaching this bear divergence line on the RSI:
While it is not there yet, the weekly is showing some signs on the RSI that a dive lower might be in order:
As we cross 20, it is likely we will close in on 0, and that could lead to some serious oversold levels on smaller time frames.
One other notable thing is that we are very close to the top of this expanding wedge, and have now seen some sharp selling after the last two thrusts on the weekly:
The 1D shows that we are right on the trend line, and if we fall, it will likely be sharp. RSI is also still a bit bearish here, having just crossed below 20 on the close today:
The 4H is just as bearish, with this dead cat bounce leaving us at a close on the trendline:
Basically, if this rallies off this trend line but fails to make a higher high before exhausting on the 1D RSI, or it plunges below, I think you are safe to open a short position.
With confirmation, I think you are safe to target the $166 and $156 price levels from here on the daily:


Visa (V) Buy Signal + New Analysis I like this chart. For those of you who follow me know that I only post the most high probability buy/sell signals with no biases to the long/short side. There is a lot going on in this chart and A LOT of confirmation as to a buy signal in Visa. First, look at the strong up bar Visa ended the day on yesterday on the hourly which is our 'signal reversal bar'. Also, I really like an hourly chart to show some timing analysis with fibonacci time bars and you can see the confirmation of the 144,89,34,21, and 8 (from prior high/lows) agreeing and showing confluence on yesterdays low. Here I also show one of my best secrets in using phi cubed or 4.236 from an initial impulse wave showing the maximum extreme of any given move. Here I show phi cubed as timing analysis, but I especially like phi cubed on the vertical axis. Lastly, take a look at the Gann arcs and fan lines of the square root of 2,3,4, and 5 (these really work well). I have only included 2 of my indicators, but all my indicators agree and you can see the extreme divergence from my Composite Index (top indicator) vs. the RSI (bottom)--with the MA lines at maximum extremes as well.
I hope you appreciate the geometric harmony of this chart as much as I. Make sure to follow me for additional analysis and new high probability setups as I am currently scopeing NKE and AXP like a hawk.
Happy Trading!
NYSE:V
