4V trade ideas

Popped yesterday, consolidated, now moving out of bull flag $V is wandering up and out of this zone. Lookin bullish

Visa V Short-term one year daily chart
Resistance
Level 1 - $145
Level 2 - $155
Level 3 - $170
Support
Level 1 - $130 Mild Strength
Level 2 - $120 Moderate Strength
Level 3 - $110 Mild Strength
Level 4 - $90 Moderate Strength
NYSE:V
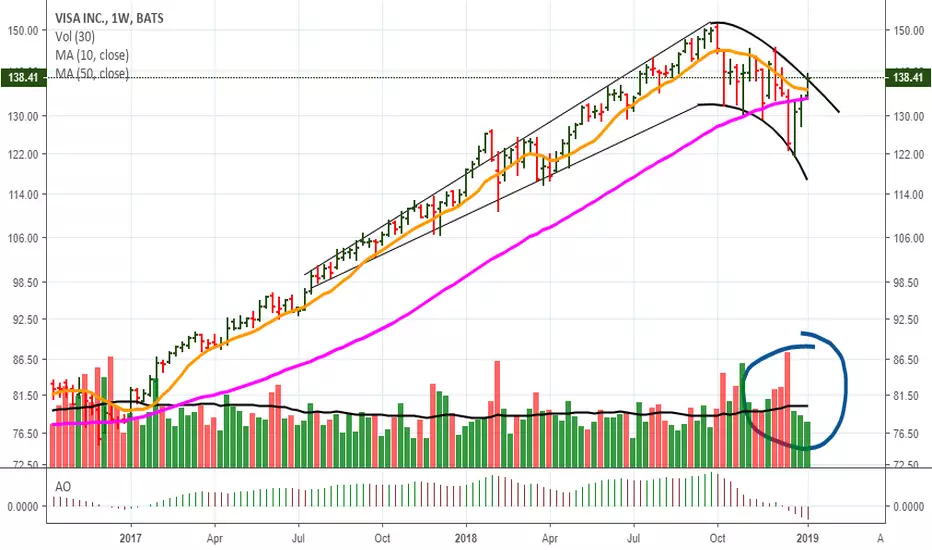
Long-term five year weekly chart:
Both charts show a similar pattern emerging.


VISA INC. (V): More Dips About To Come?Find Winning Trades In Seconds >> efcindicator.com (Special Discount)
The immersed crossing (white bar) indicated a strong bear flag, which was confirmed next. It seems that we have not yet reached the end of this correction.


V SwingMy quant model predicts
Profitability: it has a high probability(73%) to rebound at this level.
Worst Case: it could drop to $121.08
Money Management: Bet no more than 38% of capital
Suggested Strategy: long stock for 5 Days

Uphill Battle for VisaVisa has a lot of hurdles ahead if it wants to go higher.
A bear trend line has formed from the all-time high and the lower high on October 17th.
Today's high was rejected on the trend line.
Today's price also failed to break the upper heavy volume profile around $140.50.
Today's price was rejected at the 4hr 200 EMA.
The 50 EMA has crossed the 100 EMA.
Continued failure of the bear trend line shows that bears are in full control and there isn't a reason to be a buyer of Visa.
If this month's momentum continues downward and price continues to be suppressed under the recent bear trend line, the 2 year upward channel is going to be under attack. A test of the major upward channel will also line up with the 4hr 400 EMA and be near the low on the October 11th. If those areas don't hold the price, Visa is in big trouble since they would then become major resistance.
A failure of the major channel, recent low and 4hr 400 EMA could take Visa down to the low $120 range.
The $120 serves as a target for a few reasons:
It's a heavy volume profile area in the heart of the major flag from Jan-April 2018
The trend line from the top of the major flag from Jan-April 2018 would be retested.
A significant gap would be filled from late April.
All of this is pending the recent bear trend line doesn't get broken.
Price action up above the bear trend line means this play is no longer a short.
It would then become neutral until price tells us more information, first being if the 4hr 50, 100 and 200 EMA can be broken and held.
Then we wait to see if a new all-time high can be broken, tested and held.
A test of the all-time high is only 8% away. Not worth the risk at this point considering the downside potential.

Dow Stocks Visa (V)As a new company it is hard to see how the 08 crash can be translated , so I took Mastercard @ 50% and American Express @ 84%


Visa Critical Pivot PointCrypto Crusader here with another analysis on blue chip stock "Visa"
Visa, just like other technology companies (FAANG) included, has had incredible earnings for a long period of time. With the recent stagnation in earnings, projected slowdowns in revenue, on top of the growing trade war, the tech sector is facing an important decision. I'll preface this analysis by stating how the "smart money" has already exited their positions maybe 4 - 6 months ago. Big money is already out of the tech sector, and even though I may be setting up this analysis with a bias interpretation, I believe these points that I have brought up, and will bring up, are critical to have a rational understanding of the situation at hand.
From a technical standpoint, this is my opinion, and should be used simply as an educational tool only, I am not liable for my "opinion here"
This analysis will be brief, a beautiful doji is forming on the monthly time-frame, as well as, the weekly time-frame. Doji's often represent a pivotal moment in any financial vehicle, symbolizing indecisiveness in the asset at hand. A hidden divergence is appearing on the "RSI", and a divergence is beginning to form on the "MACD", all indicators of some hefty volatility in near future. The rectangular bars are support zones I believe it will hit, and subsequently, will break and form lower lows.
May the trades be with you,
Crypto Crusader


Visa, very large upside move possible soonGet ready for lift off. Inverted H&S pattern best viewed on the 4h chart. Visa may enter a Phase 4 of a Hyperwave. Check my page for more information on Hyperwave patterns, sustained, powerful move to the upside if it can enter a Phase 4.

Visa Long for the momentTarget on Monday Nov 26th is $136 for the time being. Looks like $118 is going to be coming soon though...

Sell the rips in $VHere is how I see it. $114-$118 level does not seem so unreasonable if this market really starts to roll over.


If it breaks up has room to runBack within bear flag. still cant break out, if does should run some but gap still below

