4WFC trade ideas

WFC 1HRBullish Crab
Price need to follow GREEN TREND LINE and hit Target 1 & 2 , else if Price BREAKS RED TREND LINE is EXIT
POTENTIAL BUY

WFC 45Min Bullish Crab
Price need to follow GREEN TREND LINE and hit Target 1 & 2 , else if Price BREAKS RED TREND LINE is EXIT
POTENTIAL BUY

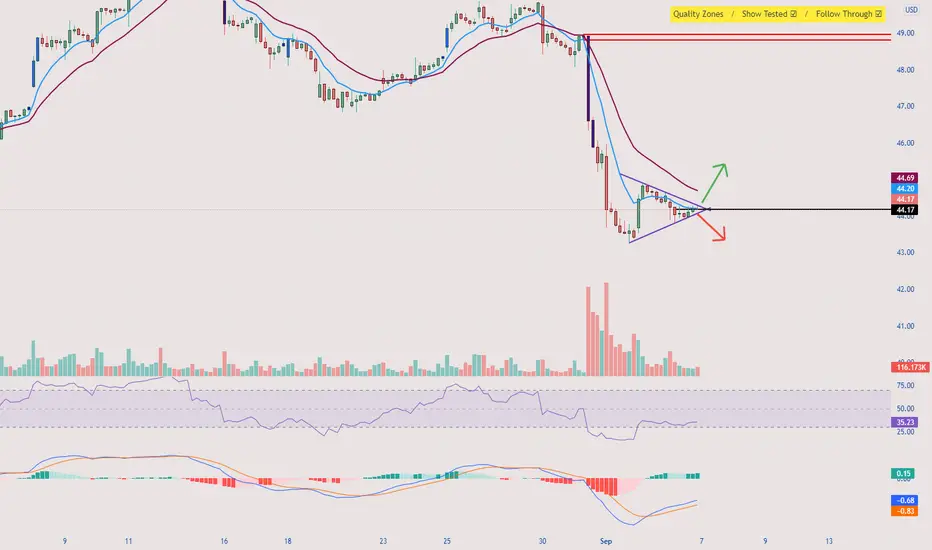
WFC Symmetrical Triangle, Ready to MoveLooks like WFC and the financials have finished taking their sweet time consolidating for the last few (3-6 months). Looking to push higher if 10-year rates continue to move toward 1.7-1.8%. Would like to see 52-54 by end of October-EOY.

WFC 2HRBullish Shark
Price need to follow GREEN TREND LINE and hit Target 1 & 2 , else if Price BREAKS RED TREND LINE is EXIT
POTENTIAL BUY

WFC is looking 📉Bounced today off Fibonacci support at 44.85. Showing a H&S here. if that support goes
200ma is the next support.
48.50 was tough multi year resistance it couldn't get across

WFC head and shoulders on weekly?Possible head and shoulders forming on the weekly. Break blue trendline for confirmation.

WFC Showing a bearish megaphone Heading back to 50$ then a return back to 45-46 in time for earnings. If it does fall outside of the megaphone I'm guessing they'll save it for earnings

Wells Fargo 210+ day Cup with a Bull Flag for a HandleWFC has been building a Cup and Handle on the Daily since approximately Feb 20th of this year. This cup also happens to have a bullish flag within the handle. Price has already broken out of the flag around 47.50, and subsequently broke through significant resistance around 47.80. WFC ended the day Friday 9/24 retesting this level as new support, and it is setting us up for a long entry toward the previous ATH just above $66.00 if we get a bounce on Monday 9/27. The breakout of TNX last week also signals bullish context for financials if it confirms a new trend to the upside. WFC is not a fast mover so expect it to take several months to get there! Happy trading!

Wells Frago: Setup looks goodFew trendline clustered at support zone. Lets see if the price can climb.

Not in the stock. Im a really ametuer so dont put anything this, dont buy og sell on my recomendations my own portfolio is down. :)

$WFC Wells Fargo Reversal Levels.
Hopefully you find the chart helpful in terms of Supports & Resistance etc.
we refrain from adding commentary on the chart as that is reserved for our members and we are very conscious of not giving financial or trading advice.
Thank you for taking time to consult our chart and we would really appreciate a like, follow or comment.

$WFC - Daily inside candles & hourly pennant, watch for breakout$WFC - Daily inside candles & hourly pennant, watch for breakout for calls or puts
Price action trade example..!Price action describes the characteristics of a security’s price movements. This movement is quite often analyzed with respect to price changes in the recent past. In simple terms, price action is a trading technique that allows a trader to read the market and make subjective trading decisions based on the recent and actual price movements, rather than relying solely on technical indicators.
Since it ignores the fundamental analysis factors and focuses more on recent and past price movement, the price action trading strategy is dependent on technical analysis tools.
Tools Used for Price Action Trading
Since price action trading relates to recent historical data and past price movements, all technical analysis tools like charts, trend lines, price bands, high and low swings, technical levels (of support, resistance and consolidation), etc. are taken into account as per the trader’s choice and strategy fit.
The tools and patterns observed by the trader can be simple price bars, price bands, break-outs, trend-lines, or complex combinations involving candlesticks, volatility, channels, etc.
Who Uses Price Action Trading?
Since price action trading is an approach to price predictions and speculation, it is used by retail traders, speculators, arbitrageurs and even trading firms who employ traders. It can be used on a wide range of securities including equities, bonds, forex, commodities, derivatives, etc.
Price Action Trading Steps
Most experienced traders following price action trading keep multiple options for recognizing trading patterns, entry and exit levels, stop-losses and related observations. Having just one strategy on one (or multiple) stocks may not offer sufficient trading opportunities. Most scenarios involve a two-step process:
Identifying a scenario: Like a stock price getting into a bull/bear phase, channel range, breakout, etc.
Within the scenario, identifying trading opportunities: Like once a stock is in bull run, is it likely to (a) overshoot or (b) retreat. This is a completely subjective choice and can vary from one trader to the other, even given the same identical scenario.
Now lets review my yesterday published analysis:
Wells Fargo may rebound soon!
Buy call 43, September 3, at 85-90 cents, target: 2 - 2.5, stop loss 60 cents.
Outcome of the trade: +100- 120% gain closed today!
this is the power of technical analysis and using this tool correctly
reference article:
www.investopedia.com

Where would do we bounce? I might go long around 43 if this regulatory nonsense feels like it wants to chill there
Thoughts?

ADD PURCHASES IN WFCthe stock is giving a pullback to continue going up, I plan to add more purchases

Elliott wave count indicator on WFC dailyWFC still in wave 5 unless it break trend line and wave 5 arrow disappear we can say that wfc in the correction

$WFC Breakout Pullback Setupand finally $WFC pulling back to breakout level as well. Plenty of BO/PB entries if the market finds its footings here.

Cup and HandleThis is a wide cup and the depth is 33.99.
Support under HL (handle low) which is at 41.42 and mid cup which is at 37.76
No recommendation.
The cup is easier to visualize in the weekly timeframe (o:

New Level : WFCMy Entry area.
RSI testing again the level of 50
EMAs on the right order and price approaching new highs.
In case the price moves up, I'll lock profits at 3%/7% then will swing following the most reliable EMA.


Trading Idea #WFC (LONG) 📈 58.50! (WellsFargo)👋 Hello Traders!
In this video, I analyzed #WFC in detail. I bring to your attention one of my orders.
📈 #WFC went down for a long time (MN1) and only in May WFC broke through the downtrend and formed a new uptrend. WFC completed the correction in June and broke through the new level 47.45. Now the WFC is going up to three levels 54.30, 58.50 and 65.35.
🎯 I recommend BuyStop 51.10 or BuyLimit 48.60 with SL ~ 42.00
✅ If you like what I do - put 👍 and subscribe ❗️
❓ I would be glad to see your comments, what do you think about this?
DISCLAIMER:
This idea is not a trade recommendation, it has an informational purpose. The trader independently analyzes and decides whether to use this information.

(WFC) What Goes Up, Must Come DownLooking for Puts in the coming days. Volume is decreasing and momentum is slowing down. Nothing runs up forever. It WILL consolidate. It's just a matter of when. And I think soon.
