USDSEK LONG Einstieg an der unteren Flaggenbegrenzung.
Ziel Ausbruch aus Flagge und mehr.
Einstieg: 10.26579
SL: 10.24986
Risiko: 0,31€
USDSEK
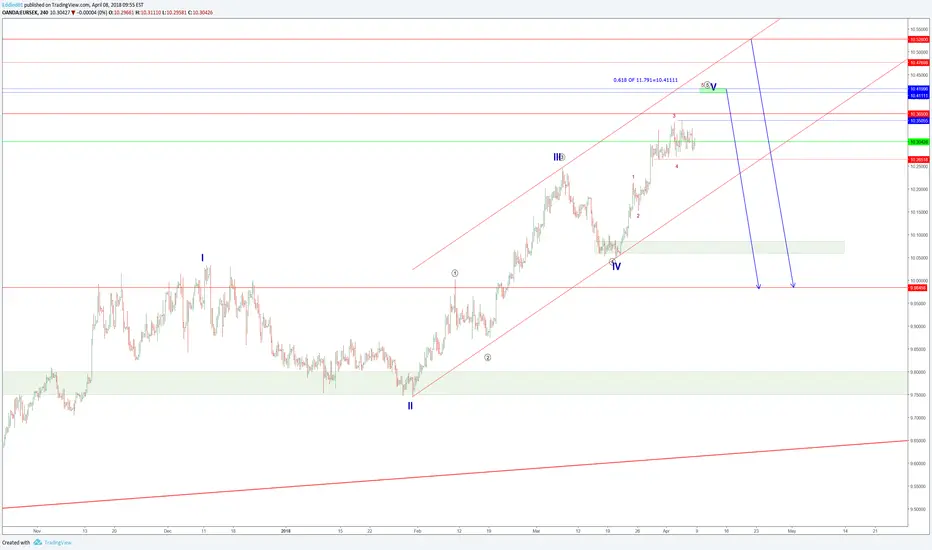
EURSEK trade ideas

EURSEK on a Pause Before a Possible Continuation of the ClimbCurrently EUR is on a pause after it took out the swing high. It usually takes 5 to 9 to 10 days for a strong asset to resume its climb so we may have 1 to 2 days more. We only look to go long as we want to trade with the trend. It's looking like a mini ascending triangle at the moment but it can morph if it does not breakout in the coming several days. If it breaks down we do nothing (we do not short) as it is trading against the trend. Note however that if it does attempt a breakout in the coming days the attempt may succeed or fail, but we are willing to risk capital especially if it breakouts on volume. But we must be very quick to sell if it falls back into the structure and NOT hope it will recover. When that happens we remain patient and assess as the chart evolves,always stalking it for another attempt at a breakout or a recovery on the recent failed breakout. This is why we need to be quick at exiting a failed trade so that we lose little and have capital preserved for the recovery or the next breakout attempt which may succeed.

EURSEKObserve the reaction at 10.41 which is a 0.618 retracement.
the top could potentially be between 10.45 & 10.52
See below for a weekly view
EURSEK - Daily - Keep your eyes on the rising wedgeTrade Alert!
Rising wedge, together with potential bearish divergence forming on the MACD.

Eur Sek ShlongAs you can see we had some nice action here with this SHS formation right at a rising trendline + a new formed s/r zone which pushed price to a new high here .
Now Price is running into another s/r zone which is not confirmed yet but i will look for a confirmed touch before taking a long .
On the other hand a break could lead to short in direction of the confirmed s/r zone below or maybe even to the trendline showing us another test

EUR/SEK 1H Chart: Approaches strong resistanceThe common European currency is trading in three channels simultaneously against the Swedish Krona. The dominant pattern which has guided the pair during the previous three weeks is a medium-term channel. Its lower boundary was tested on March 20 when the Euro reversed from the 10.05 level.
The rate has since edged higher towards the monthly and weekly R1s at 10.25. Technical indicators demonstrate that the pair might still appreciate during the following session. Gains in this case could be capped near the senior channel at 10.27.
However, the lost bullish momentum during the previous three sessions might mark the beginning of a new wave down. This scenario should be confirmed by a breakout of the 55-hour SMA near 10.19. A possible downside target within the following two weeks is the 10.10 area where the 200-hour SMA, the weekly S1 and the junior channel are located.


EURSEK long back to the topEURSEK looking to bounce on the trend line to continue up long. if it does break the trend then opportunities for short will arise

EURSEK Short OpportunityEURSEK has broken out of channel, allowing giving us a opportunity to short the market.
S/L: 10.23529
P/T: 10.00165
Market entered on the retest of the broken support now resistance.
As the market falls i will cover bring down the stop loss to minimize risk and will eventually be in a win win situation.
Keep your trades simple.


EUR/SEK 1H Chart: Some upside potential still likelyEUR/SEK is being guided by several patterns, the most important of which are two opposing channels. The Euro breached the upper line of the more senior pattern earlier in this session when a strong hourly surge allowed it to move past the 9.96 mark.
This upside breakout of the four-month channel suggests that the bullish sentiment might continue dominating the market in line with the junior formation. However, some minor correction south is still expected, as the pair needs to relieve its overbought pressure. A possible point of reversal could be the 55-, 100– and 200-hour SMAs and the 61.80% Fibo near 9.92. The nearest upside target within the following sessions could be the 10.03 mark.
Given that this is likewise the highest level in several years, the Euro is likely to surrender under the bearish pressure near this high and begin depreciating in the medium term.

EUR/SEK 1H Chart: Pair expects breakoutA falling wedge has guided EUR/SEK since mid-November. It seems that this pattern is gradually reaching its maturity, thus pointing to a soon breakout. Falling wedge is generally a continuation pattern that should allow the Euro to resume its previously-existing up-trend.
During this session, the rate was stranded between the 55-, 100-, and 200-hour SMAs and the weekly and monthly PPs. All these levels are providing strong barriers; thus, it is likely that the direction of the breakout would prevail for some period of time.
In case bulls take over the market, a near-term target could be the psychological 9.90 mark where the 23.60% Fibo retracement is located.

After finalizing XABCD pattern - formation of triple top (w)Long term (w): After successfully finalizing the XABCD pattern EURSEK has formed a tripple top with potential short set-up. Formation of three tops took 20 months, with middle peak below the other two. Confirmation of the set-up when the price closes below the lowest level valley in the pattern.

EURSEK short There is something interesting about this chart. GAP (green block) from Daily chart created quite nice support/ressistance area. I marked with two eclipses point where pair was rejected when in touch with this area. This price action is suggesting strong bear trend which should move pair towards south in the next month or more. I placed on the chart Fibonacci retracement and 61.8% stopped attempt to move north within the last month.
Eursek created double top on the big chart and also magic number 10 was reached but not breached and after consolidation around this number we can clearly see strong rejection.
It is wise to wait for the pair to go higher as it is trading on its support/ressistance and sell it when 200 Ema will stop Swedish corona value depreciation.


EUR/SEK 1H Chart: Pair trades in falling wedgeEUR/SEK has been trading in a channel up since late 2016. During its last wave down which started mid-December, the common European currency has likewise formed a falling wedge. It tested the bottom boundary of this pattern on January 5 and has since edged slightly higher.
From technical point of view, the Euro should approach the upper wedge line in the 9.87/89 territory. Meanwhile, the pair has been currently stranded between the 55-, 100– and 200-hour SMAs in a diminishing trading range. It is likely that a breakout from this area would determine the subsequent direction.
Technical indicators show that the southern barrier might surrender under the bearish pressure, thus possibly sending the Euro down to 9.74 area where the monthly S1 and the weekly S2 are located.
An upside breakout, however, could result in a test of the 9.89 mark within the following week or more.

EURSEK Lets short it for 1500 pips!Trading method: RSADVANTAGE Stage 5, accurate system manually forward tested over 3 years designed to stay out of ranging markets and only target strong trends suited for swing trading. This system is made of custom adaptive volume indicators and Oscillators that properly detect trends very early and provides exit signals at dynamic S/R zones once the trend has ended. // Average yearly pips gained is 40k per pair on D1 charts alone. I have provided a similar limited version of the system on Trading view to help traders visualize the strategy.
EURSEK
To open SHORT positions for EURSEK , it is required:
In this situation our system indicators to confirm trade entry confirmation for movement to the downside but if the market trend continues to range this signal will become invalid. Market execution for entry, I will confirm signal once the conditions have been met.
Risk Description: Once signal is confirmed we will excecute more positions on the position on H1 and 30M charts. Minimum 1500 pips will be up for grab with small risk SL at swing high. Target 2500 pips
Profit expectations: 1-4 day trade length expected before hitting profit target I will post exit strategy when signal receives a exit signal.

EUR/SEK 1H Chart: Rate weakens from yearly peakThe common European currency has been appreciating steadily against the Swedish Krona since early September.
This movement north has allayed during the past three weeks, as the rate has been lingering slightly below the 2010-2017 high of 10.03. This peak was reached on December 12, and the Euro has since edged lower. The same bearish sentiment is likely to prevail during the following weeks, as well.
Even though technical indicators point to a possible increase in price in this session, gains are unlikely to exceed the aforementioned high. In addition, the pair faces the combined resistance of the 200-, 55– and 100-hour SMAs and the weekly PP that could hinder or even halt any intentions to push higher.


EUR/SEK - The Long Road Back To 10 PointsTraders, we have a set up on EUR/SEK on the 3H chart, with a cycle pattern buy. (Three drivers pattern).
When analyzing this chart, I discovered that price appears to be moving in patterns. Price has an impulse leg, and then has a corrective leg, and then has a new impulse leg that measures the same size as the previous one.
When analyzing the chart, I started by measuring the first impulse, I discovered that the price correction seemed to hit a Fibonacci retracement, there was a new impulse leg. Price has recently been impulsive and has been showing signs of more uptrend. Sure enough, when I measured the second impulse leg, it was the exact same measurement as the first impulse.
I am expecting an up move up to the Cycle #3 completion, which exactly coincides with a historical high to the EXACT pip! Coincidence?
Do remember that before price completes Cycle #3 it will likely correct, so it's important you watch this trade carefully before considering a position.
I will be posting updates on this trade below, so leave it a like & follow so that you can keep up to date with this analysis.
