EURSEK - retracement towards cloud before long tradeLong trade in sight but not before the pair produces a retracement towards the cloud. It will be supported by the Kijun and the flat SSB + a thick cloud. General Ichimoku : lagging span above price, above cloud = bullish. Price is above its cloud and consolidating a bit (green candle, followed by an immediate "counter" red candle)
This pair is volatile with long wicks, therefore I fired up my own (stupid) indicator "Wicks" that shows the height of each wick. This is an extra guide for the stop level (you could use Bollinger for that as well). 246 pts was the longest bottom wick since 22 Jan. I can share the code if anyone interested.
EURSEK trade ideas

EURSEK - Decision to break or keep trendingEURSEK has arrived at a trend channel top and a resistance level. It looks like it wants to break out, so watch for that. In that case the target would be the next resistance around 9.39. There have been earlier fakeouts, so would give it a day or two closing above the trendline around 9.3.
If EURSEK does not break out in the next days then it will probably just continue the trend channel down to around 9.1. In that case a short around 9.25 would be in order.

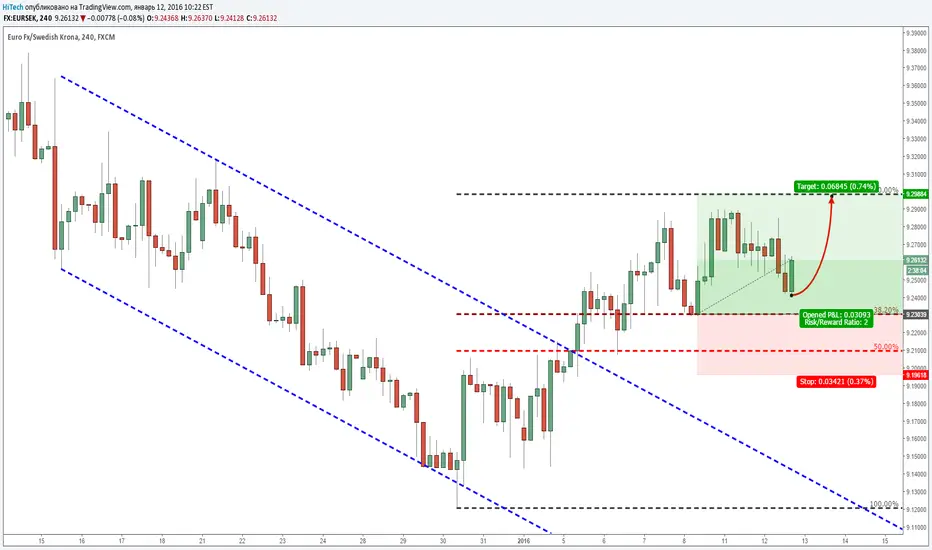
EURSEKThe pair is outside of the Bollingers, not much upside and longterm trend down. Good risk reward to short.


EURSEK - long (short-term). PA above Kumo, waiting for KijunFirst of all, essential information that affects this pair:
Central bank officials have tried talking the currency down to little avail. The central bank warned on December 30 that it could intervene. At the end of last year, the euro was at eight-month lows against the krona (`SEK9.12). The Riksbank is steeping up its efforts. (www.marctomarket.com)
See also: www.reuters.com
But meanwhile for the next days....
EURSEK is entering in bullish area where buy trades could be fillled. The PA must break the 9.28 level first. It is also necessary to monitor the Kijun as its exit from the cloud (Kumo) will be an additional signal for a long entry. The lagging span is also interesting as it is bouncing against a trend line shown in blue.
Hope you enjoy. Thumbs up if you agree, thanks.


EUR weekly complexThose who follow me, know my concept pretty much by now. So this time I would not write too many details, just would give an idea about strategies on each pair.
EURUSD - I stay rather neutral, keep really small long still with 1,1050 ultimate stop.
- discussed in prev. post (pls see link below)
EURGBP - Brittish pound lost its power.
- I'd go long, but only on pull backs, as we have massive weekly resistances above Price (Kumo and trendline)
- If we see a pull back to 0,71-72 area, I will look for bullish signals on both daily and weekly time frames.
EURNOK - Weight up Norway. This pair is too stretched, go counter short in half risk unit.
- As discussed yesterday, pls see link below. I expect pull back here.
EURSEK - Bullish biased
- I do not really like to trade SEK, but here I'd still buy on dips.
- Riksbank is trying to use all possible tools to weaken the Krone. They also see 9,30 is the level to "protect". Below that it would be a strategic bearish reversal
- Maybe try to catch some NOKSEK longs as relative value trade
EURAUD - It is all about China, technically consolidation or pull back is possible.
- Trend and setup is bullish, but Price is too far above 1,5130 Kijun Sen. Also Heikin Ashi candles show the loss of bullish momentum in last 2-3 weeks.
- I think there is some chance that we see some pull back towards 1,54-1,55, or that it builds a top consolidation zone between 1,55 - 1,62
EURCAD - Undecision in WTI mkt -> consolidation in CAD
- Picture of CAD as the other commodity ccy is pretty similar to AUD, except that it has not been hit so badly ("only" to reach a double top at 1,55+)
- Further price action depends on Crude and also on BoC... who knows if they shoot anouther ccy war bazooka like Norges Bank did last week. Anyway, looking purely at technicals, the Ichimoku setup is bullish, but consolidation or pull back is due, given that Price is too far away from Kijun Sen.
- If we see momentum exhaustion and if it breaks below weekly Tenkan Sen (1,4880) then I think has chance to retest 1,45+. However 1,43 has become a very strong support b now.
So the recommendation regarding each ccy weight:
USD - neutral
GBP - short on dips
NOK - Increase exposure (means small counter short EURNOK)
SEK - Neutral, small short (means small long EURSEK or small long NOKSEK)
AUD - Increase long from neutral / decrease short exposure (means small short EURAUD on spikes)
CAD - Increase long from neutral / decrease short exposure (means small counter short EURCAD, increase below 1,4880)

Target reached again!Buying the Retest was a good idea! Now the Pair nearly has reached the bottom edge of the longterm trendchannel. This could be a niveau, where a consolidation can start. For those who want to hold the Pair a bit longer, a stoploss-adjustment makes sense.
Former Analysis:
Buying the retest
The pullback ended @ the old breakout Level. A new Long Chance?
former view:
After the break of the longterm uptrend @ 9,33 in march EURSEK is consolidating this strong sell-off and reached several times its maximum correction level (fibo 62,8%).
This strong resist @ 9,4 seems to be invincable. 6 times you had the chance to fix that level sucessfully. Is it time for the next short position? The chance-risk-ratio is wonderful again , nearly 8:1!
But beware!
Above that resistance a fast shortsqueeze can be exspected. All people who fixed that level (short) have to cover their positions then an switch to the buyers :-) A first target on the upside could be the longterm-uptrend lower edge which turned to a rsistance zone.

Buying the retestThe pullback ended @ the old breakout Level. A new Long Chance?
former view:
After the break of the longterm uptrend @ 9,33 in march EURSEK is consolidating this strong sell-off and reached several times its maximum correction level (fibo 62,8%).
This strong resist @ 9,4 seems to be invincable. 6 times you had the chance to fix that level sucessfully. Is it time for the next short position? The chance-risk-ratio is wonderful again , nearly 8:1!
But beware!
Above that resistance a fast shortsqueeze can be exspected. All people who fixed that level (short) have to cover their positions then an switch to the buyers :-) A first target on the upside could be the longterm-uptrend lower edge which turned to a rsistance zone.

Short again or explosive Break-Out?After the break of the longterm uptrend @ 9,33 in march EURSEK is consolidating this strong sell-off and reached several times its maximum correction level (fibo 62,8%).
This strong resist @ 9,4 seems to be invincable. 6 times you had the chance to fix that level sucessfully. Is it time for the next short position? The chance-risk-ratio is wonderful again , nearly 8:1!
But beware!
Above that resistance a fast shortsqueeze can be exspected. All people who fixed that level (short) have to cover their positions then an switch to the buyers :-) A first target on the upside could be the longterm-uptrend lower edge which turned to a rsistance zone.

EURSEK - Perfectly neutral, with some short term bullish biasWeekly:
- This is the 14th week with no trend! Price is stuck in a 2,5 %+ wide range between 9,20 - 9,42
- Ichimoku setup is absolutely neutral, Price is almot in the cloud and trades ard 9,35 equilibrium level (52 weeks average!). Tenkan is below Kijun, both lines are flat and about to enter the Kumo, future Kumo is flat too (basically Senkou A and B are at same level). Chikou Span hits past candles.
- Heikin Ashi signal is neutral, it is a row of candles with both long upper and lower wicks and small bodies. The small candle bodies changing colour too often, and haDelta/SMA3 doesn't have any indication about possible direction either, as it is stuck close to zero line.
This is the perfect Neutral setup, the worst for trend traders, and the best place for range players... until it breaks out on any side of the range.
Daily:
- Ichimoku setup is neutral, price has been swinging around the Kumo and Kijun Sen. Tenkan/Kijun gives a lot of late and unreliable signals. This is a perfect example to show you how a real trend following system doesn't work when the instrument is not trending. For example that's one reason why I like to add Heikin Ashi as a filter. That works in mini ranges too quite properly.
- Heikin Ashi candle today shows some undecision, haDelta/SMA3 is trying to cross up again and move above zero line. Since we have both Tenkan, Kijun and the Kumo below Price as support/resistance, with this Heikin Ashi signal we can assume a bullish move from the 9,35 equilibrium is more likely, at least in short term.
Really bullish breakout would happen with a close above 9,45.
p.s.: I opened small long (0,5 trade unit) today morning. Stop is below 9,2850. On a break and close above 9,45 I'd increase the position if new bullish trend develops.

EURSEK - Update / Ketchup. Sell, Sell, SellWell, EURSEK should really catch up (down) to other EUR crosses, and finally it looks like the move has started.
Weekly:
- Ichimoku setup is neutral with bearish bias. Kumo overshades Price, Chikou Span hits candles, Tenkan/Kijun is weak bearish. Price turning down after retesting weekly Kijun Sen. Current Kumo is still a bit thick below Price. Supports are at 9,23 and at 9,10
- Heikin Ashi signal is bearish again.
Daily:
- Ichimoku picture is turning back to bearish. Selling pressure can increase below Kijun Sen 9,2250.
- Heikin Ashi bearish signal is confirmed today with a big body candle which finally broke the 9,30-9,31 resistance zone. haDelta/SMA3 down below zero line.
Strategy is to hold short position and increase shorts in spikes!

EURSEK - Bearish Beginning ?Since I am in Sweden, I was just checking out their currency correlations.
Obviously EUR out performed SEK. But what just happened, Seems like, SEK is gaining strength. Can someone from Sweden Explain what's happening. Just Curious.
Thanks
UCS

EURSEK - "Update" / Super boring, but maybe it starts to moveWhile the EUR is under pressure on all crosses, EURSEK is simply not reacting.
Daily:
- Consolidation at the equilibrium level (at Senkou B)
- Price still needs to break below Tenkan Sen at 9,3225 to be able to resume bearish
4H:
- Still moving sideaway in an extremely thin range
- Heikin Ashi signal turns bearish. Question is if it can finally stay bearish or not?
- We need some bearish confirmation in DMI/ADX
Simply sell below the Kumo (9,3225-) with stop above 9,39, initial tgt 9,15

EURSEK - Small QE vs Big Q should push it lower againWeekly:
- Ichimoku setup is rather neutral: Price is still above Kumo, just retested Kijun Sen. Chikou Span is about to hit Price candles. Strategic bearish reversal would happen below 9,10-9,15.
- Heikin Ashi candle pattern shows a corrective pull back for the last 4 weeks, but Kijun Sen seems to act as bearish support and also haDelta/SMA3 gives some early indication that the correction may end soon.
Daily:
- Ichimoku setup is neutral, actually as price shooted higher than I previously expected, the Chikou Span and Tenkan/Kijun even started to show some bullish bias, but this signal is confusing a bit as Kijun Sen still points down, while Tenkan Sen points up (I do not consider this signal as a reliable weak bullish Tenkan/Kijun cross).
- Heikin Ashi candles yesterday and today signal loss of bullish momentum or possible bearish reversal. Lower supp/res levels to watch: 9,32 / 9,22-9,25
4H:
- Ichimoku setup is turning to neutral.
- Heikin Ashi signal is turning to bearish.
- In fact, price should break trendline, Kumo and 100 WMA levels at 9,32- to give a reliable sell signal.
Sell some now, sell more below 9,32.

Eur/Sek Dobell conformationDobell break true conformation, entry when starting to trade under the 200 sma. For strong restiance,
Witch also is in alignment with the 38.20 retracement level. Should give a nice downward move. Stop loss just above previous high.

EURSEK - Update / Possible Short entry below Kijun SenDaily:
- Watch Daily Heikin Ashi candle today, as it already looks like buying power is decreasing. Candle may have an inside body.
- haDelta/SMA3 has bearish divergence and a bearish cross. Watch zero line.
- If Price breaks back below daily Kijun, it will be a clear sell signal.
4H:
- 9,3500+ seems to be a bit of a hard barrier for bulls. Price is still stuck in a range
- DMI/ADX shows undecision (counter trend lost momentum)
- Lower supports to watch are: 9,3125 / 9,2750

EURSEK - Correction may end soon. Join the trend againDaily:
- Price is still below the Kumo. Price retested Kijun Sen six times (!), but none of the last six candles could close above the 26 days average. Previous horizontal resistance acts as support now ard 9,32.
- We have the second doji-like Heikin Ashi candle with long upper and lower wicks, haDelta/SMA3 further down. There is a good chance that the correction will be soon over and Price starts moving lower again from bearish support, in line with the bearish trend.
4H:
- The pair is sufferring to print higher highs, if there will not be a higher high, Ichimoku setup can lose its bullish bias with the next price dip. Chikou already hit candles.
- DMI/ADX shows momentum is lost, no trend
- Heikin Ashi picture is mixed a bit, candles do not show clear direction, but haDelta/SMA3 looks a bit more bearish again.
- Lower support to watch is 9,2425. A break below that could bring new selling pressure.

EURSEK - It is not that easy to break a trend. Pause nowWeekly:
- The steep trend channel is broken, but the Kumo still acts as support. For a long term weekly bearish reversal 9,05 will have to be broken.
- weekly haDelta reached extreme low and now is turning up above its SMA3. The week has just started, but as the previous candle had a very long body and a deep low on its wick, this week the candle body will likely be an inside body. After all we may see a few weeks sidaway trading or some pull back upto previous support (now as resistance) area 9,28-9,32
- Later we may see a head and shoulders patterns to develop, an in case Price stays below 9,40, we'll have to check sell signals to enter short to catch a possible longer term downtred
Daily:
- Ichinoku bearish setup is active. Bearish support is at 9,31-9,34
- Heikin Ashi candle changes colour after printing a doji on friday. haDelta is higher, Oscillator changes to bullish. This is a signal for either some sideaway move of some pullback to bearsih supports before the next sell wave in the downtrend.
For now it is recommended to take profit on shorts (at least partially), and wait for better opportunity to re-enter bearish position at higher Price level.
Bravehearts can buy small counter long with tight stop (not lower than 9,08). I will stay neutral for now.

Trend Change for EURSEK ?Sweden shocked markets with a higher GDP than expected , which resulted in a bullish SEK. Technically , EURSEK is below Kumo Cloud which favours the downside. Open shorts with SL above 9.435 on a daily close

EURSEK - HA candle switch in the KumoDaily:
About two weeks ago EURSEK attempted a bearish Kumo break, which couldn't be succesful, as then the Kumo was too far below Price and relatively thick. Then we had a reversal signal and we saw a pullback to the Kumo, which now seems to act as a strong support/resistance. Now we have a new Heiken Ashi signal at the Kumo, calling for a possible bearish resumption.
- Slow Stoch sell signal, MACD couldn't really march higher, probably developing a bearish divergence.
- Price is trading in the Kumo, a touch above Kijun Sen. Let's say Price is at equilibrium.
- Tenkan/Kijun couldn't make their weak bullish cross.
- Very important Heiken Ashi signal today! Small red body with upper and lower wicks + haDelta cross below SMA3
It is time to close longs if someone has been bullish on this pair, and time to start to build bearish positions. For a bearish confirmation we should see one more red candle with no upper wick and obviously a cross below Kijun Sen.
4 Hours:
More signals lining up here as well suggesting a possible end of the bullish counter trend.
- Red HA candles, however now short term turning neutral again with Price trading at 4H Kijun Sen (support until broken)
- Chikou Span losing its open space, DMI crossing bearish with dropping ADX (-> bullish bias is out)
- haDelta cross below SMA3, and the cross may send both lines further below zero level.
- Ichimoku and trend setup is still bullish, so what we have to watch for now is if EURSEK can print a higher high above 9,50? If it can not, then we will slowly see breaking of lower supports (trendline, Kijun and probably later the 100WMA and the Kumo)
Strategy: Cut long, start building shorts on spikes. Stop for short positions need to be placed above 9,5350.

Inminent breakout on EURSEK ?We could see an inminent bullish breakout today at NFP´s . Adjust Stop below 9.37 . It price reverses today below mentioned level I will turn bearish till 9.25 .
