Sweden’s central bank announcementEarlier this month, Sweden’s central bank announced that it will be expanding its quantitative easing program. The news ultimately weakened the run of bearish investors in the trading sessions. However, bulls didn’t immediately take control of the pair as the euro also faced headwinds then. Luckily for them, the direction of the pair is looking pretty bullish once again thanks to the strong investor confidence in the eurozone. The euro to Swedish krona exchange rate’s prices are now widely on track to reach their resistance soon. Looking at the chart, it appears that the Swedish krona first had a grip on the pair. Although bears ultimately lost control, allowing bulls to regain their footing. If the pair climbs towards its resistance, bulls will once again force the 50-day moving average higher towards the 200-day moving average. But as of writing, the pair is in bearish territories considering that the 200-day MA is still dominant.
EURSEK trade ideas


SELL EURSEK Sell EURSEK, below the low of the previous candle. Price with strong momentum down tryed to go up and now is going down again.


EUR/SEK at Good Support LevelHi Fellow traders.
I expect the market to turn once reach the strong support Level.

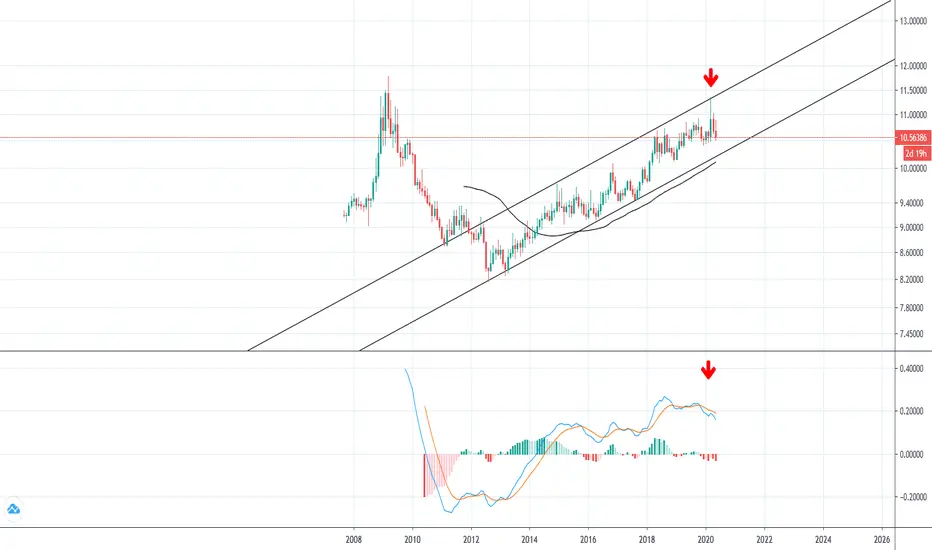
HeadShoulder - Hombro Cabeza Hombro // EURSEK In the EUR SEK we can see how the price has broken the bearish guideline that united the decreasing maximums and leaving us with a clearly bullish minimum.
The price appears to have encountered resistance at 10.57 which previously worked as a support.
If we analyze the price structure we can see a possible head-shoulder. For the structure to be confirmed, the price must first pierce and close above resistance (10.57).
If we project the structure it gives us a target close to 10.89 and placing a stoploss below the resistance 10.53 by itself, the resistance works as a high part of a channel.
En el EUR SEK podemos ver como el precio ha roto la directriz bajista que unía los máximos decrecientes y dejandonos un mínimo claramente alcista.
El precio parece haber econtrado una resistencia en 10,57 que anteriormente funcionó como soprte.
Si analizamos la estructura del precio podemos ver un possible cabeza hombro. Para que se confimre la estructura es necesario que el precio primero consiga perforar y cerrar por encima de la resistencia (10,57).
Si proyectamos la estructura nos da un objetivo cercano a 10.89 y situando un stoploss por debajo de la resistencia 10.53 por sí la resistencia funciona como parte alta de un canal.

ridethepig | EURSEK ST Micro Flows 2020.12.06We are entering into short-term technical flows for the weekly closing range after Fed flows come to an end. The growing concerns over rising virus cases will skyrocket over this weekend, expecting a flooding of negative news from mainstream media which will put Western European countries back into the crosshairs.
For the technicals, SEK is trading at a very low value the 2020 macro range called at the end of last year. Jurisdictions are clearly defined on both sides with support located at 10.4x and no interest in chasing this move any higher than 10.6x resistance .

The EUR/SEK will fail to breakout from a downtrend channel resisThe pair will fail to break out from a downtrend channel resistance line, sending the pair lower towards its previous low. Sweden recorded coronavirus infections more than the total cases reported from other Nordic countries. This was due to its decision to keep its economy and borders open and to develop herd immunity among its citizens. Meanwhile, the Swedish government’s refusal to lock down the country resulted in its GDP staying in green territory. Sweden’s first-quarter GDP YoY saw growth at 0.4%. Analysts are expecting Stockholm to report negative gross domestic product results for Q2 as the lockdown in the EU infected its businesses. The EU was the second epicenter of the coronavirus pandemic after China. Most of its member states already lifted several restrictions to recover revenue losses during the lockdown. However, a robust recovery is not expected as the EU’s economy is already struggling prior to the pandemic.

ridethepig | Remaining Short EURSEK A timely update to the EURSEK chart with 2020 flows entering into play as widely anticipated. Lets start by reviewing the concerning Macro Map in the diagram:
In the longer term, positional swings come down to a struggle between patience on the one hand and greed tendencies on the other. In this all-encompassing battle, economic strategy, though important in itself, will always need the presence of technicals in order to strive for mobility.
I am expecting sooner or later the free-fall to begin and get rid of the early dip buyers.
Good luck all those on the sell side. As usual thanks for keeping your support coming with likes, comments and etc!

TOTAL MARKET OVERVIEW STOCKS AND CURRENCIES| TRADES & ANALYSISLike, subscribe and comment. I really appreciate!


EURSEK strong rejection is expectedon DAILY: EURSEK is sitting around a strong support and resistance zone in blue so we will be looking for objective sell setups on lower timeframes.
unless price breaks it downward aggressively, then we will be looking for objective sell setups on its retest.
on H4: EURSEK formed an objective channel in red, so we are waiting for an objective break above the last swing that forms around our upper red trendline to buy this pair.
on M30: EURSEK also formed an inverse head and shoulders pattern, so we are waiting for a momentum candle close above our neckline to buy. (conservative traders should wait for the buy from H4)

EURSEK Buy SignalPattern: Testing the 6 month Support.
Signal: Bullish as the RSI and the 2018 fractal indicate a potential rebound here.
Target: 10.8000 (just below the 0.786 Fibonacci retracement).
** Please support this idea with your likes and comments, it is the best way to keep it relevant and support me. **

EURSEK STRUCTURE LONG The pair has reached a key structure level on daily, and a bounce up is reasonable to expect.
There was a nice consolidation inside the structure, a breakout, and a retest. A good long with a decent risk reward.
The stop is below the consolidation support. Targets are meaningful resistance level.
Guys, like, subscribe and comment! I appreciate every effort!
Wish you best of luck in your trading.

Daily watchlist candidate for SEKEUR:shortHello world,
and another watchlist candidate for this week.
Theory:
Reversal at weekly resistance line.
What we have:
- overbought RSI
- MACD signaling trend change
- long term trend: SHORT
- wykoff expansion phase (long term)
- multiple rejections at weekly resistance line (red)
What I am waiting for:
- price action at resistance line
- smaller candles indicating momentum loss
- break of shortER term trend line (green)
Happy for any feedback.
All the best,
c4ss10p314

Bulls were able to force a reversal and seize the momentumAfter reaching its support level in the previous session, bulls were able to force a reversal and seize the momentum to recover their losses. The pair now has a bullish trajectory and signs say that it’s heading for its resistance in the first half of the month. As of writing, investors of the Swedish krona are causing the pair to steady as they wait for the upcoming consumer confidence, manufacturing confidence, and retail sales figures from Sweden scheduled today. Aside from those, bears are also hoping to see better than expected results in the Swedish gross domestic product report that is also scheduled to be released tomorrow. That would strengthen the Swedish krona and give a tough time for the euro. On the other hand, the main factor that is supporting the single currency is the recent news about the European Commission’s plan for the post-coronavirus recovery funds. According to reports, it will be worth a staggering 1.85 trillion euros.

EURSEK potential bullish reversalon WEEKLY: EURSEK is overall bullish making higher highs and higher lows, and it is currently sitting around our lower blue trendline so we will be looking for objective buy setups on lower timeframes.
on H1: price formed an objective wedge pattern in red, so we are waiting for a momentum candle close above its last swing standing to buy.
we also have divergence on MACD adding more confluence to our setup.
