EURUSDHello Traders! 👋
What are your thoughts on EURUSD?
EURUSD has pulled back to the broken trendline and is now trading below a key resistance zone.
As long as the price remains below this resistance, we expect a short-term decline toward the specified support level.
The rejection from this zone suggests a possible continuation of the down move.
However, if price breaks and holds above the resistance zone, the bearish outlook will be invalidated.
Don’t forget to like and share your thoughts in the comments! ❤️
EURUSD trade ideas

Best Practice: Prepare, Assess, Plan Then TradeTraders are often eager to jump straight into the next trading session but this may not always be the best option to chose. It can be more beneficial to follow a regular pre-trading routine to note down important scheduled events, establish current trends, as well as meaningful support and resistance price levels, and importantly this doesn’t have to be time consuming.
This is not meant to be that trading ‘holy grail’ but more of an addition to your existing trading process or plan. Having a regular routine to establish important levels, indicator set-ups and price trends to be aware of during your trading day may help you make trading decisions in a more effective way.
This pre trading routine can also be helpful for traders that take longer term positions, as it’s still important to consider the longer-term weekly perspectives as well.
This routine can be carried out at the weekend and then monitored and, where necessary, modified during the week as price action develops for the particular CFD(s) you are trading.
1. Keep Informed of Important Data Releases
If there are several CFD’s you regularly trade and tend to stick with, make sure you have as much information about those assets as possible before you start trading.
Consider utilising the Pepperstone trading calendar to help keep you informed of any economic releases/company earnings data that might impact the CFD you are trading before the week/session starts.
Once you know the scheduled events ahead, you can ask yourself,
Could these impact my trading?
Could the market reaction to this new information increase the volatility of the CFD I am about to trade or already have a position in?
How may this impact my risk?
Knowing what it is expected by the market before a particular important economic data release, such as US Non-farm Payrolls, can help you assess positioning going into the release, gauge market reaction to the data, and then be prepared for any potential price sentiment change and/or increased volatility.
2. Be Aware of Potential Support and Resistance Levels
Ahead of your trading day, consider running through the Pepperstone charts of the CFD’s you are considering trading and make a note of 3 support and resistance levels, that you identify as being meaningful. To help you we have set out an example Trading Template below.
Daily: Level: Reason: Current Trend: Current Thoughts:
Support
1st:
2nd:
3rd
Resistance
1st
2nd
3rd
Keep this next to your trading screen, so you are aware of particular levels that may act as support and resistance, if prices move in that direction. This can help you to improve trade entry or assist you with the placement of a stop loss or take profit order.
If these levels are broken at any time, you can update the template with any new support/resistance levels during the trading period.
3. Be Aware of the Daily Trends – Focus on Bollinger Bands
Using the direction of the daily Bollinger mid-average can be helpful to gauge the direction of the daily trend.
If the,
Mid-average is moving up = price uptrend
Mid-average is moving down = price downtrend
Mid-average is flat = possible price sideways range
The daily and weekly perspectives are the most important to be aware of, so it can be beneficial to analyse the charts from the longest timeframe into the shortest as this allows you to build a better understanding of the dominant trends.
You can also note these trends on the Trading Template, so it’s available to you when you are trading.
4. Follow the Same Process for All Other Timeframes - 4 Hour, 1 Hour, Even Shorter if it Suits Your Trading.
You can carry out the routine outlined in point 3, for any timeframes you are trading.
Things to note,
Are there any new trends suggested within a shorter term perspective by the Bollinger mid-average?
If the direction of a shorter term mid-average has changed, it may be an indication of either a change or resumption of a longer term price trend.
If this trend change also looks to be resuming within the longer term perspectives, this could be a more important signal, as the resumption of an existing longer term trend may mean a more extended move in that direction.
Be aware, confirmation of a price trend change within a longer term perspective might mean it could take longer and offer less trading opportunities, as initially price moves may be less aggressive in nature.
5. Where, Within the Various Timeframes is Price in Relation to the Bollinger Bands?
As we have highlighted in a previous commentary (please take a look our past posts), Bollinger Bands can highlight increasing price volatility within a trend.
Things to note regarding Bollinger Bands,
Are the upper or lower bands being touched by prices within any of the timeframes?
Within a sideways range (flat mid-average) this might suggest price has reached either a support or resistance level, with potential for a reversal.
While being touched, are the upper and lower bands starting to widen which indicates increasing price volatility, or contract, which indicates decreasing price volatility?
Remember - widening bands within a confirmed trend highlight increasing volatility, suggesting the current price move might continue for longer than you may anticipate, while contracting bands, point to decreasing volatility, which may lead to a reduction in a particular CFDs price movement.
Do the timeframes align?
If they do it may suggest a stronger trading opportunity is evident. CFDs within trending markets seeing increasing volatility tend to offer greater potential than those that aren’t.
In this scenario it maybe worthwhile considering only trading with the trend, not trying to pick bottoms or tops of markets, or if you do, consider a more cautious approach to your trading by reducing the size of your position and risk.
The material provided here has not been prepared in accordance with legal requirements designed to promote the independence of investment research and as such is considered to be a marketing communication. Whilst it is not subject to any prohibition on dealing ahead of the dissemination of investment research, we will not seek to take any advantage before providing it to our clients.
Pepperstone doesn’t represent that the material provided here is accurate, current or complete, and therefore shouldn’t be relied upon as such. The information, whether from a third party or not, isn’t to be considered as a recommendation; or an offer to buy or sell; or the solicitation of an offer to buy or sell any security, financial product or instrument; or to participate in any particular trading strategy. It does not take into account readers’ financial situation or investment objectives. We advise any readers of this content to seek their own advice. Without the approval of Pepperstone, reproduction or redistribution of this information isn’t permitted.

EURUSD I Daily Weekly CLS I Model 1- 2R setupHey, Market Warriors, here is another outlook on this instrument
If you’ve been following me, you already know every setup you see is built around a CLS range, a Key Level, Liquidity and a specific execution model.
If you haven't followed me yet, start now.
My trading system is completely mechanical — designed to remove emotions, opinions, and impulsive decisions. No messy diagonal lines. No random drawings. Just clarity, structure, and execution.
🧩 What is CLS?
CLS is real smart money — the combined power of major investment banks and central banks moving over 6.5 trillion dollars a day. Understanding their operations is key to markets.
✅ Understanding the behaviour of CLS allows you to position yourself with the giants during the market manipulations — leading to buying lows and selling highs - cleaner entries, clearer exits, and consistent profits.
🛡️ Models 1 and 2:
From my posts, you can learn two core execution models.
They are the backbone of how I trade and how my students are trained.
📍 Model 1
is right after the manipulation of the CLS candle when CIOD occurs, and we are targeting 50% of the CLS range. H4 CLS ranges supported by HTF go straight to the opposing range.
📍 Model 2
occurs in the specific market sequence when CLS smart money needs to re-accumulate more positions, and we are looking to find a key level around 61.8 fib retracement and target the opposing side of the range.
👍 Hit like if you find this analysis helpful, and don't hesitate to comment with your opinions, charts or any questions.
⚔️ Listen Carefully:
Analysis is not trading. Right now, this platform is full of gurus" trying to sell you dreams based on analysis with arrows while they don't even have the skill to trade themselves.
If you’re ever thinking about buying a Trading Course or Signals from anyone. Always demand a verified track record. It takes less than five minutes to connect 3rd third-party verification tool and link to the widget to his signature.
"Adapt what is useful, reject what is useless, and add what is specifically your own."
— David Perk aka Dave FX Hunter ⚔️

EURUSD COT and Liquidity AnalysisHey what up traders welcome to the COT data and Liquidity report. It's always good to go with those who move the market here is what I see in their cards. I share my COT - order flow views every weekend.
🎯 Non Commercials closed longs and added shorts.It still seems to me like EUR dropping lower but it will have to take liquidity levels above.
📍Please be aware that institutions report data to the SEC on Tuesdays and data are reported on Fridays - so again we as retail traders have disadvantage, but there is possibility to read between the lines. Remember in the report is what they want you to see, that's why mostly price reverse on Wednesday after the report so their cards are hidden as long as possible. However if the trend is running you can read it and use for your advantage.
💊 Tip
if the level has confluence with the high volume on COT it can be strong support / Resistance.
👍 Hit like if you find this analysis helpful, and don't hesitate to comment with your opinions, charts or any questions.
Analysis done on the Tradenation Charts
Disclosure: I am part of Trade Nation's Influencer program and receive a monthly fee for using their TradingView charts in my analysis.
"Adapt what is useful, reject what is useless, and add what is specifically your own."
— David Perk aka Dave FX Hunter ⚔️

eurusd 20 short-term market update short it exit 1160🏆 EURUSD Market Update m20 short-term trade
📊 Technical Outlook
🔸Short-term: BEARS 1160
🔸5 waves impulse completed
🔸1090/1240/1140/1350/1270/1410
🔸a/b/c/ correction 1160
🔸short sell and exit at 1160
🔸Price Target Bears: 1160
Key recent developments in EURUSD
📉 The U.S. dollar weakened as investors grew concerned over President Trump's proposed tax and spending bill, which could significantly increase the national debt
📈 The euro reached a one-month high after President Trump delayed the implementation of 50% tariffs on European Union imports, providing a temporary boost to investor confidence
🗣️ European Central Bank President Christine Lagarde suggested that the euro could become a global alternative to the U.S. dollar, contingent on strengthening the EU's financial and security infrastructure
📊 Technical analysis indicates that the EUR/USD pair may edge higher within a range of 1.1360 to 1.1420, though upward momentum is slowing
📉 Soft inflation data from France has increased selling pressure on the euro, as markets anticipate a stronger divergence between the Federal Reserve and the European Central Bank
📉 The EUR/USD pair is under bearish pressure, trading near 1.1350, as the U.S. dollar finds demand ahead of upcoming economic data and ongoing Senate tax debates

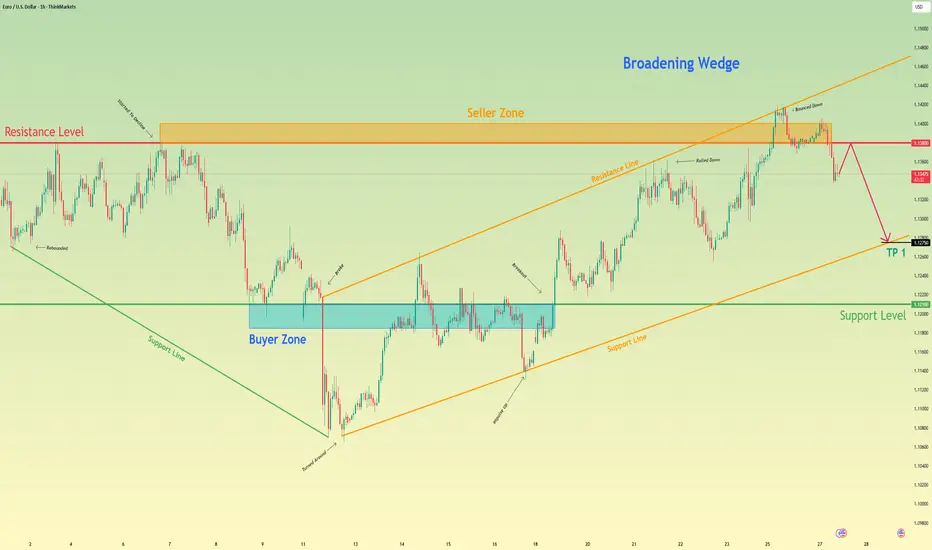
Euro may grow to resistance level and then drop to 1.1275 pointsHello traders, I want share with you my opinion about Euro. After forming a strong upward move from the buyer zone (1.11850–1.1210), the price rose sharply, broke the mid-range resistance, and entered the seller zone between 1.1380 and 1.1400. Once it reached the upper boundary of the broadening wedge, the price bounced down from resistance at 1.1380. Now the price is trading inside a broadening wedge, showing signs of a potential reversal. After failing to hold above resistance, the Euro started to decline from the seller zone, confirming selling pressure. The current movement points to a correction within the wedge structure. I expect the Euro will continue falling toward 1.1275, my TP 1, where the support line of the wedge coincides with the upper boundary of the previous buyer zone. This zone has already shown strong reactions before and could act as a short-term reversal area. Given the recent rejection from resistance, the broadening wedge formation, and return from the seller zone, I remain bearish and anticipate further decline. Please share this idea with your friends and click Boost 🚀
Disclaimer: As part of ThinkMarkets’ Influencer Program, I am sponsored to share and publish their charts in my analysis.
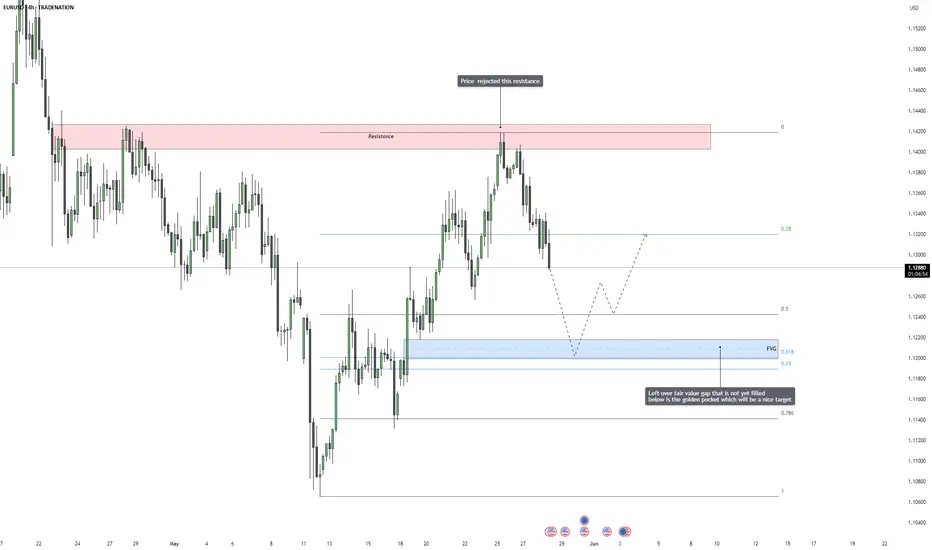
EURUSD – Bearish Reversal in Motion, Fair Value Gap Draws Price EURUSD has recently reacted strongly to a major resistance zone, where price previously stalled and reversed in the past. After running into this area again, we saw a sharp and immediate rejection, which confirms the presence of aggressive selling pressure. This rejection was not just a weak pullback, but a strong displacement candle that shows real intent from institutional participants.
This kind of price action is typically a sign that the market has found a short-term top, and will now look to rebalance lower, especially if there are inefficiencies left behind during the last move up. With the rejection now confirmed and price starting to rotate lower, the odds increase that we see a deeper retracement in the coming sessions.
Resistance Reaction and Liquidity Story
The price reached into a well-defined supply area and rejected cleanly. This level was likely filled with buy-side liquidity from breakout traders and late longs, which institutions needed in order to fill their sell orders. After sweeping above the previous highs and triggering breakout entries, price snapped back below, creating a shift in short-term structure.
That move also created a market imbalance, a price inefficiency that the market tends to come back and correct. With bullish liquidity absorbed at the highs, price is now looking for sell-side liquidity, which can typically be found below the previous higher lows and inside unfilled value areas.
Fair Value Gap and Fibonacci Confluence
Below the current market, we have a clean fair value gap that was left behind during the most recent impulsive bullish move. What makes this area even more attractive is that it overlaps perfectly with the golden pocket zone, the 0.618 to 0.65 Fibonacci retracement level. This confluence creates a high-probability target area, not just because of the imbalance, but also because this level acts as a common retracement zone where institutional traders often look to reaccumulate or exit short-term positions.
This area is also likely to hold resting liquidity from traders who placed stop losses under recent higher lows. All these factors combined make the fair value gap plus golden pocket area a natural draw for price, the market tends to gravitate toward these zones when there’s unfinished business left behind.
Expectations and Potential Development
Going forward, I expect price to continue bleeding lower in a controlled fashion, possibly forming minor lower highs along the way. Once the fair value gap is reached and filled, we could see signs of support or accumulation, depending on the context at the time. It’s important not to blindly long from that area, but instead wait for a market reaction, ideally a shift in structure on the lower timeframes, to signal that buyers are stepping back in.
If the market holds that area and confirms support, it could launch a new leg higher. However, if the fair value gap fails and price continues to break down, it would signal that this move is not just a retracement but possibly the start of a larger bearish leg.
Conclusion
The rejection from resistance has opened the door for a deeper retracement. With a clear fair value gap and Fibonacci golden pocket below, the market now has a logical destination to correct toward. This level offers a clean narrative for continuation lower, and it aligns with both price action structure and algorithmic models. Patience is key now, the best opportunities come when price delivers into clean zones like this one.
Disclosure: I am part of Trade Nation's Influencer program and receive a monthly fee for using their TradingView charts in my analysis.
___________________________________
Thanks for your support!
If you found this idea helpful or learned something new, drop a like 👍 and leave a comment, I’d love to hear your thoughts! 🚀
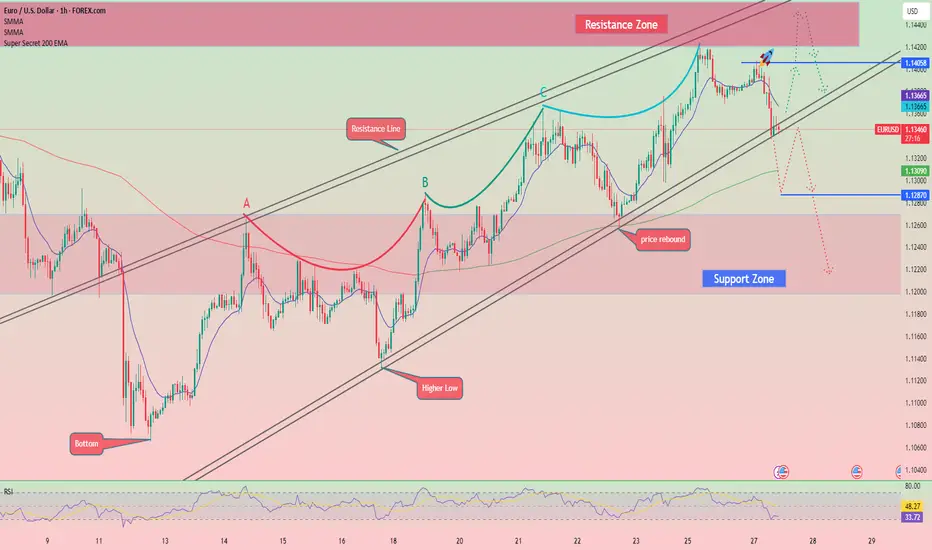
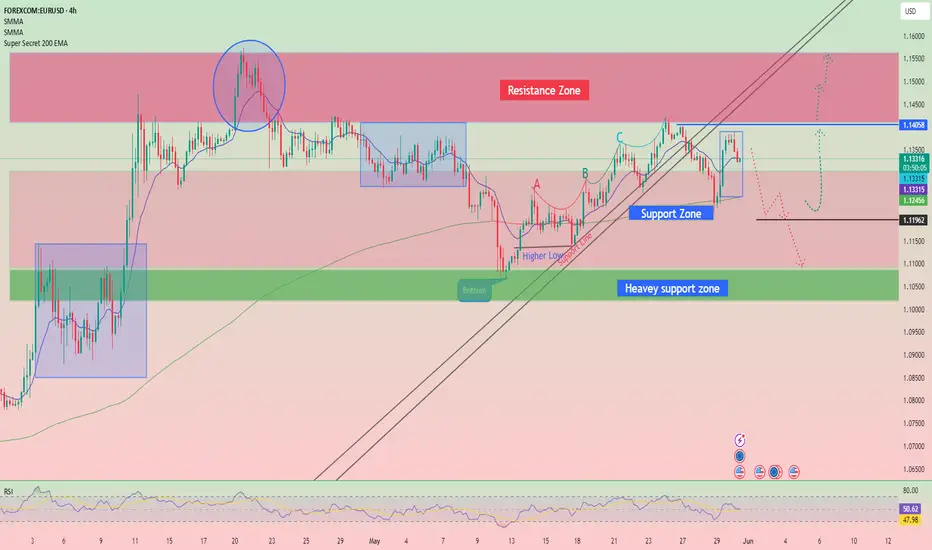
EUR/USD - Is the uptrend about to end?The EUR/USD currency pair has demonstrated a consistent uptrend on the 4-hour chart for approximately two weeks. This sustained bullish momentum has captured the attention of traders and analysts alike, who are now questioning whether the pair can maintain its upward trajectory or if a retracement is imminent as it approaches significant resistance levels.
Rising wedge
A closer examination of the price action reveals that EUR/USD has been advancing within a rising wedge formation. This technical pattern is generally considered bearish, as it often precedes a reversal or a breakdown rather than a continued rally. Rising wedges are characterized by converging trendlines, with price making higher highs and higher lows at a diminishing rate, which typically signals waning bullish momentum and a potential for sellers to regain control.
Strong resistance
Recently, the pair encountered a notable resistance zone around the 1.141 level. Upon reaching this area, EUR/USD faced a rejection, resulting in a pullback from its recent highs. While there is a possibility that the pair could make another attempt to test this resistance, the initial rejection suggests that the upward move may be losing steam. As a result, the likelihood of a retracement has increased, especially given the bearish implications of the rising wedge pattern.
Support/target zone
If the pair does indeed correct lower, a logical target for a cooldown would be the green support zone near 1.127. This level has previously acted as a strong support area, and it could serve as a foundation for buyers to step in once more, potentially setting the stage for another move higher. Until the resistance at 1.141 is decisively broken, caution is warranted, and a period of consolidation or a pullback towards support appears increasingly probable.
Thanks for your support.
- Make sure to follow me so you don't miss out on the next analysis!
- Drop a like and leave a comment!

EUR/USD) breakout Analysis Read The ChaptianSMC trading point update
Technical analysis for EUR/USD (Euro/US Dollar) on a 3-hour timeframe presents a bearish outlook. Here's a breakdown of the key ideas and elements in the analysis:
---
1. Breakdown of Rising Channel
Ascending Channel: Price was moving upward within a clearly defined channel.
Breakout: The price broke below the ascending channel, indicating a potential trend reversal or correction.
---
2. Resistance Zone (Yellow Box)
Multiple Rejections: Red arrows mark points of rejection from the resistance area.
“Breakout” Label: Indicates this area was previously a support that turned into resistance after the price dropped below it.
---
3. EMA 200
The 200 EMA is plotted and the price is trading slightly above it, but very close.
A break and sustained movement below the 200 EMA would typically support a bearish trend continuation.
---
4. Bearish Projection
Downward Zigzag Path: Implies an expected short-term correction followed by further decline.
Target Points:
First target: 1.11307
Second, more extended target: 1.10639
---
5. RSI (Relative Strength Index)
Current Value: Around 38.84, which is near the oversold region (30).
Bearish Momentum: RSI is trending downwards, suggesting strengthening bearish momentum.
---
6. Fundamental Events
Multiple icons at the bottom (e.g., flags, calendar) indicate upcoming economic events/news which could influence volatility and confirm or invalidate the move.
Mr SMC Trading point
---
Conclusion:
This analysis suggests a bearish short- to medium-term outlook for EUR/USD, especially if price confirms a break below the 200 EMA. The resistance zone (around 1.133–1.135) is now seen as a supply zone, and the targets are around 1.113 and 1.106.
---
Suggestions/Considerations:
Watch the 200 EMA: A solid break below it would reinforce the bearish bias.
Monitor Fundamentals: U.S. and Eurozone economic news could heavily impact price action.
RSI Oversold Caution: If RSI dips further, a bounce might occur before full target completion.
Pales support boost 🚀 analysis follow)

EURO - Price can rise a little and then start to declineHi guys, this is my overview for EURUSD, feel free to check it and write your feedback in comments👊
Some time ago, price entered a falling channel, where it broke through $1.1310 level at once, but soon broke it again.
Price traded near this level for some time, after which it reached resistance line and continued to decline.
Then price broke $1.1310 level and dropped to $1.1065 level, after which it turned around and started to grow within the channel.
In the rising channel, Euro broke $1.1140 level and continued to grow, but later made a correction to this level.
After this, price continued to grow and later broke $1.1310 level, then rose to the resistance line of the channel.
I expect that Euro will rise to resistance line and then start to decline to the $1.1310 support level.
If this post is useful to you, you can support me with like/boost and advice in comments❤️
Disclaimer: As part of ThinkMarkets’ Influencer Program, I am sponsored to share and publish their charts in my analysis.

Hellena | EUR/USD (4H): LONG to the resistance area 1.15691.Colleagues, I believe that wave “5” of higher order has actively started an upward movement.
At the moment I see movement in wave “1” of medium order and it means that a correction in wave “2” to the area of 50% Fibonacci level (1.12434) is expected. But I would still advise to consider only upward movement and use pending limit orders.
I see the maximum of wave “3” - resistance area 1.15691 as the target.
Manage your capital correctly and competently! Only enter trades based on reliable patterns!

EURUSD - Bullish Continuation SetupEURUSD recently retraced into a key demand zone where a 4H Fair Value Gap (FVG) aligned perfectly with the golden pocket (between 61.8% and 65% Fibonacci levels). This confluence provided a high-probability setup for a bullish reaction. After testing this level, price rebounded sharply, confirming that buyers are still active and protecting discounted imbalances.
Imbalance Reaction and Demand Strength
The initial bounce from the 4H FVG was clean, with price quickly reclaiming structure and leaving behind a fresh series of upside imbalances. These newly formed gaps are now being respected on smaller retracements, showing that the market is still imbalanced to the upside and that buyers are stepping in early during pullbacks.
Bullish/Bearish Scenarios
As long as price continues to respect these imbalances, the short-term outlook remains bullish. The next major test lies at the resistance zone around 1.14000, which previously caused a sharp rejection. A minor reaction is expected there, but if the market maintains bullish momentum, we could see a clean break above that level. A failure to hold above the smaller imbalances near 1.12800 would be the first sign of weakness and could open the door for a deeper retracement back into the original 4H FVG.
Price Target and Expectations
If the current structure holds, I expect price to push into the 1.14000 resistance zone and eventually aim for the 1.15270 level as the next major liquidity target. The current price action shows a healthy series of higher highs and higher lows, supported by imbalances being filled and respected, suggesting further upside continuation.
Conclusion
EURUSD is showing clean bullish structure following a textbook reaction from the 4H imbalance and golden pocket zone. As long as the market continues to respect the newly formed imbalances, the path of least resistance remains to the upside. Eyes are now on the resistance zone for signs of either rejection or breakout continuation.
Disclosure: I am part of Trade Nation's Influencer program and receive a monthly fee for using their TradingView charts in my analysis.
___________________________________
Thanks for your support!
If you found this idea helpful or learned something new, drop a like 👍 and leave a comment, I’d love to hear your thoughts! 🚀

EURUSD Analysis Today: Technical and Order Flow Analysis !In this video I will be sharing my EURUSD analysis today, by providing my complete technical and order flow analysis, so you can watch it to possibly improve your forex trading skillset. The video is structured in 3 parts, first I will be performing my complete technical analysis, then I will be moving to the COT data analysis, so how the big payers in market are moving their orders, and to do this I will be using my customized proprietary software and then I will be putting together these two different types of analysis.

EUR/USD continue with the UptrendOn EUR/USD , it's nice to see a strong buying reaction at the price of 1.13800.
There's a significant accumulation of contracts in this area, indicating strong buyer interest. I believe that buyers who entered at this level will defend their long positions. If the price returns to this area, strong buyers will likely push the market up again.
Strong S/R zone from the past + high volume cluster are the main reasons for my decision to go long on this trade.
Happy trading
Dale

Lingrid | EURUSD long Entry Opportunity from Support ZoneThe price perfectly fulfilled my previous idea . FX:EURUSD is pushing higher after breaking through the downward trendline and forming a higher low. Price is currently hovering above the key 1.1320 swap zone and could use this level as support for a bullish continuation. A bounce from this region would open the path toward the 1.1500 resistance inside the upper part of the bullish channel. However, failure to hold 1.1320 may trigger a deeper pullback into the rising trendline.
📈 Key Levels
Buy zone: 1.1300 – 1.1320
Buy trigger: bullish bounce from 1.1320
Target: 1.1500
Sell trigger: break below 1.1300
💡 Risks
Weak Eurozone data could derail bullish setup
USD strength on Fed hawkishness may stall recovery
Trendline break would signal bearish reversal structure
Traders, if you liked this idea or if you have your own opinion about it, write in the comments. I will be glad 👩💻

EUR/USD..1H chart pattern..current 1-hour (1H) chart analysis of EUR/USD, I'M proposed sell entry at 1.13800 with a target of 1.12500 is a valid strategy, contingent on specific technical confirmations.
---
📉 Current Market Overview
Trend Analysis: As of May 26, 2025, the 1H chart indicates a bullish trend, with 75% of moving average signals supporting upward momentum. However, short-term moving averages are showing neutral signals, suggesting a potential slowdown in bullish momentum .
Resistance Levels: The price is approaching a significant resistance zone between 1.1380 and 1.1443, which has historically prompted bearish reversals .
---
🔍 Technical Patterns and Indicators
Bearish Rectangle Formation: A bearish rectangle pattern has been identified on the 1H chart, indicating potential for a downward breakout. This pattern suggests that if the price breaks below the support level, a move towards 1.0805 could occur .
Moving Averages: The 50-period moving average is acting as a dynamic support, while the 200-period moving average supports the broader bullish structure. A break below these averages could signal a shift towards bearish momentum .
---
🎯 Trade Strategy
Entry Point: Consider initiating a short position if the price fails to break above the 1.1380 resistance and shows signs of reversal.
Target: 1.12500, aligning with previous support levels and potential completion of the bearish rectangle pattern.
Stop-Loss: Place a stop-loss above the 1.1443 resistance zone to mitigate risk in case of a bullish breakout.
---
⚠️ Risk Management and Considerations
Confirmation: Wait for confirmation of bearish signals, such as a break below key support levels or bearish candlestick patterns, before entering the trade.
Volatility: Be aware of economic news releases and events that may cause increased volatility, potentially impacting the trade outcome.
Trend Reassessment: Continuously monitor the trend and be prepared to adjust your strategy if bullish momentum resumes.
---
In summary, your proposed trade setup is strategically sound, provided that bearish confirmations are observed near the 1.1380 resistance level. Ensure diligent monitoring of market conditions and adherence to risk management principles to optimize trade performance.

EURUSD I Weekly CLS I Model 2 I Target CLS 1I2 LowsHey, Market Warriors, here is another outlook on this instrument
If you’ve been following me, you already know every setup you see is built around a CLS Footprint, a Key Level, Liquidity and a specific execution model.
If you haven't followed me yet, start now.
My trading system is completely mechanical — designed to remove emotions, opinions, and impulsive decisions. No messy diagonal lines. No random drawings. Just clarity, structure, and execution.
🧩 What is CLS?
CLS is real smart money — the combined power of major investment banks and central banks moving over 6.5 trillion dollars a day. Understanding their operations is key to markets.
✅ Understanding the behavior of CLS allows you to position yourself with the giants during the market manipulations — leading to buying lows and selling highs - cleaner entries, clearer exits, and consistent profits.
📍 Model 1
is right after the manipulation of the CLS candle when CIOD occurs, and we are targeting 50% of the CLS range. H4 CLS ranges supported by HTF go straight to the opposing range.
"Adapt what is useful, reject what is useless, and add what is specifically your own."
— David Perk aka Dave FX Hunter ⚔️
👍 Hit like if you find this analysis helpful, and don't hesitate to comment with your opinions, charts or any questions.

EURUSD Forms Rising Wedge + Evening Star_ Bearish SetupAs I expected in the previous idea , the EURUSD ( FX:EURUSD ) started to rise after breaking the upper line of the descending channel and hit the Long Position target with Risk-To-Reward: 1.46 .
The EURUSD is trading near the Resistance zone($1.149-$1.142) .
From a Classic Technical perspective, EURUSD appears to be completing a Rising Wedge Reversal Pattern . Also, a good sign for a EURUSD reversal is the formation of an Evening Star Candlestick Pattern near the upper line of the rising wedge pattern.
Also, we can see the Regular Divergence(RD-) between Consecutive Peaks .
In terms of Elliott Wave theory , I think the EURUSD corrective waves are NOT over yet, and it seems that EURUSD has completed the main wave X inside the rising wedge pattern.
I expect EURUSD to decline to at least $1.126 AFTER breaking the lower line of the wedge pattern.
Note: If EURUSD touches $1.14903 , we can expect more pump.
Please respect each other's ideas and express them politely if you agree or disagree.
Euro/U.S. Dollar Analyze (EURUSD), 4-hour time frame.
Be sure to follow the updated ideas.
Do not forget to put a Stop loss for your positions (For every position you want to open).
Please follow your strategy and updates; this is just my Idea, and I will gladly see your ideas in this post.
Please do not forget the ✅' like '✅ button 🙏😊 & Share it with your friends; thanks, and Trade safe.

Week of 5/25/25: EU AnalysisExtremely bullish last week leads to my bias being long this week until the weak daily structure is broken.
Thanks for coming, goodluck this week!
Major News:
PMI - Thursday

XAU/USD: Ready for another Decline? (READ THE CAPTION)By examining the #EURUSD chart on the 3-day timeframe, we can see that the price is currently trading around 1.132. If it manages to hold below 1.14, I expect further downside. The bearish targets are 1.12790, 1.11800, 1.10700, and 1.096 respectively.
Please support me with your likes and comments to motivate me to share more analysis with you and share your opinion about the possible trend of this chart with me !
Best Regards , Arman Shaban

Trading Signal for EUR/USD buy above 1.1335 or sell below 1.1418Early in the American session, the euro is trading around 1.1342, undergoing a technical correction after reaching a high of 1.1418 during the European session.
The euro reached price levels seen at the end of April, and we believe it could continue to fall in the coming hours, REACHING THE 21sma at 1.1335.
On the H4 chart, we can see that the euro has formed an uptrend channel since May 11. It is likely that after a technical correction, EUR/USD could rebound around 1.1335, which will be seen as a buying opportunity with targets at the 7/8 Murry level at 1.1418.
Trading Signals for EUR/USD sell below 1.1360 (21SMA-5/8 Murray Early in the American session, the euro is trading around 1.1340 and is experiencing a strong technical rebound after reaching the 4/8 Murray level at 1.1230.
The euro could rise in the coming hours, but it faces strong resistance around 1.1352. This level could provide a key opportunity to resume selling.
It the euro falls below the 21SMA at 1.1326 or below the 5/8 Murray level, we could expect a technical correction and could reach the 4/8 Murray level at 1.1240 and even fill the gap it left around 1.1168.
The indicator is showing a negative signal, however, we could expect a recovery in the euro in the coming hours, before it could fall again.
EUR/USD at a Crossroads: Will the Bears Strike Back from 1.14? 📍1. TECHNICAL CONTEXT
EUR/USD is trading around 1.1405, inside an ascending channel and right within a supply zone (1.1370–1.1470), which already triggered a rejection on April 16. Price action currently shows hesitation, with three consecutive candles at the top of the channel and RSI divergence, suggesting a loss of bullish momentum after an overextension.
The bullish trendline from April remains intact and validated, but the upside is narrowing. Likely scenario: bullish exhaustion followed by a pullback towards 1.1270–1.1220, with a potential retest of both the trendline and the lower boundary of the channel.
📊2. COT REPORT (USD & EUR) – Updated to May 20
USD Index: Non-Commercials added +2,044 net longs, but also +1,975 new shorts. Open Interest rose by +2,207 → a more active market, but still mixed. Net exposure remains neutral to slightly bearish for the dollar.
EURO FX: Non-Commercials cut -3,587 longs and added +6,814 shorts, while Commercials increased longs by +16,796. Speculative funds are gradually shifting short on the Euro, while Commercials continue to hedge long.
→ Combined read: Large speculators are reducing their Euro exposure and staying cautious on the Dollar. Short-term pressure on EUR/USD remains bearish, though no macro reversal yet.
📉3. SENTIMENT & POSITIONING
Retail sentiment shows 71% of traders are short EUR/USD — a classically contrarian signal. However, price is now sitting in a liquidity cluster where smart money might exploit a final squeeze before a real reversal.
Market depth shows strong imbalance, with long orders stacked above current price — suggesting potential stop hunt already triggered or about to fade.
🧭4. SEASONALITY
Historically, May is a bearish month for EUR/USD: -0.0079 on 20-year average, and -0.0163 on 10-year average. Seasonality supports late May weakness and potential downside continuation into early June.
✅ TRADING OUTLOOK
📌 Primary Bias: short-term corrective bearish, waiting for clearer reversal signals.
📌 Key Reaction Zone: 1.1400–1.1470 → structural short area, already tested.
📌 Bearish Target: 1.1270 > 1.1210 (golden pocket + trendline confluence)
📌 Setup invalidation: daily close above 1.1470 with volume → possible extension to 1.1550/1.1580
📌 Macro support: Commercials remain long on the Euro → underlying structure still bullish, but too early to fade short-term bearish momentum.
