EURUSD - EURUSD – The Calm Before the SweepAfter months of climbing steadily within a rising wedge structure, EURUSD has finally broken beneath the bullish trend line that previously acted as dynamic support. This shift is significant, as it marks the first decisive violation of the bullish momentum that has carried price from the April lows into the July highs. The break occurred with strong bearish displacement, leaving behind an unfilled daily Fair Value Gap (FVG) just above the current price. This area now acts as a potential magnet for price before continuation lower.
Trend Line Retest and FVG Confluence
Price is currently hovering near 1.1570 after the trend line break. Above, we have a clean FVG on the daily chart which aligns closely with the underside of the broken trend line. A retracement into this zone would offer the ideal setup for short positioning, combining the concept of a bearish retest with inefficiency fill. From a technical perspective, this would give institutions a perfect level to engineer a lower high before continuing the move down.
Sell-Side Liquidity Objective
The major downside target sits below the swing low formed in early May. This area likely holds a large pool of resting sell-side liquidity, which would be an ideal draw for smart money before any potential reversal. If the market respects the bearish structure and rejects the FVG zone cleanly, the move toward this liquidity pocket becomes increasingly probable.
Reversal Conditions
While the short setup is currently the main focus, the area below the May low also presents a key decision point. If price sweeps that low and we begin to see bullish structure return, this could mark the beginning of a new leg up. For that to be valid, we’d need to see signs of strong buying interest, displacement, and reclaim of key short-term highs. Until then, we remain on the lookout for short opportunities into the FVG and trend line retest zone.
Execution Plan and Expectations
Traders should watch for signs of exhaustion or rejection once price enters the FVG zone. Bearish price action on lower timeframes like the 1H or 15M could confirm entry, particularly if the trend line holds as resistance. Stops can be placed above the swing high before the break, with targets below the major low around 1.10500. The reward-to-risk on this setup is favorable, but patience is needed to wait for the retrace to complete.
Conclusion
EURUSD has shifted from bullish to bearish structure after breaking the rising trend line. With an unfilled FVG above and a clean downside liquidity target, this setup offers a well-defined short opportunity. Reactions at the FVG and below the May low will dictate whether we extend lower or begin a new bullish phase. For now, all eyes are on the retrace and short continuation.
Disclosure: I am part of Trade Nation's Influencer program and receive a monthly fee for using their TradingView charts in my analysis.
___________________________________
Thanks for your support!
If you found this idea helpful or learned something new, drop a like 👍 and leave a comment, I’d love to hear your thoughts! 🚀
EURUSD trade ideas

EURUSD - Bullish fair value gap and fibonacci support!At the end of July, EUR/USD experienced a sharp and decisive move to the downside, signaling a strong bearish momentum in the market. Following this decline, the pair began to recover, steadily climbing and partially filling the 4-hour Fair Value Gap (FVG). After tapping into the 4-hour FVG, price action has entered a corrective phase, moving lower towards a confluence of bullish levels. This area is defined by both the 1-hour and 4-hour FVGs, which align perfectly with the golden pocket of the Fibonacci retracement tool, a high-probability zone often watched by traders for potential reversals.
Bullish Support
The key bullish support zone sits around the 1.158 to 1.160 range. This area holds significant importance because it combines two strong technical factors: the 1-hour and 4-hour FVGs, as well as the golden pocket Fibonacci retracement. The overlap of these technical elements often acts as a magnet for price and can create a strong foundation for a bullish reaction. If the market respects this zone, we could see EUR/USD push higher in the short term, as traders capitalize on the support to drive price towards higher resistance areas.
Bearish Resistance
On the upside, the main bearish resistance zone lies between 1.170 and 1.174. This area represents the final portion of the unfilled bearish 4-hour FVG and could act as a significant barrier for further bullish progress. If price returns to this level, the strong supply pressure could result in a sweep of recent highs, fully filling the 4-hour FVG before potentially resuming the downward trend. This scenario aligns with the idea that sellers may re-enter the market aggressively once this resistance zone is tested.
Final Thoughts
Given the current market structure, my expectation is that the bullish support zone around 1.158 to 1.160 will hold, providing a potential launchpad for price to revisit and possibly complete the filling of the bearish 4-hour FVG near 1.174. However, if the market breaks decisively below the 1-hour FVG, it could indicate a shift in sentiment, opening the door for a bearish continuation and deeper downside targets. The coming sessions will be critical in determining whether EUR/USD can maintain bullish momentum or if sellers will regain control.
-------------------------
Disclosure: I am part of Trade Nation's Influencer program and receive a monthly fee for using their TradingView charts in my analysis.
Thanks for your support. If you enjoyed this analysis, make sure to follow me so you don't miss the next one. And if you found it helpful, feel free to drop a like 👍 and leave a comment 💬, I’d love to hear your thoughts!

EURUSDHello Traders! 👋
What are your thoughts on EURUSD?
EUR/USD is trading below a key resistance area and has recently completed a pullback to the broken trendline.
As long as the pair remains under this resistance, we expect some short-term consolidation, followed by a renewed bearish move toward lower levels.
The bearish outlook remains valid while price stays below the resistance zone.
A clean break above this level would invalidate the bearish scenario.
Will EUR/USD resume its decline, or break through resistance? Share your view below! 👇
Don’t forget to like and share your thoughts in the comments! ❤️

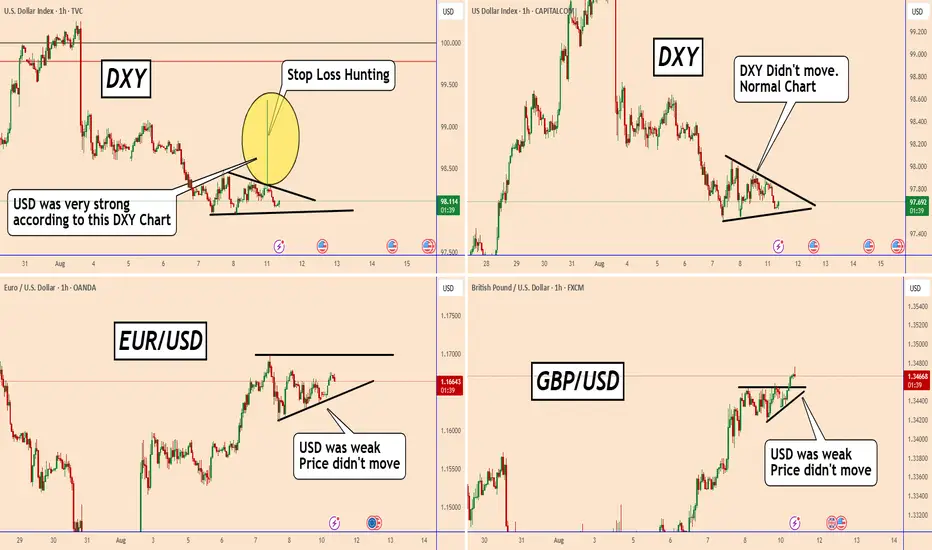
DXY: An Example of Stop Loss Hunting and Why Does it Happen?DXY: An Example of Stop Loss Hunting and Why Does it Happen?
In today's chart I am showing you a typical example of a Stop Loss Hunt..
Many of us very often face the closing of a position without any movement in the market. Usually this happens almost every day at the close of the US market and during the opening of the week.
What happens is not simply an increase or decrease in the price but an increase in the spread by the broker and often without justification at all.
If you complain, they define it as liquidity problems and you are never right. You will not get a refund.
Sometimes these movements are printed on the chart but often there is no trace of them because they do not include the spread of the opening of the market in the price.
I wanted to raise this concern again after seeing that in a broker where I usually post DXY, and had an unjustified increase at a time when the USD pairs have not moved at all.
But even if we look at DXY on other brokers there are no changes.
This is called Stop Loss - Hunting
If you want to avoid these problems, always be careful every day at the closing of the American market around 10:00 PM London Time and at the opening of the market on Sunday at 10 PM London Time.
You may find more details in the chart!
Thank you and Good Luck!
PS: Please support with a like or comment if you find this analysis useful for your trading day
EURUSDHello Traders! 👋
What are your thoughts on EURUSD?
Price broke its ascending trendline and entered a corrective phase, retracing to the 50% and 61.8% Fibonacci levels .
Currently, the market is trading near a major resistance zone, which aligns with the 76.8% Fibonacci retracement, a supply area, the broken trendline, and a horizontal resistance — adding to the confluence and strength of this level.
As long as price remains below this resistance zone, the bias stays bearish, and we expect a move down toward the specified lower targets after some consolidation in this area.
Don’t forget to like and share your thoughts in the comments! ❤️

EURUSD Potential UpsidesHey Traders, in today's trading session we are monitoring EURUSD fora buying opportunity around 1.15800 zone, EURUSD is trading in an uptrend and currently is in a correction phase in which it is approaching the trend at 1.15800 support and resistance area.
Trade safe, Joe.

EURUSD : Buy to Win ? Hello everyone, what’s your view on FX:EURUSD trend?
EURUSD is currently forming its first Bullish Pennant pattern after a strong upward move, suggesting a high probability that the market will continue to push higher.
On the H1 chart, after a period of sideways movement, the price has broken out and entered a narrowing consolidation zone – a hallmark of the pennant pattern. The short-term EMA remains above the long-term EMA, supporting the bullish bias.
Preferred scenario: If the price breaks clearly above the upper boundary of the pattern, the buying target will be in the 1.17xx zone.
This pattern often appears in the middle of a trend, so if the breakout is successful, the rally could extend with stronger buying momentum.
Good luck!
Kevinn_Nguyen!

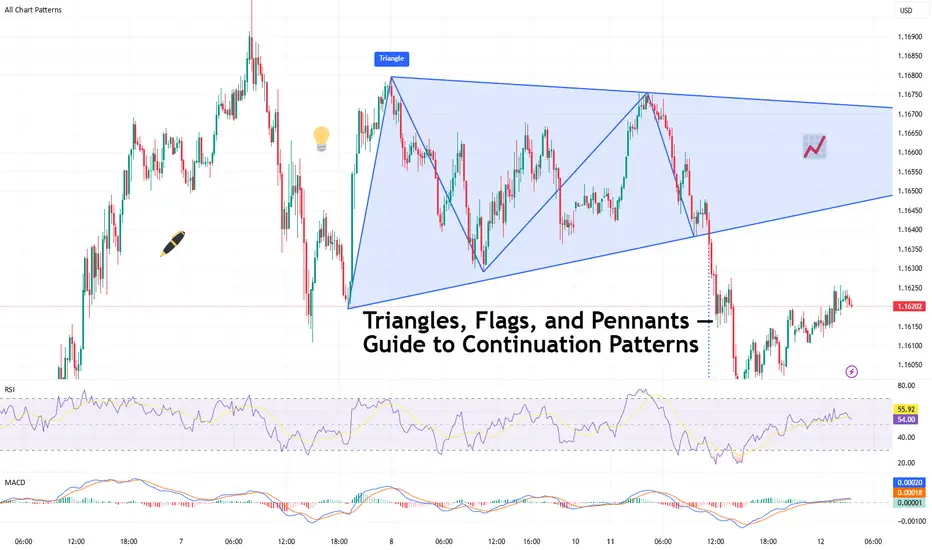
Triangles, Flags, and Pennants — Guide to Continuation PatternsChart patterns can be mysterious — until they’re not. Let’s break down the technical trio that tells you when a trend’s just taking a breather before it flexes again.
So your chart’s been pumping higher for weeks, and then… nothing. Price starts scribbling sideways. Cue panic? Maybe. But more likely, you’re staring at a continuation pattern.
Triangles, flags, and pennants are the subtle “hold my beer before I try to pull a move” signals of technical analysis. They show up when markets pause — not reverse. That pause could mean your trend is catching its breath, not dying in a ditch.
In other words: don’t close your longs just because things go quiet. Sometimes the market is just stretching before it sprints again.
⚠️ Symmetrical, Ascending, Descending
Let’s talk triangles, the Swiss Army knife of consolidation. These shapes come in three stylish varieties:
● Symmetrical triangle: Higher lows, lower highs. Traders call this the indecision pattern, but don’t get it twisted — it may just be winding up for a breakout. Wanna see how these look in practice? Dive into our community’s symmetrical triangle ideas .
● Ascending triangle: Flat top, rising bottom. Buyers are aggressive, their patience is running out. Resistance looks like it’s begging to be broken. Check the ascending triangle ideas for your viewing consideration.
● Descending triangle: Flat bottom, falling top. This one’s more bearish than your boomer uncle who knows zero about Bitcoin BITSTAMP:BTCUSD , and yes — it’s often a precursor to a breakdown. Follow the descending triangle ideas and make sure you DYOR.
Key tip : Wait for the breakout. Don’t front-run triangles unless you like volatility surprises and emotional damage.
🚩 Flags: Fast Moves, Tight Consolidations
Flags form after a sharp price move — the “flagpole” — followed by a tight, slightly sloping channel that moves against the prevailing trend. They’re short-term patterns that act like pit stops during a race.
● In a bull flag, price rallies sharply, then consolidates lower in a downward-sloping rectangle. If price breaks above the upper boundary, the uptrend is likely to resume. Jump straight into the bullish flag ideas .
● In a bear flag, price crashes, then drifts higher or sideways, forming an upward-sloping consolidation. A breakdown below the lower support hints at a continuation lower. What goes up must go down — bearish flag ideas for thought.
Flags are prized for their reliability and tight risk-to-reward setups. The breakout is typically swift, and traders often use the length of the flagpole as a projected target.
🎏 Meet the Pennant: The Flag’s Cousin
Pennants are like mini-triangles that form after a strong price move, usually in high-volume conditions. Unlike regular triangles, they’re smaller and more compressed — a tight consolidation in the shape of a tiny symmetrical triangle.
What makes a pennant different from a flag? The structure. While flags are rectangular, pennants are more pointed — a converging pattern rather than parallel lines.
Pennants are often seen in high-momentum environments, and when price breaks out of the consolidation zone, it often does so with force. Get some pennant ideas straight from our community.
🧐 How to Actually Trade These Patterns
Spotting a continuation pattern is one thing. Trading it with discipline is another.
Here’s a basic checklist:
● Identify the trend. Continuation patterns only work when there’s a clear preceding move. If the chart is a sideways mess, maybe skip it.
● Draw your levels. Use trendlines or horizontal support/resistance to outline the pattern. Keep it clean — if you’re forcing a pattern, it probably isn’t there.
● Wait for the breakout. Don’t jump in too early. Let the price confirm your bias. Breakouts are more credible with a volume spike.
● Set your stop wisely. Most traders place stops just outside the opposite side of the pattern — below the lower trendline in an uptrend, or above the upper trendline in a downtrend.
● Target projection. Many use the height of the pattern or the flagpole to estimate a target price, though market conditions should influence your approach.
🤔 So, What Could Go Wrong?
Glad you asked. Plenty.
● Fakeouts: Just because it looks like a breakout doesn’t mean it’s real. Wait for confirmation — volume, a close outside the pattern, or your favorite indicator giving the green light.
● Shaky patterns: Not every triangle-looking pattern is a triangle. Sometimes it’s just noise. Don’t make up patterns. The market doesn’t care about your geometry.
● Overleveraging: Continuation patterns look reliable, but no pattern is bulletproof. Position sizing still matters. Don’t bet the farm because a pennant gave you butterflies.
💡 Pro Tips from the Chart Trenches
● Set alerts on trendline breaks so you’re not glued to the screen like a caffeinated hawk.
● Use pattern recognition tools if you’re a newer trader — but verify manually. No software is a crystal ball.
● Trade continuation patterns in the direction of the trend. Countertrend flags are usually bear traps in disguise.
📌 One Last Thing: Pattern ≠ Prediction
Chart patterns don’t tell the future. They tell a story about buyer and seller behavior. Continuation patterns? They’re just the market saying, “Yeah, we’re still into this trend. Just grabbing some break first.”
Use them as one part of a system. Combine them with momentum indicators, volume, or good ol’ fashioned risk management.
Because in the end, it’s not about how many triangles you find — it’s about how many fakeouts you avoid.
Off to you : Spotted any textbook triangles or sneaky flags this week? Or caught a pennant fakeout that wrecked your stop loss?
Drop your best (or worst) continuation pattern story below. You never know who might learn something from your chart scars.
EURUSD: Support & Resistance Analysis For Next Week 🇪🇺🇺🇸
Here is my latest structure analysis and important supports & resistances
for EURUSD for next week.
Consider these structures for pullback/breakout trading.
❤️Please, support my work with like, thank you!❤️
I am part of Trade Nation's Influencer program and receive a monthly fee for using their TradingView charts in my analysis.

EURUSD Short-Term Bullish Momentum - Buy ? Hello everyone, what do you think about EURUSD?
Yesterday, we discussed the sideways movement of this pair, and now, it seems that EUR/USD is showing a short-term bullish trend. The price is currently moving around 1.165, as marked on the chart.
In the short term, the market appears ready for further upward movement. With support at multiple levels (Support 1 and Support 2), and the possibility of forming a Support 3 to reach the target of 1.177, the overall outlook remains optimistic.
Keep an eye on how the market reacts at these important levels! Don’t forget to like if you agree with my view!
Good luck!

EURUSD Swing Outlook-Update/Market forecast! EU Swing Analysis H8-H4 Timeframe
Overall trend is bullish, on Daily> timeframe price has broken below the support trend line
Which indicates bearish corrective phase has started.
Current PA
Trend is bearish
Phase is corrective
Price has tapped into my 70.5-79.5% Fib level, in premium levels. I am looking for shorts
targeting weak low.
Price has already rejected and gave us a bearish displacemenet-clear on 6H timeframe
and a retest entry model.
Next week i am looking for price to extend the sells
(I know a lot of people are looking for price to sweep the high and mitigate the OB) but my entry criteria have been met.

EURUSD at a Crossroads: The Battle at the 78.6% Fib LevelMarkets rarely move in a straight line. After a powerful rally was stopped by monthly supply, EURUSD has arrived at a critical crossroads. The higher timeframe trend is still bullish, but a potential daily downtrend is emerging. This analysis focuses on the single high-probability short setup that could define the next major move.
After the price found support at the 50% Fibonacci retracement level of the weekly structure , which coincided with the daily structure's break level, further decline was prevented by negative NFP news last Friday, which pushed the dollar index down. The long scenario from this level, which I detailed in my previous analysis " EURUSD: The Logic of Institutional Capital Unveiled ", is still active. An entry directly from that level was impossible due to the reversal occurring on highly volatile news, but it's still possible from the manipulation zone in the form of the bullish order block below.
This current analysis is a continuation of that one, but from the perspective of looking for short positions , as the price has shown its intention to first reach a zone of interest above. So, let's try to further unravel the logic and the next step of large capital.
The global uptrend of the pair was halted by a monthly supply zone , from which a correction began and subsequently reversed at the 50% weekly level. One might expect the uptrend to continue and only look for long entries. However, the fact that the price found its pivot point in a monthly supply zone and has since shown the potential genesis of a bearish daily structure allows us to consider counter-trend short trades, with fresh footprints from "smart money" to guide us.
On its continued ascent, the price will face resistance in the form of a bearish order block in conjunction with the 78.6% retracement level of the new, potentially bearish structure. Everything will depend on whether this level and order block hold and show a reversal reaction. The entry condition for a short will be the mitigation of this order block concurrently with reaching the 78.6% level, followed by price finding acceptance below it .
► Invalidation: Invalidation of the short scenario would be a break of the 78.6% level with the price finding acceptance above it.
In the case of a short setup forming and an entry being confirmed, the minimum target for the price will be the bullish daily order block below, which was formed during the liquidity sweep of the daily structure's break level.
A key global context for EURUSD to consider upon the mitigation of the daily bearish order block is the Dollar Index (DXY) . After breaking its bearish daily structure (BOS D) to the upside, it also began a correction after NFP. The target and potential reversal zone for DXY is the same as EURUSD's but a mirror image: the 78.6% Fibonacci retracement level in conjunction with a daily order block . It is highly probable that the potential setup formation on these two instruments will occur synchronously. Given their strong inverse correlation, a potential short setup on the euro pair would receive additional confirmation if a long setup forms on the Dollar Index.
~~~~~~~~~~~~~~~~~~~~~~~~~~~~~~~~~~~~~~~~~~~~~~~~~~~~~~~~~~~~~~~~~
The principles and conditions for forming the manipulation zones I show in this trade idea are detailed in my educational publication, which was chosen by TradingView for the "Editor's Picks" category and received a huge amount of positive feedback from this insightful trading community. To better understand the logic I've used here and the general principles of price movement in most markets from the perspective of institutional capital, I highly recommend checking out this guide if you haven't already. 👇
P.S. This is not a prediction of the exact price direction. It is a description of high-probability setup that become valid only if specific conditions are met when the price reaches the marked POI. If the conditions are not met, the setup are invalid. No setup has a 100% success rate, so if you decide to use this trade idea, always apply a stop-loss and proper risk management. Trade smart.
~~~~~~~~~~~~~~~~~~~~~~~~~~~~~~~~~~~~~~~~~~~~~~~~~~~~~~~~~~~~~~~~~
If you found this analysis helpful, support it with a Boost! 🚀
Have a question or your own view on this idea? Share it in the comments. 💬
► Follow me on TradingView for timely updates on THIS idea (entry, targets & live trade management) and not to miss my next detailed breakdown.
~~~~~~~~~~~~~~~~~~~~~~~~~~~~~~~~~~~~~~~~~~~~~~~~~~~~~~~~~~~~~~~~~

EURUSD Hit entry.-In the monthly (higher timeframes), EURUSD is bullish.
-In the weekly timeframe, the was a momentous price reaction at the 1w BoS, making it a very strong area of liquidity and unlikely to be broken further in the short term period but maybe tested.
In the the daily and timeframe EU is bearish, but it is just a possible higher timeframe retracement, but still we are looking for opportunities in that retracement too.
-Above is our low probability low risk idea. We are only risking 13 Pips aiming for a 1:15+

EURUSD: Are Sellers About To Take Control? CPI May Decide!Welcome back to the Weekly Forex Forecast for the week of Aug 11 - 15th.
In this video, we will analyze the following FX market:
EURUSD
The EURUSD saw a relatively small range of action Friday, forming an Inside Bar for the week. Although it closed bullishly, it did so in the middle of the range. With CPI Data coming Tuesday, it may be a holding pattern until the announcement.
Structure wise, the Daily TF shows a bearish shift in the market, with a retracement into a
-FVG. If the inefficiency holds, lower prices are coming for the near term. Wait for valid sell setups, especially after the news announcement.
Enjoy!
May profits be upon you.
Leave any questions or comments in the comment section.
I appreciate any feedback from my viewers!
Like and/or subscribe if you want more accurate analysis.
Thank you so much!
Disclaimer:
I do not provide personal investment advice and I am not a qualified licensed investment advisor.
All information found here, including any ideas, opinions, views, predictions, forecasts, commentaries, suggestions, expressed or implied herein, are for informational, entertainment or educational purposes only and should not be construed as personal investment advice. While the information provided is believed to be accurate, it may include errors or inaccuracies.
I will not and cannot be held liable for any actions you take as a result of anything you read here.
Conduct your own due diligence, or consult a licensed financial advisor or broker before making any and all investment decisions. Any investments, trades, speculations, or decisions made on the basis of any information found on this channel, expressed or implied herein, are committed at your own risk, financial or otherwise.

EURUSD BreakthroughBuy Setup on FOREXCOM:EURUSD , EURUSD team bullish are so aggressive, so im expecting a very big gain on EURO against the weakens dollar.

EURUSD – Which Way Will It Break?Hello everyone, what are your thoughts on the EURUSD trend?
EURUSD is currently experiencing a Bollinger Bands squeeze, signaling a potential breakout in either direction. The price is trading near the lower limit, hovering around 1.157 , with two potential scenarios unfolding:
Bullish scenario: The price could break upward toward 1.172, testing the upper resistance zone.
Bearish scenario: If the price falls below the lower limit, it could head towards the sell target at 1.140.
💬 For me, I’m leaning toward FOMO (Fear of Missing Out) and following the sell trend with a target of 1.140. What about you? Let me know your thoughts in the comments below!

EURUSD → The correction is over. Bullish trend...FX:EURUSD is consolidating above key support from D1. The trend is bullish, and against the backdrop of a weaker dollar, the currency pair is returning to its main movement.
The currency pair is forming a local uptrend, with a fairly clear upward support line that intersects with an important support level. The price has emerged from correction and returned to the trend amid a decline in the dollar, which is mainly bearish. Given the situation with EUR/USD, I would focus on the support zone of 1.1631 - 1.1613, 1.1597. A fairly large pool of liquidity has formed in this zone. A false breakdown and the price holding in the buy zone could trigger a bullish run...
Resistance levels: 1.1676, 1.171, 1.175
Support levels: 1.163, 1.161, 1.160
If the bulls keep the price in the buying zone, i.e. above the key support zone mentioned above, then in the medium term, the currency pair may continue to rise with the possibility of updating local highs...
Best regards, R. Linda!

EUR/USD Bullish Breakout SetupEUR/USD on the 1H chart is forming a descending wedge pattern near support. A breakout above resistance could push the price toward the 1.17500 target.

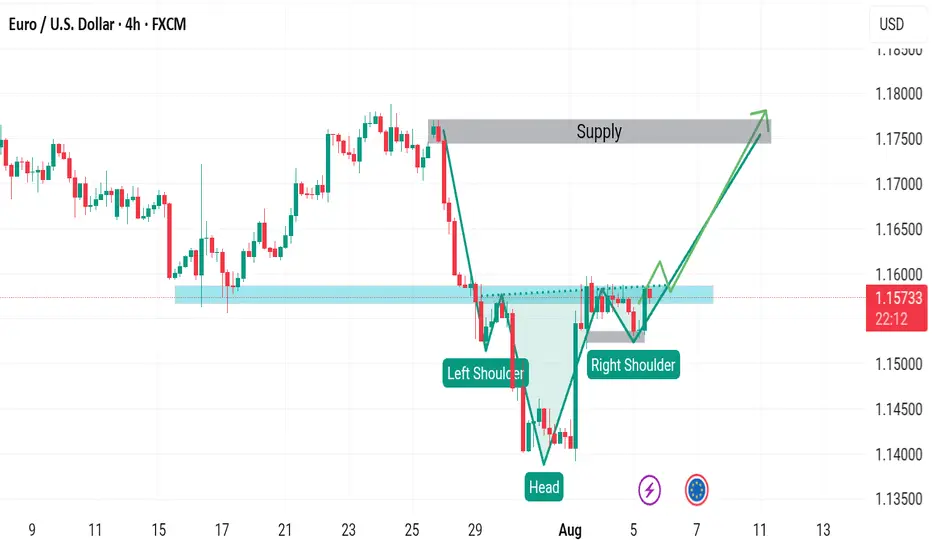
EURUSD BUY SETUPThe price will form a head and shoulders pattern because the candle in the second shoulder is very strong, which indicates that it will break the neck of the pattern. We also have a stronger bounce from below, so I expect an uptrend.
EUR/USD Momentum Builds After Pennant BreakAfter reversing to retest the broken double top neckline and consolidating early last week, the probabilities shifted in favour of an upside continuation.
Following this consolidation under resistance, EUR/USD broke back above, hitting a local high at 1.17 on Tuesday. A pullback followed, forming a clean pennant pattern on the lower timeframes.
The Asian open today brought a decisive breakout above that pennant’s resistance, putting the bias once again to the upside.
Upside target : 1.18 zone
Invalidation: Only if price drops back below 1.16
Disclosure: I am part of TradeNation's Influencer program and receive a monthly fee for using their TradingView charts in my analyses and educational articles.

EUR/USD | Holding Above 1.16 Could Unlock More Upside! (READ IT)By analyzing the EURUSD chart on the 4-hour timeframe, we can see that the price reacted beautifully to all the marked zones on the chart. Especially after reaching the 1.14 demand area, it experienced a strong bullish move, rallying over 200 pips to hit 1.16. Currently, EURUSD is trading around 1.16220, and if it holds above the 1.16 level, we can expect further upside. The next bullish targets are 1.16435, 1.16780, 1.17100, and 1.17500.
Please support me with your likes and comments to motivate me to share more analysis with you and share your opinion about the possible trend of this chart with me !
Best Regards , Arman Shaban
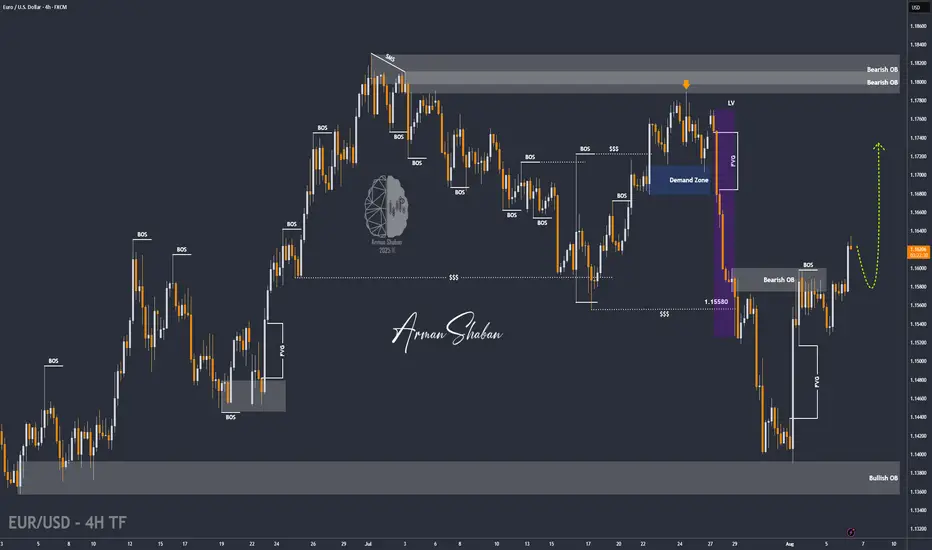
EURUSD - Major resistance ahead with the fair value gaps!The EUR/USD pair remains firmly within a prevailing downtrend, characterized by a consistent pattern of lower highs and lower lows. This bearish momentum has resulted in the formation of several significant Fair Value Gaps (FVGs) on the 4-hour chart, which now act as potential resistance zones on any pullbacks. These FVGs not only coincide with important technical structures, but also align with key Fibonacci retracement levels, adding confluence to their strength. In the analysis below, we’ll walk through these zones and discuss the most probable scenarios based on the current price action.
First resistance zone
The first major resistance lies within the 4-hour FVG in the 1.1600 to 1.1650 region. This zone coincides with the golden pocket, which is formed between the 0.618 and 0.65 Fibonacci retracement levels. This overlap strengthens the likelihood of price reacting bearishly here, should the market manage to retrace upwards into this area. Given the strong downward momentum, this level may be enough to trigger a continuation to the downside, making it a critical area to monitor for rejection signals.
Second resistance zone
The second key resistance is found in the upper 4-hour FVG, ranging from 1.1690 to 1.1750. This zone aligns closely with the 0.786 Fibonacci retracement level and marks a former support zone that has now been broken, indicating a potential structure break. Price returning to this level would be retesting the underside of broken market structure, which often acts as a powerful resistance area. Given this, a deeper pullback into this region may serve as a trap for late buyers and potentially offer a high-probability short setup.
Bullish bounce area
On the bullish side, the most relevant support is currently found within the 1-hour FVG that was formed last Friday, during the release of the U.S. unemployment rate data. This zone is positioned below current price levels and is likely to act as a strong short-term demand area. It is reasonable to anticipate a bullish reaction from this zone if the market retraces downward, making it a favorable area to seek long opportunities for a potential move into the higher resistance levels described above.
Final thoughts
While the broader trend remains bearish, short-term bullish bounces are likely within defined fair value gaps. Traders should keep a close eye on the 1-hour FVG for possible long entries, while watching the 4-hour FVGs, particularly those aligning with key Fibonacci levels, for signs of bearish continuation. If resistance holds firm, the EUR/USD could resume its downtrend, but any structural breaks or sustained closes above these levels would challenge that view. As always, price action around these zones should guide the final decision-making.
-------------------------
Disclosure: I am part of Trade Nation's Influencer program and receive a monthly fee for using their TradingView charts in my analysis.
Thanks for your support. If you enjoyed this analysis, make sure to follow me so you don't miss the next one. And if you found it helpful, feel free to drop a like 👍 and leave a comment 💬, I’d love to hear your thoughts!

EURUSD Potential seems continuationEURUSD has resumed a local uptrend from the support zone amid dollar weakness as price hit the support 1.1600 a false breakdown here suggests strong buyer defence Sustained price action above 1.1600 keeps the pair in the buy zone, favouring upside continuation.
Resistance Targets: 1.1750 = 1.1800
I anticipate the market will rise continue towards as mentioned in target.
You any find more details in the chart.
Ps: Support with like and comments for better analysis.
