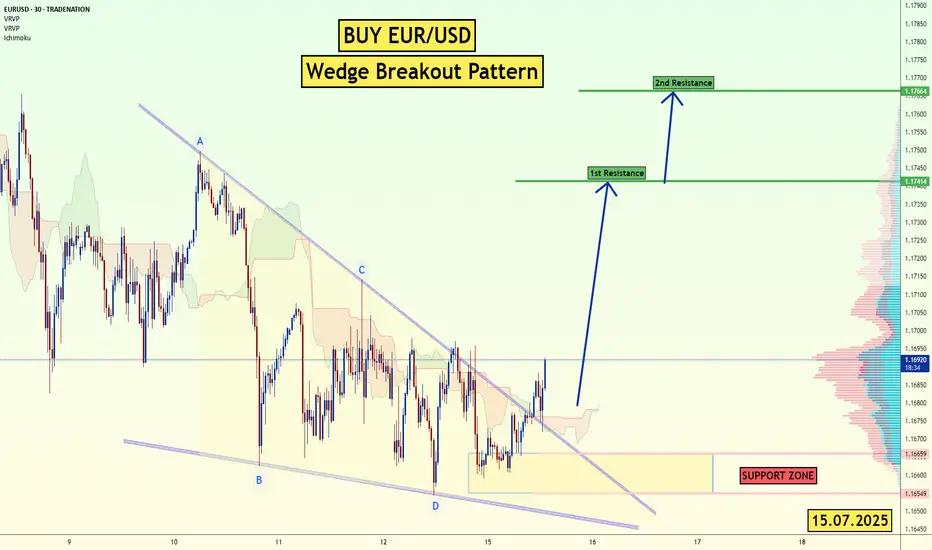
EUR/USD - Wedge Breakout (CPI- Today) 15.07.2025 The EUR/USD pair on the M30 timeframe presents a Potential Buying Opportunity due to a recent Formation of a Wedge Breakout Pattern. This suggests a shift in momentum towards the upside and a higher likelihood of further advances in the coming hours.
Possible Long Trade:
Entry: Consider Entering A Long Position around Trendline Of The Pattern.
Target Levels:
1st Resistance – 1.1741
2nd Resistance – 1.1766
🎁 Please hit the like button and
🎁 Leave a comment to support for My Post !
Your likes and comments are incredibly motivating and will encourage me to share more analysis with you.
Best Regards, KABHI_TA_TRADING
Thank you.
Disclosure: I am part of Trade Nation's Influencer program and receive a monthly fee for using their TradingView charts in my analysis.
EURUSD trade ideas
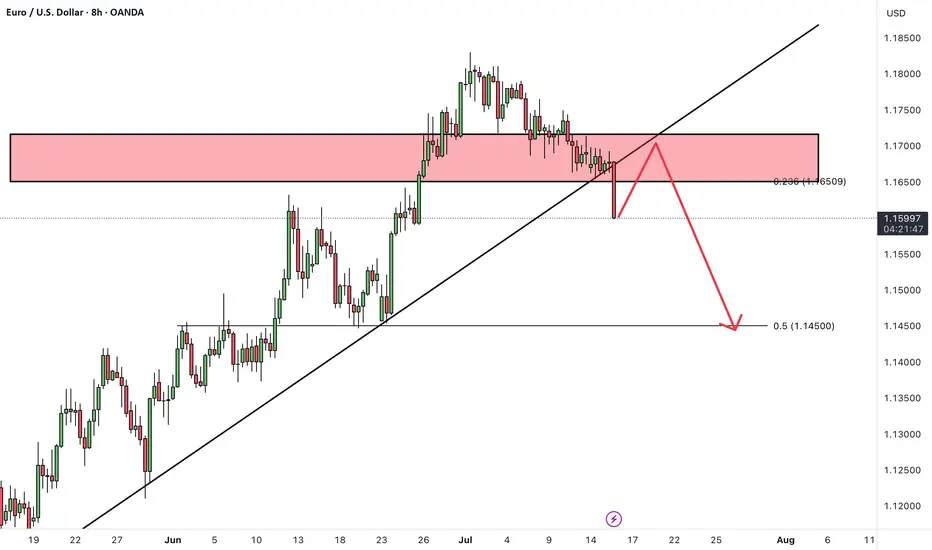
EURO - Price will rise a little and then drop to $1.1500 pointsHi guys, this is my overview for EURUSD, feel free to check it and write your feedback in comments👊
Price earlier carved out a pennant pattern after a strong rally, with price oscillating between converging trendlines and indecision mounting near $1.1550 resistance.
After several weeks in consolidation, sellers finally broke down below the pennant base, sending price back toward the support area and trapping late buyers.
Buyers regrouped and launched a new advance, driving EUR into a well-defined rising channel.
During this channel run, two notable breakouts above interim highs were quickly followed by exits at the upper trendline.
Price now sits in a tight consolidation just under the rising channel’s ceiling near $1.1700, forming small corrective swings on lighter volume.
I expect one more shallow rally toward $1.1750 before sellers overwhelm buyers again, pushing Euro down through $1.1550 and toward the $1.1500 points.
If this post is useful to you, you can support me with like/boost and advice in comments❤️
Disclaimer: As part of ThinkMarkets’ Influencer Program, I am sponsored to share and publish their charts in my analysis.

EURUSDHello Traders! 👋
What are your thoughts on EURUSD?
EURUSD has broken support level and its ascending trendline, indicating a possible shift in short-term market structure and growing bearish pressure.
In the short term, we expect a pullback toward the broken support/trendline zone.
If price fails to reclaim this level, a continued move lower toward the next identified support zone is likely.
As long as price remains below the broken structure, the short-term outlook stays bearish.
Don’t forget to like and share your thoughts in the comments! ❤️
Euro may fall to support area and then start to growHello traders, I want share with you my opinion about Euro. The price previously moved inside a wedge formation, where it tested the buyer zone and showed a strong reaction from this area. After that, the pair broke out upward and started to trade inside an upward channel, building momentum and forming a clear bullish structure. Later, the price created a pennant pattern, often considered a continuation signal. But before continuing the upward trend, I expect the Euro to first exit from the pennant and decline toward the support area. This zone was previously resistantce, and now it may turn into a strong support. Now the price is trading near the pennant resistance, but I don’t expect a breakout right away. The market needs to correct before it resumes the uptrend. Once the price reaches the current support level or slightly lower, it may find demand again and bounce. That’s why I expect the Euro to retest the support zone and then grow further toward TP 1 - 1.1850 points. This target aligns with the upper border of the upward channel and would complete the continuation move after the pennant breakout. Given the previous structure, bullish momentum, and patterns on the chart, I remain bullish after the correction and expect the price to rise from the support zone. Please share this idea with your friends and click Boost 🚀
Disclaimer: As part of ThinkMarkets’ Influencer Program, I am sponsored to share and publish their charts in my analysis.

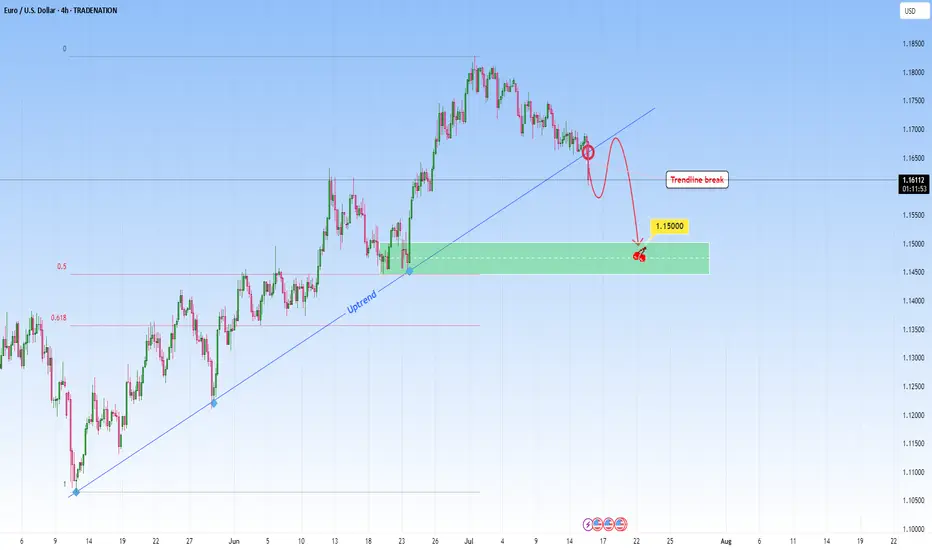
EURUSD: Sell Opportunity after Trendline breakEURUSD was in a steep uptrend but it might stop with this recent break through the uptrend. A break like this one on a strong trendline that had multiple touches, indicates either a potential reversal or major pause in the trend. This candle that broke the trendline signals the first hint of structural change.
I will be waiting for a retest and look to get involved in a short setup.
Ideally, what I look for in retests is to be met with a confirming candle. This would confirm the sellers have taken over and validate the change from uptrend to potential downtrend or consolidation phase.
My target would be around 1.1500.
Just sharing my thoughts for the charts, this isn’t financial advice. Always confirm your setups and manage your risk properly.
Disclosure: I am part of Trade Nation's Influencer program and receive a monthly fee for using their TradingView charts in my analysis .
EURO - Price will continue to grow inside rising channelHi guys, this is my overview for EURUSD, feel free to check it and write your feedback in comments👊
Recently, price entered to rising channel, where it soon reached the support level, which coincided with the support area.
After this movement, the price broke this level, but soon turned around and corrected the support line of the channel.
Next, EUR went back to $1.1365 level and broke it again, after which it made a retest and continued to move up.
In a short time, EUR rose to the resistance line of the channel, made a correction, and then grew to $1.1700 support level.
Price broke this level too and reached the resistance line of the channel, but not long ago corrected.
At the moment, I expect that the Euro can correct to the support line of the channel and then rise to $1.1900
If this post is useful to you, you can support me with like/boost and advice in comments❤️
Disclaimer: As part of ThinkMarkets’ Influencer Program, I am sponsored to share and publish their charts in my analysis.

Lingrid | EURUSD Pulled Back to Key Support levelFX:EURUSD is approaching a major confluence zone at 1.16422 where the downward channel meets the upward trendline and horizontal support. The structure remains bullish with a sequence of higher highs and higher lows, and the current pullback fits within a healthy correction phase. A strong bounce from this triple-support region could trigger a reversal toward 1.18320, validating the continuation of the broader uptrend. All eyes are now on the 1.16450 reaction point for early momentum signs.
📉 Key Levels
Buy trigger: bullish reaction from 1.16422 support zone
Buy zone: 1.16200–1.16500 (channel base + trendline + demand)
Target: 1.18320
Invalidation: confirmed 4H close below 1.1600 breaks upward structure
💡 Risks
Deeper push below the trendline may trap early buyers
Low liquidity during the bounce can cause fakeouts
Unexpected USD strength could stall recovery momentum
If this idea resonates with you or you have your own opinion, traders, hit the comments. I’m excited to read your thoughts!

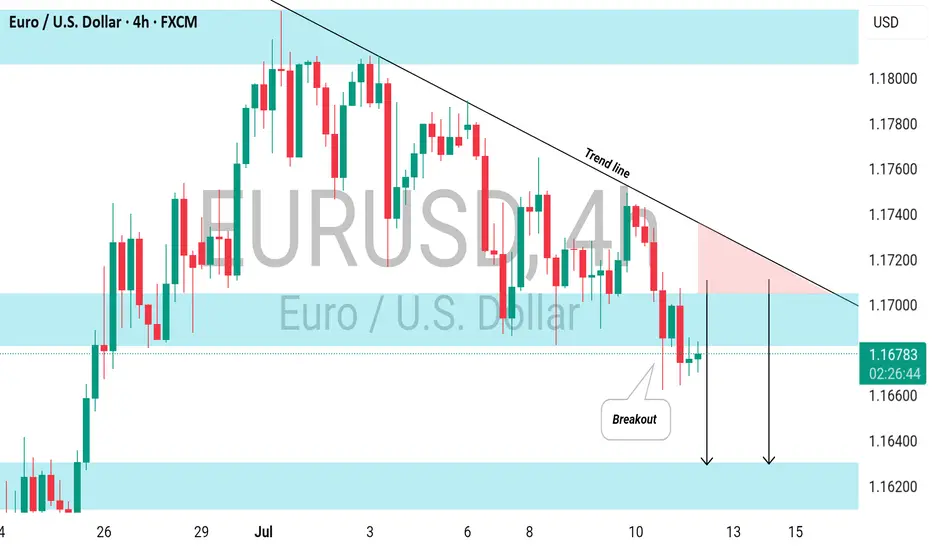
EURUSD: Bearish Continuation Ahead EURUSD is expected to maintain a bearish trend following a confirmed breakout below a significant horizontal support level.
The broken structure, along with a descending trend line, creates a contracting supply zone, indicating a strong likelihood of further downward movement.
The next target is 1.1620 support
EURUSD: Consolidation Phase Nearing the Main Trend!!Hey Traders, in today's trading session we are monitoring EURUSD for a buying opportunity around 1.16100 zone, EURUSD is trading in an uptrend and currently is in a correction phase in which it is approaching the trend at 1.16100 support and resistance area.
Trade safe, Joe.
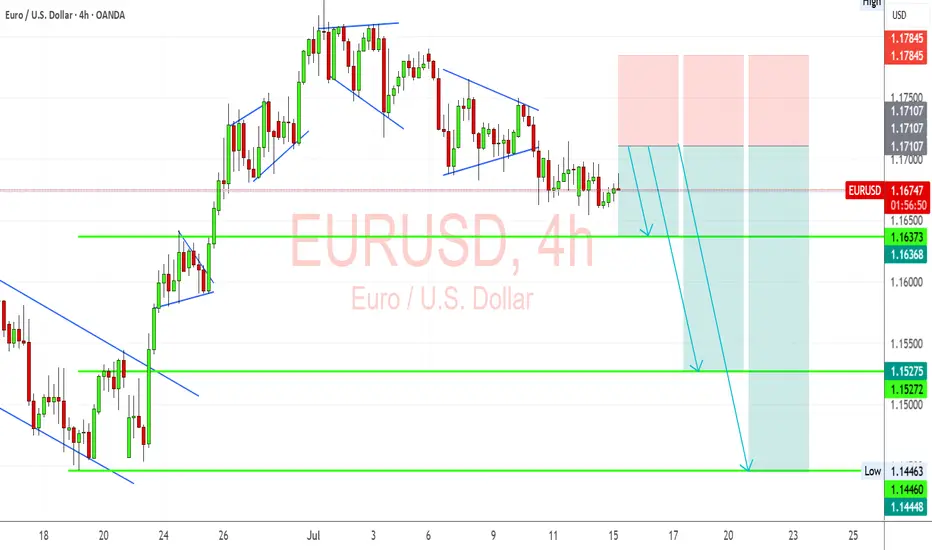
EURUSD Bearish Ahead as US Resilience Meets Eurozone FragilityEURUSD has shifted into bearish territory, pressured by growing divergence between a resilient US economy and a struggling Eurozone. The pair recently rejected the 1.1700 zone, forming multiple bearish structures on the 4H chart. With sticky US inflation, Trump’s renewed tariff agenda, and a dovish ECB, EUR/USD appears poised for a deeper move toward 1.1527 and possibly 1.1445 in the coming sessions. This setup is both technically and fundamentally aligned, but key event risk remains.
🔸 Technical Structure (4H)
Clear rejection from the 1.1700–1.1710 zone.
Bearish pennants and wedge patterns confirm continuation lower.
Downside targets:
🔹 First: 1.1637
🔹 Second: 1.1527
🔹 Final: 1.1445
Risk zone: Above 1.1785 (invalidates short bias if broken cleanly).
🧭 Key Fundamentals
🇺🇸 Dollar Strength: Sticky inflation, stable labor market, and geopolitical risk all favor USD demand.
🇪🇺 Euro Weakness: ECB dovish tone persists amid weak data, soft PMIs, and stagnating growth.
Yield Spread: US-Euro real yield spread supports further EUR/USD downside.
Tariff Pressure: Trump’s 50% tariff plan and tensions with the EU weigh on EUR.
⚠️ Risks to Watch
A surprise dovish pivot from the Fed.
Weak US CPI or disappointing retail sales.
Major risk-on flows that trigger broad USD weakness.
New EU fiscal stimulus or Germany/France recovery surprises.
📆 Key Events Ahead
🇺🇸 US Core CPI – A hot print supports USD strength.
🇺🇸 Retail Sales & Powell testimony – Watch tone on rate cuts.
🇪🇺 German ZEW Sentiment, Eurozone HICP inflation – Weak readings would further drag EUR.
🔄 Leader or Lagger?
EUR/USD is a lagger to GBP/USD, often following UK-driven USD moves.
Acts as a leader for EUR/JPY, EUR/AUD, EUR/CHF – weakness here cascades across EUR crosses.
Tracks broad USD sentiment – dovish Fed pricing boosts EURUSD, while rate hike fears drag it.
✅ Summary: Bias and Watchpoints
EUR/USD is bearish below 1.1700 as economic divergence, sticky US inflation, and rising geopolitical tensions favor the dollar. ECB policy remains soft, offering little support to the euro. Key risk lies in a dovish Fed pivot or softer US data. Watch US CPI and Powell for clues. This pair is likely to lag GBP/USD moves, but will lead EUR crosses lower if the downside momentum continues.
EURUSD - Compression Before Expansion? Key Reversal ZoneEURUSD is currently trading within a clear descending channel after rejecting a key resistance area. This move signals a shift in short-term sentiment, with bearish momentum guiding price action lower. The channel structure is intact, and as long as price respects this slope, lower levels remain in play.
Rejection From Resistance
After tapping into the major resistance zone, price failed to break higher and began forming lower highs and lower lows, confirming seller control. The rejection was clean and initiated the current bearish structure, which now serves as a roadmap for potential continuation lower.
Imbalance and Downside Targets
Below current price, there’s a visible imbalance that remains unfilled within the highlighted purple zone. This area acts as a magnet for price, especially if the bearish structure continues. A drop into this zone would align with a textbook move to fill inefficiency before a potential reversal can occur.
Support Structure and Liquidity Zone
There’s a strong support level marked just above the imbalance, which may offer a temporary reaction or even serve as a springboard for a reversal. This is also a likely liquidity pool, and a sweep of these lows could generate the fuel needed for a bullish move back toward mid-channel or even higher.
Projection and Scenarios
Price may either continue respecting the channel boundaries with stair-step retracements down into the imbalance, or break structure early with a more aggressive reversal once the inefficiency is filled. A deeper move into the purple zone followed by a reaction would suggest a potential shift in momentum.
Conclusion
The pair remains in a bearish corrective phase for now, with room to dip further into the unmitigated imbalance. Watch for how price reacts at support and whether a clean sweep and reversal setup presents itself. Until then, the channel remains the dominant structure guiding this move.
Disclosure: I am part of Trade Nation's Influencer program and receive a monthly fee for using their TradingView charts in my analysis.
___________________________________
Thanks for your support!
If you found this idea helpful or learned something new, drop a like 👍 and leave a comment, I’d love to hear your thoughts! 🚀

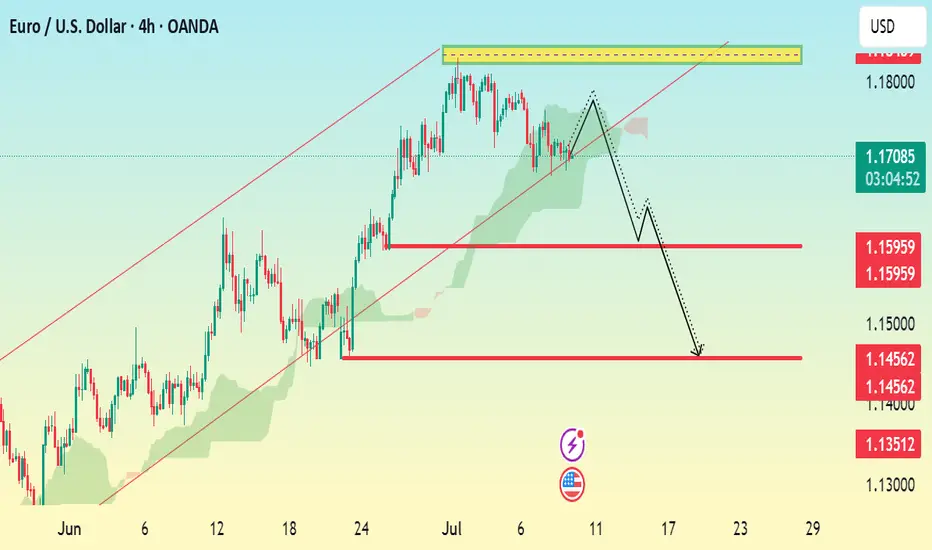
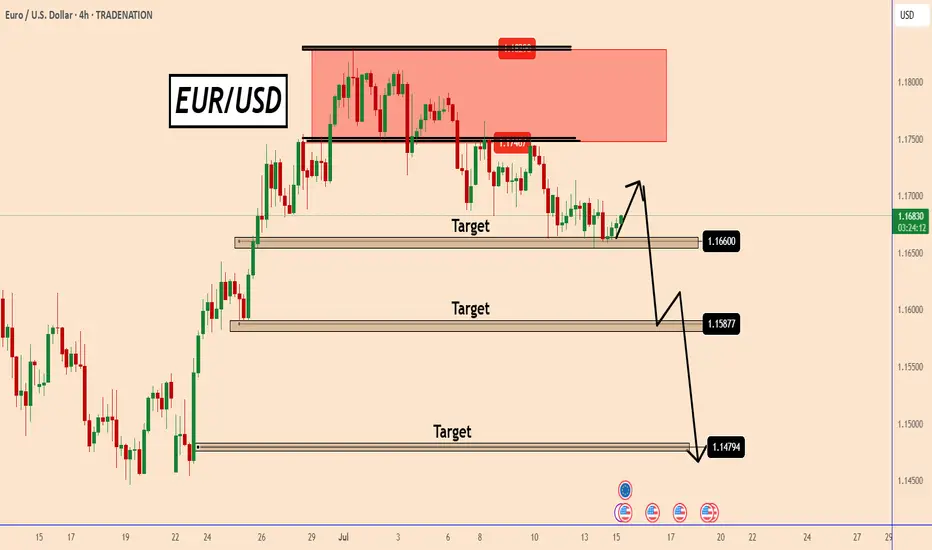
EUR/USD Bearish Setup H4 Chart AnalysisMarket Structure:
Current Price: 1.17057
The market has rejected a key resistance zone around 1.17600–1.17800 (highlighted in yellow).
Price formed a lower high, suggesting bearish momentum is taking control after an uptrend.
The pair is trading around a key trendline and Ichimoku cloud, with a likely break below.
Bearish Signals:
1. Double Top / Lower High Formation near 1.17600 indicates potential reversal.
2. Bearish Projection Drawn: Expecting a drop after the neckline break.
3. Support Zones Marked:
First Support/TP1: 1.1650 – 1.1595
Second Support/TP2: 1.1456
Final Target/TP3: 1.1351
EURUSD: Detailed Support & Resistance Analysis 🇪🇺🇺🇸
Here is my latest structure analysis and important
supports and resistances for EURUSD for next week.
Consider these structures for pullback/breakout trading.
❤️Please, support my work with like, thank you!❤️
I am part of Trade Nation's Influencer program and receive a monthly fee for using their TradingView charts in my analysis.

EURUSD is close to the end of its correctionEURUSD is consolidating in a wedge. The trend is bullish, with the correction reaching the 0.7 Fibonacci zone and making a false breakout, which generally changes the market imbalance.
All attention is on the wedge resistance (red line) and the 1.17000 level. A breakout of the resistance and consolidation of the price above this level will confirm the end of the correction and send the price higher.

EURUSDHello Traders! 👋
What are your thoughts on EURUSD?
Following its recent rally, EURUSD has reached a key resistance zone, which also aligns with a trendline. The pair failed to break above this area and has been rejected.
Given the weak momentum and bearish reaction, we do not expect a breakout at this stage.
Instead, we anticipate some consolidation around the resistance, followed by a downward move toward the specified support level.
Don’t forget to like and share your thoughts in the comments! ❤️

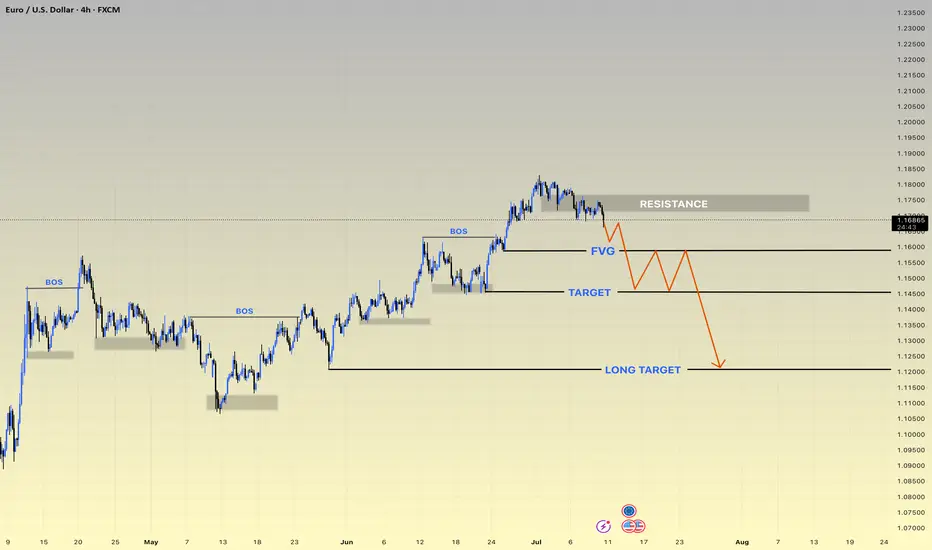
EURUSD h4 update ⚠️ Current Outlook: Reversal Zone Hit
• Price tapped into the strong RESISTANCE zone (~1.1800), failing to break higher.
• Market structure BOS (Break of Structure) confirms bearish intent.
• FVG (Fair Value Gap) likely to act as a short-term liquidity trap.
📍 Disrupted Bearish Flow:
1. Price rejects resistance aggressively ✅
2. Pullback into FVG may trigger a liquidity hunt 🧲
3. Fake bounce → Smart Money re-entry expected 👀
4. Target levels:
• 🥅 TARGET: 1.1550 zone (first major support)
• 🎯 LONG TARGET: 1.1200 zone (high probability zone for HTF buyers)
🔁 Bear Trap Setup Possibility:
• After hitting the LONG TARGET, price could reverse sharply.
• Watch for accumulation signs and deviation below key levels.
⸻
🔥 Key Zones to Watch:
• 🔳 Resistance: 1.1790–1.1820
• 🟦 FVG Retest Zone: 1.1630–1.1660
• 📉 Target Zone: 1.1500–1.1550
• 🚨 Long-Term Demand Zone: 1.1180–1.123
EURUSD is Approaching an Important Support!!Hey Traders, in today's trading session we are monitoring EURUSD for a buying opportunity around 1.16400 zone, EURUSD is trading in an uptrend and currently is in a correction phase in which it is approaching the trend at 1.16400 support and resistance area.
Trade safe, Joe.
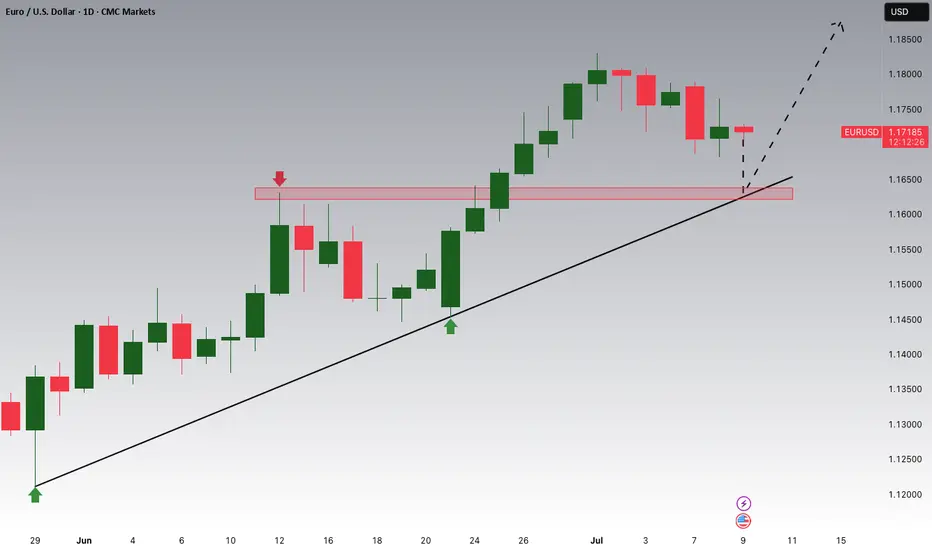
EUR/USD - Daily Chart (Wedge Breakout) (16.07.2025) The EUR/USD Pair on the D1 timeframe presents a Potential Selling Opportunity due to a recent Formation of a Wedge Pattern. This suggests a shift in momentum towards the downside in the coming Days.
Possible Short Trade:
Entry: Consider Entering A Short Position around Trendline Of The Pattern.
Target Levels:
1st Support – 1.0956
2nd Support – 1.0625
💡 Fundamental & Sentiment Context
Euro under pressure amid renewed concerns over EU‑US trade friction .
The USD is strengthening, supported by safe‑haven flows amid tariff uncertainties.
🎁 Please hit the like button and
🎁 Leave a comment to support for My Post !
Your likes and comments are incredibly motivating and will encourage me to share more analysis with you.
Best Regards, KABHI_TA_TRADING
Thank you.
Disclosure: I am part of Trade Nation's Influencer program and receive a monthly fee for using their TradingView charts in my analysis.

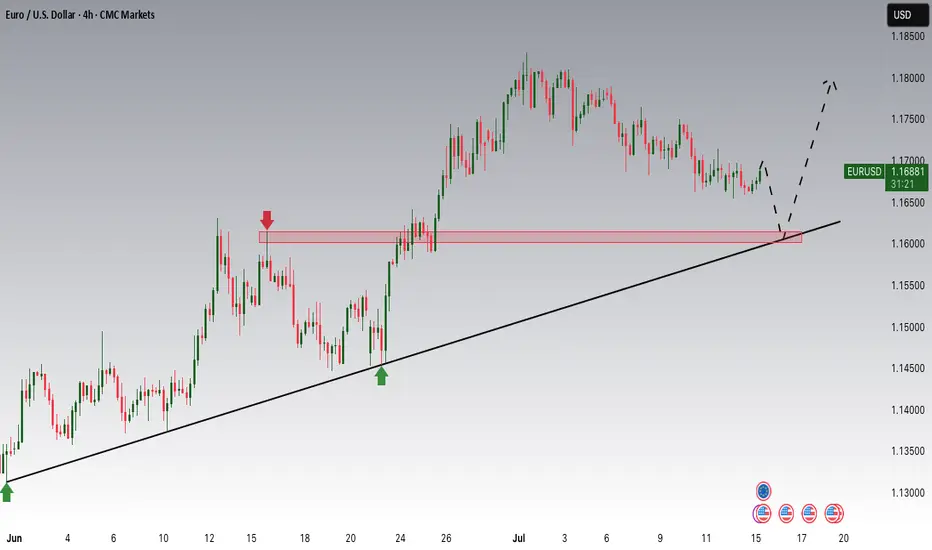
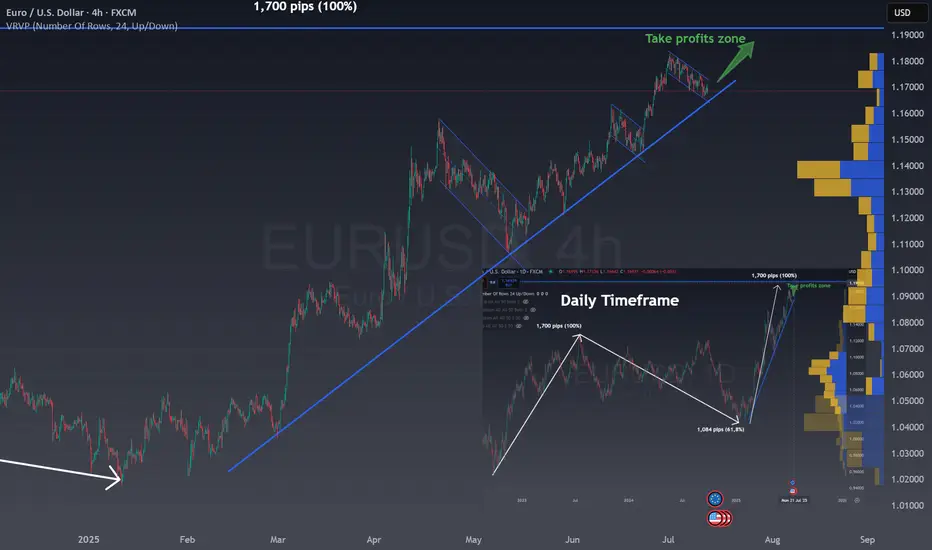
One last rally in EUR/USDIn the right bottom you can see the Daily chart for EUR/USD:
The chart shows the EUR/USD on a daily timeframe.
There was an initial strong rise of 1,700 pips, marked as a 100% move.
After this, the price corrected downward by 1,084 pips, which is 61.8% of the previous rise.
The 61.8% retracement is a common Fibonacci level, often signaling a reversal or pause.
Now, the price is moving up again, following a similar path as the first rise.
The chart suggests a possible new upward move of another 1,700 pips (100%).
A "take profits zone" is marked at the top, indicating a target area for traders.
This pattern reflects how markets often move in waves: trend, correction, and trend continuation.
Fibonacci levels help traders identify potential reversal points.
The chart is used to project future moves based on past price behavior.
The MAIN CHART shows a clear uptrend for EURUSD and the current correction with a flag.
The combination of both patterns give us a clear BUY zone in the channel and using the trend as support or once the channel break upwards.
This is a very good risk reward ratio trade situation where all traders should be!
EURUSD: Bigger Bearish Move is PossibleEURUSD: Bigger Bearish Move is Possible
EURUSD is positioned to fall further from the bearish pattern it is showing. The market is hesitant to fall further after we get the CPI data today. The US is expected to report a growth of 2.7% vs. 2.4% last month.
The impact of the data is unclear in my opinion because the market is not paying much attention to the data, but it should definitely increase the market volume which is decreasing in these summer days.
You may find more details in the chart!
Thank you and Good Luck!
PS: Please support with a like or comment if you find this analysis useful for your trading day
Disclosure: I am part of Trade Nation's Influencer program and receive a monthly fee for using their TradingView charts in my analysis.
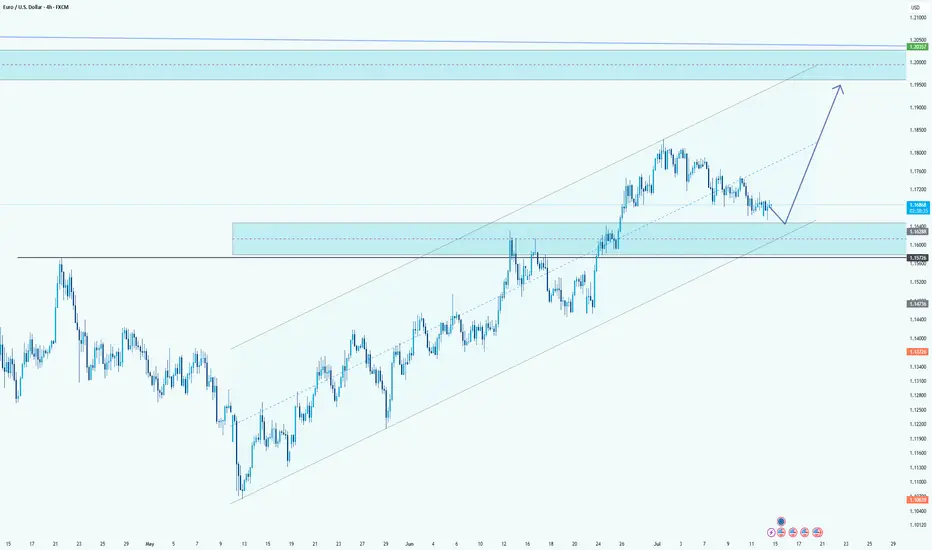
EUR/USD Retracement Into Demand ZoneHello guys!
EUR/USD is currently undergoing a healthy retracement after an extended bullish trend within the ascending channel. The price is now approaching a key demand zone, which aligns perfectly with the mid-line of the channel structure.
This zone previously acted as a strong resistance area and is now expected to serve as support, confirming a classic flip in market structure. The reaction around the 1.16288 - 1.15774 area will be crucial.
If buyers step in here, the bullish momentum is likely to resume with the next major target being the upper resistance zone near 1.20000 , as projected by the upward arrow. The overall structure remains bullish as long as the price holds above the channel support and doesn't close below the last demand zone.
EURUSD and Elliott Wave PrinciplesWe are currently on a Wave 5 that started when Wave 4(Red) completed. This 5th Wave expresses itself in 5 waves that are shown in Black. Our Wave 2 was a Zigzag and and we should expect a Flat correction for our Wave 4. When Wave 3 is complete an A Wave retests on the 261.8% Fib. level. Wave B goes beyond the end of Wave 3 and retests the confirms at the 423.6% Fib. level. This indicates the end of Wave B and the start of Wave C of the Flat, hence our Wave 4.

EURUSD Weakened By New Tariff Tensions With US This is the Weekly FOREX Forecast for the week of July 14 - 18th.
In this video, we will analyze the following FX market: EURSUD
The latest headlines tell the story. The tariffs are triggering a slow run to the USD safe haven. The previous week showed the USD Index closed pretty strong. There's a good chance we'll see more of the same this coming week.
Look for the strength in USD to continue to be supported by fundamental news, and outperform the other major currencies, including the EURO.
Buy USD/xxx
Sell xxx/USD
Enjoy!
May profits be upon you.
Leave any questions or comments in the comment section.
I appreciate any feedback from my viewers!
Like and/or subscribe if you want more accurate analysis.
Thank you so much!
Disclaimer:
I do not provide personal investment advice and I am not a qualified licensed investment advisor.
All information found here, including any ideas, opinions, views, predictions, forecasts, commentaries, suggestions, expressed or implied herein, are for informational, entertainment or educational purposes only and should not be construed as personal investment advice. While the information provided is believed to be accurate, it may include errors or inaccuracies.
I will not and cannot be held liable for any actions you take as a result of anything you read here.
Conduct your own due diligence, or consult a licensed financial advisor or broker before making any and all investment decisions. Any investments, trades, speculations, or decisions made on the basis of any information found on this channel, expressed or implied herein, are committed at your own risk, financial or otherwise.
