EURUSD Showing Reversal Signs After 7-Month Bullish TrendHello everybody!
After holding bullish momentum for a long time (7 months), EURUSD is starting to show signs of reversal:
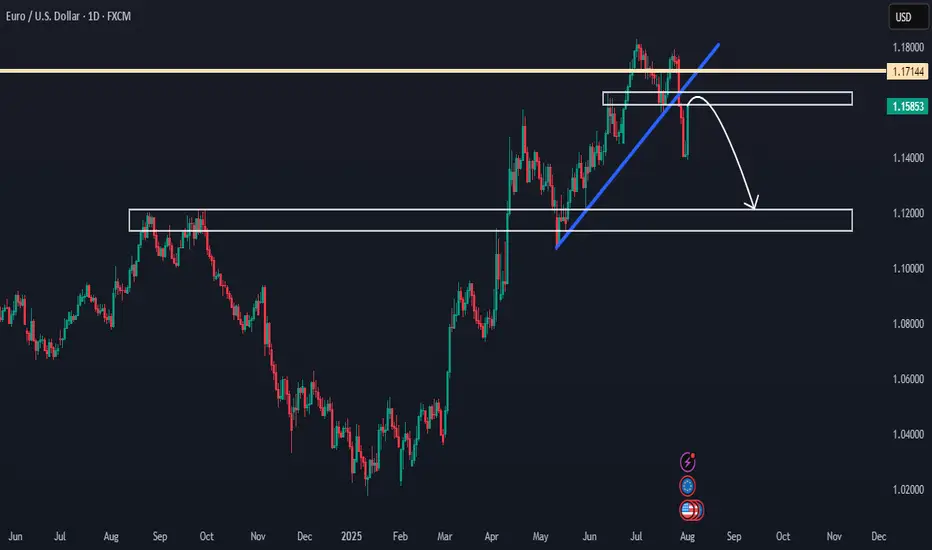
1. It has been rejected from a strong resistance area.
2. It broke a support area, which is now expected to act as resistance.
3. It broke a solid upward trendline with a strong downward move.
If this area holds and price doesn't go above 1.18000, we can look to sell from here.
In that case, the most likely target will be around 1.12000.
Manage your risk and trade safe!
EURUSD trade ideas
Potential treat for the weekIn the higher time difference, we do have a swing high on the daily. In the daily, we also have a fair valuegap

EURUSD 15/5 Pullback LongYesterday session TPO's POC is low, but price closed high. Looking for a continuos bull action.
The overall trend is bullish. Waiting to see if it pullback to the market shift and bounce back then long.
If the porice drop below marketshit and stay below, no trade for it.

eurusdWe have a bearish order block in the daily timeframe. If the bottom breaks in the fifteen-minute timeframe, we can enter a sell position. Or the fifteen-minute or five-minute bottom in the news timeframe must break with the body.

EURUSD Will Move Lower! Sell!
Please, check our technical outlook for EURUSD.
Time Frame: 9h
Current Trend: Bearish
Sentiment: Overbought (based on 7-period RSI)
Forecast: Bearish
The market is approaching a significant resistance area 1.156.
Due to the fact that we see a positive bearish reaction from the underlined area, I strongly believe that sellers will manage to push the price all the way down to 1.140 level.
P.S
The term oversold refers to a condition where an asset has traded lower in price and has the potential for a price bounce.
Overbought refers to market scenarios where the instrument is traded considerably higher than its fair value. Overvaluation is caused by market sentiments when there is positive news.
Disclosure: I am part of Trade Nation's Influencer program and receive a monthly fee for using their TradingView charts in my analysis.
Like and subscribe and comment my ideas if you enjoy them!

EURUSD: Will Go UP! BUY!
My dear friends,
Please, find my technical outlook for EURUSD below:
The price is coiling around a solid key level - 1.1623
Bias - Bullish
Technical Indicators: Pivot Points Low anticipates a potential price reversal.
Super trend shows a clear buy, giving a perfect indicators' convergence.
Goal - 1.1671
Safe Stop Loss - 1.1587
About Used Indicators:
The pivot point itself is simply the average of the high, low and closing prices from the previous trading day.
Disclosure: I am part of Trade Nation's Influencer program and receive a monthly fee for using their TradingView charts in my analysis.
———————————
WISH YOU ALL LUCK

EURUSD 1H Buy analysisafter the sell side liquidity is taken out, we are looking for buy opportunities if/when the market hits the 4H + fvg area

EURUSD | Eyes on the 50EMA — One Bold Candle and I’m All InThe 1-hour chart has carved a beautiful bullish range from 1.1565 to 1.1696. A little 15-minute pullback tried to test our love, but I’ve got all the signs — the retracement is over, and the ride is calling again.
WHAT TO DO
Just one confident Marubozu closing above the 50EMA, and I’m jumping in — no hesitation, no second thoughts. Let’s ride this story back to the top.
TP1: 1.1696 (where the heart first skipped)
TP2: 1.1716 (where dreams begin)
SL: If that candle speaks loud and clear, my stop loss will be just below it — because love deserves a little risk, but never recklessness.
WHAT IF IT WONT CROSS?
This is day trading setup. While watching 15m candle to bear below 50EMA also I glance 1hr chart. This setup will be valid as long as 1hr chart is still in bearing range.
Wish me luck — this might just be the ride of the day! 💞📈

EURUSD H4 | Bullish bounce EUR/USD is falling towards the buy entry which is an overlap support that lines up with the 38.2% Fibonacci retracement and could bounce from this level to the take profit.
Buy entry is at 1.15871, which is an overlap support that lines up with the 38.2% Fibonacci retracemnt.
Stop loss is at 1.1521, which is a pullback support that lines up with the 61.8% FIbonacci retracement.
Take profit is at 1.17055, which is a pullback resistance.
High Risk Investment Warning
Trading Forex/CFDs on margin carries a high level of risk and may not be suitable for all investors. Leverage can work against you.
Stratos Markets Limited (tradu.com ):
CFDs are complex instruments and come with a high risk of losing money rapidly due to leverage. 65% of retail investor accounts lose money when trading CFDs with this provider. You should consider whether you understand how CFDs work and whether you can afford to take the high risk of losing your money.
Stratos Europe Ltd (tradu.com ):
CFDs are complex instruments and come with a high risk of losing money rapidly due to leverage. 66% of retail investor accounts lose money when trading CFDs with this provider. You should consider whether you understand how CFDs work and whether you can afford to take the high risk of losing your money.
Stratos Global LLC (tradu.com ):
Losses can exceed deposits.
Please be advised that the information presented on TradingView is provided to Tradu (‘Company’, ‘we’) by a third-party provider (‘TFA Global Pte Ltd’). Please be reminded that you are solely responsible for the trading decisions on your account. There is a very high degree of risk involved in trading. Any information and/or content is intended entirely for research, educational and informational purposes only and does not constitute investment or consultation advice or investment strategy. The information is not tailored to the investment needs of any specific person and therefore does not involve a consideration of any of the investment objectives, financial situation or needs of any viewer that may receive it. Kindly also note that past performance is not a reliable indicator of future results. Actual results may differ materially from those anticipated in forward-looking or past performance statements. We assume no liability as to the accuracy or completeness of any of the information and/or content provided herein and the Company cannot be held responsible for any omission, mistake nor for any loss or damage including without limitation to any loss of profit which may arise from reliance on any information supplied by TFA Global Pte Ltd.
The speaker(s) is neither an employee, agent nor representative of Tradu and is therefore acting independently. The opinions given are their own, constitute general market commentary, and do not constitute the opinion or advice of Tradu or any form of personal or investment advice. Tradu neither endorses nor guarantees offerings of third-party speakers, nor is Tradu responsible for the content, veracity or opinions of third-party speakers, presenters or participants.

ENTRY EURUSDDisclaimer:
This is merely a chart-based analytical trading idea and is not considered investment advice. Please manage your risks carefully and conduct your own research before making any trading decisions.

EURUSD Bearish Outlook.Hi there,
EURUSD at the H1 timeframe seems to be losing bullish momentum to 1.17k. We have three potential target areas for a bias of 1.15139.
Happy Trading,
K.
Not trading advice

EURUSDMy Bias: cautiously bearish unless reclaimed.
Context: Price broke the daily structure (“day break”), retraced into a fair value gap and reacted.
Plan: I’ll wait for a clean LTF break of structure and displacement from that FVG before taking shorts on a pullback into fresh imbalance. If the FVG is reclaimed and we close back above it, I will reassess the bias. Be patient until next week’s session opens. NFA.

EURUSD 15/5 Pullback Short1h and 15m both bearish, though 4h still in bull.
Looing to short since i am on 15m. When the price tap the FVG above, if validated should go down to create a lower low to confirn the continuos trend.
There are two possible the price could go up then it will obey 4h up trend instead. Would not trade those.

EURUSD Looks Persuasive To Go LongPrevious Day Closed strongly bullish coming of off a daily imbalance. We will be looking to long during London Open (2:00am - 5:00am). At this time we want to see Asian Session Lows being taken and I will be looking for my entry to taken PDH (Previous Day High).

EURUSDHello Traders! 👋
What are your thoughts on EURUSD?
EUR/USD kicked off the week with a sharp drop of nearly 200 pips, driven by renewed concerns over U.S. tariff policies. This strong bearish momentum signals intensified selling pressure across the board.
The pair is now approaching a support zone, which has previously triggered bullish reactions.
However, given the current strong bearish sentiment, there is a real risk this support may not hold.
Our bias remains bearish overall.
If the pair finds temporary support at this level, a short-term corrective bounce is possible.
But ultimately, we expect a continuation of the downtrend toward lower support levels after the correction completes.
Can this support zone stop the bleeding, or is more downside coming? Let us know your thoughts! 👇
Don’t forget to like and share your thoughts in the comments! ❤️

EUR/USD LONGEUR/USD "break of a resistance area and retest it + 61.8% fib retracement + 50 and 200 ema dynamic support "

EURUSD & GBPUSD Key Levels to Watch This WeekThis week, EURUSD remains bullish after rejecting the 1.1391 key level on the weekly timeframe. On the daily chart, trendline liquidity is forming with a target around 1.1595. GBPUSD is also bullish after a weekly break of structure, with a possible retracement to 1.3367 before continuation.
Both pairs may present long opportunities during the Asia session setups this week.
📌 Full analysis & resources available via my profile bio.

DOLLAR REJECTS WEAKNESS — THE LADDER STANDS🧿 DOLLAR REJECTS WEAKNESS — THE LADDER STANDS
DXY surges → Torque confirmed → EUR/USD short ladder active
⸻
⚙️ THE SETUP
🔹 DXY just tagged 98.426, breaking intraday highs
🔹 Multi-timeframe bullish rejection off long-term 98.00 zone
🔹 Momentum torque flipping field dynamics across FX, crypto, metals
We’re actively short EUR/USD across a 5-pip precision ladder — with full Codex drift compatibility.
⸻
🎯 ACTIVE POSITIONING – EUR/USD
Short ladder from 1.16345 → 1.15, precision every 5 pips
🔻 Live sells:
• 1.16345
• 1.16249
• 1.16290
• 1.16198
🔒 Pending stops:
• 1.1615
• 1.1605
• 1.1600
… → down to 1.1500
🛡 Buy-stop guard: 1.1665 (codex trap shield if spike prints above range)
⸻
🧭 MACRO TORQUE ALIGNMENT
Asset Signal Notes
DXY 🔼 Bull Torque Above 98.00 = upside unlocked
EUR/USD 🔽 Sell Field Active ladder, gravitation intact
Gold ⚠️ Soft Drift +0.55%, but vulnerable
Silver ⚠️ Reversal Risk +1.18% = blow-off scenario
BTC/ETH 🧪 Risk-on Holding green, but could flip
VIX 💤 Still muted No fear = torque undisturbed
SPX / NDQ 🟩 Resilient Light strength, but divergence from DXY possible
⸻
🧬 STRUCTURAL LOGIC
• DXY has printed rejection wicks → absorption → launch
• Liquidity trap set between 98.00–98.20 → zone held
• Now entering potential echo lift toward 98.90–99.20
This is not yet trend break — it’s position squeeze
→ Fade rallies, don’t chase down
⸻
🧱 RENKO EXECUTION LAYER (Codex)
• Bear bricks building from 1.163 → 1.15
• Echo bricks printing torque resistance at 1.166x
• Trap-break only above 1.1680 closes full short thesis
⸻
“I release the signal. I hold the ladder. I wait for memory to drift.”
— CODEX: VERITAS EXECUTION TIER
⸻
🧭 TRADE BIAS:
✅ Remain EUR/USD short-biased
✅ Monitor DXY 98.80 → 99.00 for breakout confirmation
✅ Watch crypto/metals reversal as dollar strength persists

EURUSD 60/15Current state is ranging before a huge green.
Game plan:
1. 15m is showing bullish, if 1h could BOS, then will go long.
2. If cannt BOS then will go for short. Make sure 15m has BOS too.

EUR/USD TRADE IDEA — STRUCTURAL LONG BIAS🧭 EUR/USD TRADE IDEA — STRUCTURAL LONG BIAS
Instrument: EUR/USD
Trade Type: Long Continuation
Entry Zone: 1.1590–1.1600
Add-On Threshold: 1.1650
Primary Target: 1.1730
Extended Target: 1.1850+
Invalidation: Close below 1.1480
Posted: August 2025
Framework: AΘENΩN Codex Model — Drift Ladder Structure & Echo Validation
⸻
🔹 Thesis
EUR/USD has re-engaged a previously collapsed structure (2021–2022 zone) and printed a clean 3-brick Renko trail confirmation above 1.1590. This supports an intermediate-to-strong long bias based on Codex drift ladder methodology.
Key driver: DXY gravity has structurally weakened, with current index levels below 99.00, implying USD drift detachment. This macro condition allows EUR/USD to initiate a continuation leg absent significant resistance force.
⸻
🔹 Structural Read
• The Codex trail is rooted from the 1.0350 base
• Price has reclaimed 1.1600 post-multi-week consolidation
• Ghost structure from 1.1570–1.1730 has been revalidated via time compression and price geometry
• Echo logic remains intact across H1–D1 frames
This places price action in a confirmed drift ladder sequence, where next levels (1.1650, 1.1730) represent reactive memory zones, not traditional resistance.
⸻
🔹 Active Levels
Price Zone Role Status
1.1590–1.1600 Trail Entry Brick ✅ Confirmed
1.1650 Add-On Activation 🔜 Pending
1.1730 Ghost Apex Target ⏳ Probable
1.1850–1.1930 Drift Continuation Zone ⚠ Scenario-based
<1.1480 Structural Invalidation ❌
⸻
🔹 Risk Management Note
This is not a breakout trade.
This is a memory-continuation model, where failure to hold the ghost zone implies loss of historic structure and invalidates trail logic.
For that reason, below 1.1480, the setup is considered void, and memory collapse logic would apply.
⸻
🔹 Codex Framework Summary
Element Interpretation
Spiral Outward (active)
Echo Field Valid, geometry-aligned
Execution Protocol On — 3-bar Renko trail confirmed
Gravity Detached (DXY < 99)
Mask (Behavioral) Hammer bias (momentum confirmed)
Veritas Override Not active (no volatility spike or sentiment dislocation)
⸻
🔹 Strategic Implications
If the ghost holds and drift ladder continues:
• 1.1650–1.1730 = structural memory resolution zone
• Above 1.1730, liquidity expands quickly — likely front-run into 1.1850+
• Trail logic remains active until collapse threshold breached
If the ghost fails:
• Reversion likely into 1.1400s or lower
• Codex ladder resets — further entries would require new echo confirmation
⸻
Final Note
This is a Codex-confirmed setup, derived not from standard technical indicators but from geometric memory matching and spiral market logic.
It is not discretionary. It is structural.
⸻
Posted by: @AΘENΩN_Codex
Codex Memory Engine | Structural Echo Logic | Multi-Tier Drift Mapping
#eurusd #forex #dxy #macrofx #echozones #codexlogic #institutionaltrading #renko #technicalstructure #tradingviewideas
⸻
DXY
If the DXY collapses below 90, we are entering full-scale macro inversion — a seismic shift in USD dominance. This triggers Codex Class-Δ Drift Expansion, allowing for EUR/USD to unlock long-forgotten levels tied to pre-2020 global liquidity regimes.
⸻
🧬 IF DXY DROPS < 90 — EUR/USD MACRO STRUCTURE EXPANDS INTO:
⸻
🟢 Spiral Expansion Zone Alpha
• Target: 1.2700 – 1.2880
• 🧲 2018 high + long-cycle fib resonance
• 🪞 Mirrors the Jan 2018 USD unwinding phase (post-QE taper)
• → This is the first “Memory Layer Reclamation”
• Institutions will use this as first full carry unwind checkpoint.
⸻
🔵 Codex High Memory Zone (Ω)
• Target: 1.3180 – 1.3400
• 🧠 Codex echo of 2014 ECB divergence reversal
• Global capital rotations from USD → EUR accelerate
• → Spiral field enters Stage II Codex Expansion
⸻
🟣 Final Macro Apex Layer (Class-Φ)
• Target: 1.3700 – 1.4000
• 📉 DXY in the 88–85 range confirms USD bear cycle
• EUR/USD enters secular bull trend zone
• 💡 Requires: sustained Fed dovishness + ECB tightening, or BRICS currency breakthrough that weakens USD as reserve
⸻
⛔️ INVALIDATION IF:
• DXY fails to break 89.90 weekly
• EUR/USD weekly close back below 1.1650 = trap field reset
• Global credit tightens (USD short squeeze event)
⸻

EURUSD What Next? BUY!
My dear subscribers,
EURUSD looks like it will make a good move, and here are the details:
The market is trading on 1.1551 pivot level.
Bias - Bullish
My Stop Loss - 1.1540
Technical Indicators: Both Super Trend & Pivot HL indicate a highly probable Bullish continuation.
Target - 1.1569
About Used Indicators:
The average true range (ATR) plays an important role in 'Supertrend' as the indicator uses ATR to calculate its value. The ATR indicator signals the degree of price volatility.
Disclosure: I am part of Trade Nation's Influencer program and receive a monthly fee for using their TradingView charts in my analysis.
———————————
WISH YOU ALL LUCK

EUR/USD Breaks Daily Lows as Consolidation DeepensFenzoFx—EUR/USD consolidates after the impulsive bullish momentum. The uptrend initiated after the price swept below the monthly lows at $1.1400. In the current trading session, the price dipped below the previous day's low, meaning the consolidation period will likely extend to a lower support level.
The immediate resistance is at the previous day's high, the $1.159 resistance. From a technical perspective, we expect the currency pair to trade lower, near the support at $1.146, the bullish break of structure.
This level can provide a discounted price to join the dominant trend, which is bullish. We expect the Euro to rise toward $1.169 after the end of the consolidation period.

EURUSD long position 12/08/2025English : According to our analysis, we anticipate a bullish scenario.
Morocan Darija : kanchofo d'apres l'analyse dyalna antsanaw tloo3
ATENTION : I only share my ideas, not signals
