EURUSD "trend lines dont work and they are worthless" I was laughing when i see some traders, sorry, "traders" who say theres no worth in trend lines, they dont work etc, yet, well know traders use it and make profit from it. This is what im saying about some traders, just because they comment or say something, dont feel that you have to defend yourself. Some people are just like this, and making such absolute comments like that makes you think they come across as knowing it all. Trading is not about proof, its about getting what works for you. Dont let them in, they are just looking to argue baseless convos which lead nowhere. Stay positive, keep going, dont quit.
EURUSD trade ideas

EUR-USD Potential Long! Buy!
Hello,Traders!
EUR-USD made a retest
Of the horizontal support
Of 1.1590 from where we
Are already seeing a bullish
Rebound thus we will be
Expecting a further
Bullish move up
Buy!
Comment and subscribe to help us grow!
Check out other forecasts below too!
Disclosure: I am part of Trade Nation's Influencer program and receive a monthly fee for using their TradingView charts in my analysis.

EURUSD On The Rise! BUY!
My dear friends,
EURUSD looks like it will make a good move, and here are the details:
The market is trading on 1.1618 pivot level.
Bias - Bullish
Technical Indicators: Supper Trend generates a clear long signal while Pivot Point HL is currently determining the overall Bullish trend of the market.
Goal - 1.1642
Recommended Stop Loss - 1.1606
About Used Indicators:
Pivot points are a great way to identify areas of support and resistance, but they work best when combined with other kinds of technical analysis
Disclosure: I am part of Trade Nation's Influencer program and receive a monthly fee for using their TradingView charts in my analysis.
———————————
WISH YOU ALL LUCK


EUR-USD Support Ahead! Buy!
Hello,Traders!
EUR-USD is making a local
Bearish correction but
We are bullish biased mid-term
So after the pair hits the horizontal
Support of 1.1577 we will be
Expecting a local bullish rebound
Buy!
Comment and subscribe to help us grow!
Check out other forecasts below too!
Disclosure: I am part of Trade Nation's Influencer program and receive a monthly fee for using their TradingView charts in my analysis.

EURUSD Will Move Lower! Short!
Here is our detailed technical review for EURUSD.
Time Frame: 4h
Current Trend: Bearish
Sentiment: Overbought (based on 7-period RSI)
Forecast: Bearish
The market is testing a major horizontal structure 1.167.
Taking into consideration the structure & trend analysis, I believe that the market will reach 1.157 level soon.
P.S
The term oversold refers to a condition where an asset has traded lower in price and has the potential for a price bounce.
Overbought refers to market scenarios where the instrument is traded considerably higher than its fair value. Overvaluation is caused by market sentiments when there is positive news.
Disclosure: I am part of Trade Nation's Influencer program and receive a monthly fee for using their TradingView charts in my analysis.
Like and subscribe and comment my ideas if you enjoy them!

EURUSD – DAILY FORECAST Q3 | W32 | D7 | Y25📊 EURUSD – DAILY FORECAST
Q3 | W32 | D7 | Y25
Daily Forecast 🔍📅
Here’s a short diagnosis of the current chart setup 🧠📈
Higher time frame order blocks have been identified — these are our patient points of interest 🎯🧭.
It’s crucial to wait for a confirmed break of structure 🧱✅ before forming a directional bias.
This keeps us disciplined and aligned with what price action is truly telling us.
📈 Risk Management Protocols
🔑 Core principles:
Max 1% risk per trade
Only execute at pre-identified levels
Use alerts, not emotion
Stick to your RR plan — minimum 1:2
🧠 You’re not paid for how many trades you take, you’re paid for how well you manage risk.
🧠 Weekly FRGNT Insight
"Trade what the market gives, not what your ego wants."
Stay mechanical. Stay focused. Let the probabilities work.
FX:EURUSD

Swing short on EURUSDPotential swing short on EURUSD. This was evaluated on the 1 day timeframe. TP on recent support zone.

Waiting for EURUSD to Trap Short OrdersAs we can tell on high-time price respected the daily imbalance (bullish).
We want to see false breakout on London open to which we will be looking for longs.
Potential entry criteria has been outlined on the charts.

EUR/USD Analysis Based on Volume, Fibonacci & Stochastic
This EUR/USD trade setup is structured using:
Volume analysis to locate key activity zones
Fibonacci retracement for confluence
Stochastic indicator to refine the timing of entry
🔹 Entry: 1.1546
🔹 Stop-Loss: 1.1588
🔹 Take-Profit: 1.1506
🔹 Risk-to-Reward Ratio: 1.02
⚠️ Disclaimer: This analysis is for educational purposes only and is not financial advice. Always manage your risk and trade responsibly.

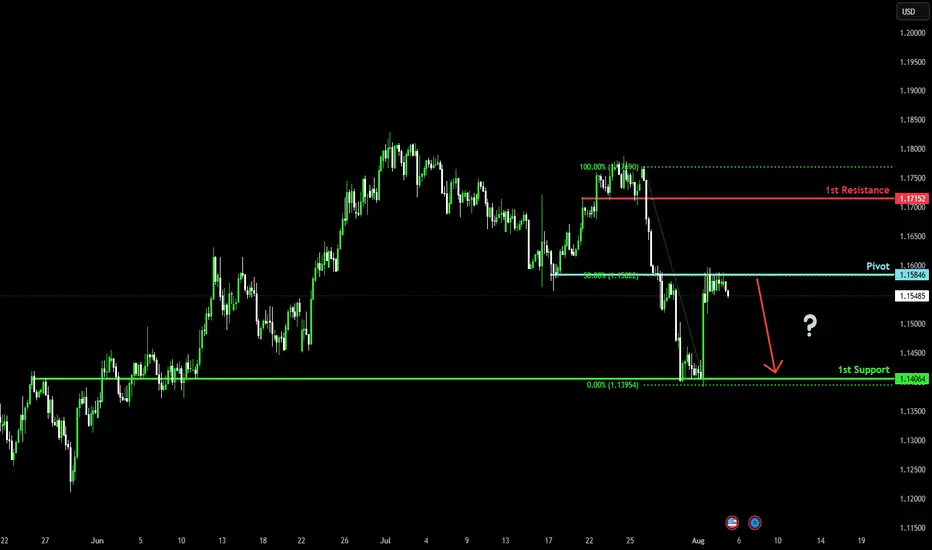
Bearish drop off pullback resistance?The price has rejected off the pivot, which has been identified as a pullback resistance that lines up with the 50% Fibonacci retracement and could drop to the 1st support.
Pivot: 1.1584
1st Support: 1.1406
1st Resistance: 1.1715
Risk Warning:
Trading Forex and CFDs carries a high level of risk to your capital and you should only trade with money you can afford to lose. Trading Forex and CFDs may not be suitable for all investors, so please ensure that you fully understand the risks involved and seek independent advice if necessary.
Disclaimer:
The above opinions given constitute general market commentary, and do not constitute the opinion or advice of IC Markets or any form of personal or investment advice.
Any opinions, news, research, analyses, prices, other information, or links to third-party sites contained on this website are provided on an "as-is" basis, are intended only to be informative, is not an advice nor a recommendation, nor research, or a record of our trading prices, or an offer of, or solicitation for a transaction in any financial instrument and thus should not be treated as such. The information provided does not involve any specific investment objectives, financial situation and needs of any specific person who may receive it. Please be aware, that past performance is not a reliable indicator of future performance and/or results. Past Performance or Forward-looking scenarios based upon the reasonable beliefs of the third-party provider are not a guarantee of future performance. Actual results may differ materially from those anticipated in forward-looking or past performance statements. IC Markets makes no representation or warranty and assumes no liability as to the accuracy or completeness of the information provided, nor any loss arising from any investment based on a recommendation, forecast or any information supplied by any third-party.
EUR/USD – 15M | Bearish Continuation Setup Price has completed a liquidity sweep at the P1D High / Equal High and broken structure, shifting market sentiment bearish.
Currently reacting from Equal Low (EQL) support, but a move into the Fair Value Gap (FVG) could provide the last mitigation before continuation to the downside.
Bearish Roadmap:
1️⃣ Pullback into FVG for mitigation.
2️⃣ Drop into the Order Block (OB) around 1.15700.
3️⃣ Break OB support → continuation toward lower liquidity pools near 1.15500.
Key Levels:
P1D High / Equal High: 1.16780
Swing High: 1.16250
FVG: 1.16050 – 1.16100
OB Target: 1.15700
Final Target: 1.15500
🎯 Looking for short entries inside FVG with targets at OB and liquidity levels below.

EURUSD - BullishOverall EURUSD is looking Bullish
been holding Longs since last few days
aggressive entry today after ASIAN session.
use half your risk

EUR/USD is currently at a resistance areaConsider placing a sell stop around this zone — it’s a strong area for potential downside moves. If this zone is broken to the upside, look for buying opportunities instead.

EURUSD: Bullish Breakout + Pullback to Order Block
Bias: Bullish
Pair: EURUSD
Higher Timeframe Context (4H)
• Price broke the previous high at 1.14941 with strong bullish momentum.
• Major sell-side liquidity located at 1.14463 has been swept.
• After the liquidity sweep, price mitigated a refined order block zone between 1.13992 – 1.13725.
Lower Timeframe Context (30M & 5M)
• On the 30-minute chart, a major lower high at 1.15892 was broken, confirming bullish structure.
• Sell-side liquidity at 1.15271 on the 30M timeframe has been cleared.
• Expecting price to retrace into the refined order flow area between 1.14379 – 1.13924 for a potential long setup.
Execution Plan
• Wait for price to enter the refined order flow zone.
• Drop down to 5M timeframe for entry confirmation (looking for liquidity sweep and bullish shift in structure).
• Target 5M highs and 30M highs for profit-taking.
Key Levels
• 4H High (broken): 1.14941
• 4H Order Block Zone: 1.13992 – 1.13725
• 30M Liquidity: 1.15271
• Refined Entry Zone: 1.14379 – 1.13924
Summary:
Market structure is bullish across the higher timeframes. After the liquidity sweeps and order block mitigations, a retracement into the refined demand zone is expected, providing a favorable setup to join the continuation higher towards 5M and 30M timeframe highs.

EURUSD. Daily AnalysisHi traders and investors!
This analysis is based on the Initiative Analysis concept (IA).
Buyers have broken through 1.15994 and 1.16108.
Buyer targets on the daily TF remain the same: 1.17110, 1.17888, 1.18299.
If a strong seller doesn’t emerge (spread/volume), look for buy setups at the blue levels: 1.15971, 1.15278.
Prefer scouting for patterns on the 1H, 2H, or 4H timeframes.
Wishing you profitable trades!

EURUSD confidence 84% BullOur analysis found that the current market for the future trend of the currency to reach a more consistent bearish expectations, mainly benefited from the improvement of macroeconomic indicators and liquidity environment easing.
Combined with news and professional analysis reports, identified "policy support", "economic recovery" and other key words accounted for a significant increase in the proportion of market participants in a positive mood, promoting the formation of a long atmosphere.
The capital flow model shows that cross-border capital inflows have increased, and institutional investors are gradually increasing their holdings of the currency, indicating that there is sufficient support on the capital side to enhance the sustained upward momentum of the price.
We recommended that investors combine the signal to reasonably plan the position layout, especially in the market adjustment to grasp the timing of entry and achieve cost optimization.
Position Management Recommendations:
Layout in batches, control the overall position ratio, avoid over-concentration, and pay attention to risk points in time to ensure capital safety.

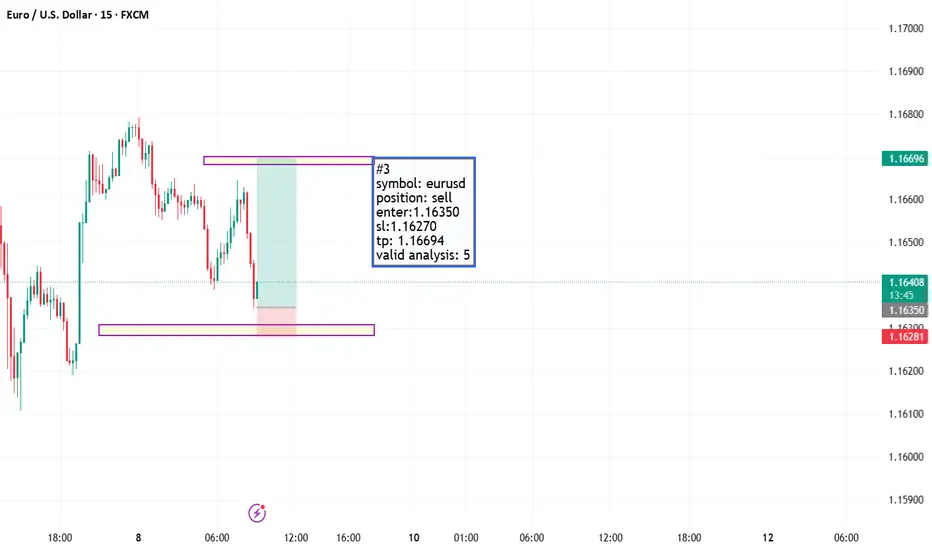
EURUSD – Critical Zone AheadBack on June 29, I shared a buy idea on EURUSD (tagged below this post).
Due to a busy schedule, I couldn't post an update—but as you can see, price reacted to my marked zone, did a quick stop-hunt, and moved up strongly.
Now, the current zone marked on the chart is a potential short area,
but again—we don’t tell the market what to do. We follow it.
📌 If the level breaks upward, we’ll wait for a pullback to go long.
If a valid short signal shows up, we’ll go short.
🔁 Anything can happen—this is why I always remind traders:
Don’t stand in front of the market.
Those who do… often end up like sardines eaten by the whales 🐋—liquidated and out of capital.
Let the market choose the direction, and we simply follow.
📈 Stay flexible. Stay humble. Stay profitable.

EURUSD UPTREND IS STILL INTACT
📊 Trend Analysis:
Primary Trend: Uptrend
From January to mid-July 2025, EUR/USD formed higher highs and higher lows — indicating strong bullish momentum.
Recent Correction:
After peaking around 1.18700, price retraced sharply to the 1.13800–1.14800 zone, testing previous structure support before bouncing.
---
🔍 Key Price Levels:
Level Type Notes
1.18700 Resistance Recent swing high (mid-July). Price rejected strongly from here.
1.17760 Resistance Intermediate high. May act as short-term cap.
1.15860 Support Previous consolidation area and key breakout zone.
1.13960–1.14800 Support Area of bullish reaction – demand zone.
---
🧠 Market Structure:
Break of Structure: The dip below 1.15860 suggests a temporary break in bullish structure.
Liquidity Grab / Stop Hunt: The aggressive sell-off followed by a fast recovery hints at institutional liquidity grab below 1.15000 zone.
Current Status: Price is rebounding after sweeping lows and is now retesting the 1.16700–1.17700 resistance zone.
Volume Observation:
Volume remains moderate—no extreme spikes, indicating no panic selling or aggressive institutional selling at this stage.
---
Conclusion:
Bias: Bullish
As long as price holds above 1.15860–1.14910 and the ascending trendline, the bullish structure remains intact.
A clean break below 1.14910 and the trendline would invalidate the bullish structure and may lead to deeper corrections toward 1.12060 or 1.10160.
---
Trade Idea (Example):
Entry: Around 1.15860 (on a successful retest)
Stop-Loss: Below 1.14900
Targets: 1.17760, 1.18710
NB
Hi Traders,Please let's take note that my previous analysis on EURUSD on SELL is no more valid, EURUSD is no more SELLING is now BUY does the new correction

EUR/USD Long Setup – Breakout Toward 1.18260📈 EUR/USD Long Setup – Breakout Toward 1.18260 🎯
Pair: EUR/USD
Timeframe: 1D
Status: Bullish Setup
Date: August 6, 2025
📝 Analysis:
EUR/USD has shown strong bullish momentum after bouncing off the key support level near 1.15700. The price has broken recent resistance and is currently trading around 1.16600, suggesting potential continuation toward the next major resistance zone.
💡 Trade Idea:
Entry: 1.16600 (current market price)
Target: 1.18260 (resistance zone)
Stop Loss: 1.15793 (below recent support)
Risk-Reward Ratio: Approximately 2:1
The bullish momentum is supported by recent price action and technical structure. A clean break and hold above 1.17623 will add further confirmation to the uptrend continuation.
📌 Key Levels to Watch:
Resistance: 1.17623 / 1.18260
Support: 1.16536 / 1.15793
Major Support Below: 1.13883 / 1.10833

Pushing Hard To RisePrice has been butting up against the 1.1585 level for days. I believe a large breakout is brewing.
Weekly point of control and the dailies are all in a similar area. Still that huge fair value gap from last week below, but I believe this will stay for now.
I believe the highs at 1.1800 will be tested again and possibly broken. There seems to be little faith in the USD at the moment.

EURUSD live intraday trade with break down 6k profit EUR/USD remains offered near 1.1550 after US ISM data
EUR/USD is trading in negative territory on Tuesday, hovering around 1.1550 on the back of a decent comeback in the US Dollar. The data from the US showed that the ISM Services PMI edged lower to 50.1 in July from 50.8 in June, helping the pair limit its losses.
