Fundamental Market Analysis for August 8, 2025 EURUSDThe EUR/USD exchange rate remains stable after rising during the previous three sessions, trading at around 1.1660 during Asian trading hours on Friday. The pair may regain its positions as the US dollar (USD) may struggle as markets assess the probability of a 25 basis point (bp) rate cut at the September meeting at nearly 93%, compared to 48% a week ago.
Expectations for a Fed rate cut in September have intensified as the number of new applications for unemployment benefits in the US increased after the US nonfarm payrolls (NFP) report for July pointed to a cooling labor market.
Data on initial jobless claims in the US showed that the number of US citizens filing new claims for unemployment benefits rose to 226,000 for the week ending August 2. This figure exceeded the market consensus forecast of 221,000 and was higher than the previous week's figure of 218,000.
The probability that the central bank will leave rates unchanged is approximately 87%. Markets estimate the probability of another ECB rate cut before March 2026 at only 60%.
Trade recommendation: BUY 1.1660, SL 1.1625, TP 1.1710
EURUSD trade ideas

Long EURUSDPrice will push up to fill the gap
Even though 1D chart is in the short trend
But the price need to go back to fill the gap
If the price still not break the sell trend of 1D
then it will head back down to fill 1.10 imbalance below

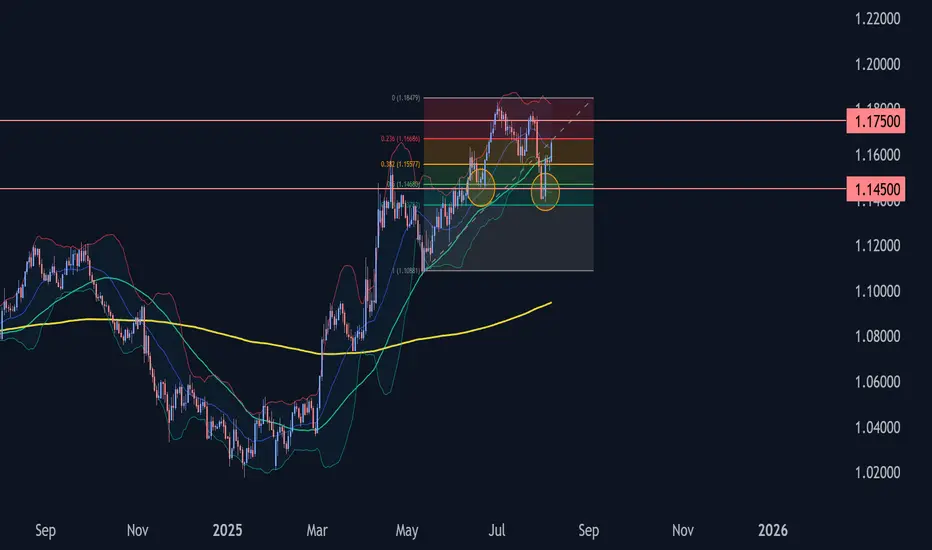
EURUSD Bearish Market Structure Unfolding – Liquidity Grab BelowEURUSD Bearish Market Structure Unfolding – Liquidity Grab Below Support Expected"
🔍 Technical Analysis Breakdown:
🔺 Resistance Zone (1.17500 - 1.18500)
Labelled “Strong High”, this is a high-supply zone where price previously reversed.
Multiple Break of Structure (BOS) and Change of Character (CHoCH) confirm this as a strong bearish supply area.
Any retracement toward this level could be ideal for short entries.
🟩 Fair Value Gap (FVG)
This imbalance area previously served as a magnet for price before it broke down.
Price failed to hold inside the FVG, reinforcing bearish sentiment.
🔻 Support Zone (1.13500 - 1.14000)
Marked as a "Weak Low", suggesting this level is likely to be taken out in a liquidity sweep.
Price is expected to retest and potentially break below this zone in the near term.
📉 Current Price Action
Recent CHoCH (Bearish) confirms shift in structure.
Price has made a corrective pullback and seems poised for another leg down.
Highlighted grey zone suggests price may retrace slightly higher before continuing its bearish move.
🎯 Bias: Bearish
Expecting downside continuation toward 1.13500 support, targeting liquidity below.
Traders may wait for rejection signals on lower timeframes around the minor pullback zone before executing shorts.
📚 Educational Notes:
CHoCH indicates a shift in market sentiment (from bullish to bearish).
FVG often acts as a magnet but if not respected, confirms momentum in the opposite direction.
Support/Resistance zones are used to determine institutional activity zones.

EUR/USD Breakout Ladder — Targeting 1.20+
📊 EUR/USD Breakout Ladder — Targeting 1.20+
Strategy: Staggered buy stops every 5 pips
Executed Range: 1.15792 → 1.20000
Lot Size: 0.1 per rung average
Stops/TP: No SL / No TP — trailing begins above 1.2025
Status: All orders placed — waiting for price to do the work
⸻
🔍 Trade Thesis
EUR/USD is climbing cleanly through multi-week resistance levels with no exhaustion signs yet on H1/H4.
This is a precision ladder build, not a directional bet — letting price trigger into strength only.
Key Zone Ahead:
🟦 1.2000 = major psychological + historical structure
🔓 Trail logic activates only after confirmed close above 1.2025–1.2040
📈 If momentum holds, next macro levels are 1.2250 → 1.2500+
⸻
🌐 Macro Correlation Map (Live)
Asset Signal Implication for EUR/USD
DXY 98.12 (↘) ✅ USD weakness supports upside
VIX 16.77 (↓ 6%) ✅ Low fear = risk-on flow
SPX 6,345 (↑ 0.73%) ✅ Broad risk bid confirms trend
BTC/USD 114,514 (↓ 0.45%) ⚠️ Minor drag, but not dominant driver
GOLD $3,378.72 (↑ 0.28%) 🟨 Stable —
no conflict with EUR strength
US10Y Not shown, but yields soft ✅ Less USD appeal globally
→ Macro environment favors continued EUR/USD upside. No current red flags across equities, vol, or commodity safety flows.
⸻
⚠️ Risk Notes
• This is not a high-leverage bet — it’s a structure-following execution
• No guessing reversals, no trying to pick tops/bottoms
• Will scale out partials only on trail trigger, not emotional spikes
⸻
Bias: Bullish continuation through memory zones
Execution: Fully automated ladder — price leads, I follow
Objective: Let strength pay. No chase. No force.

EURUSD Wave Analysis – 6 August 2025
- EURUSD reversed from support area
- Likely to rise to resistance level 1.1755
EURUSD currency pair recently reversed from the support area between the strong support level of 1.1500 (former low of wave iv from June), lower daily Bollinger Band and the 50% Fibonacci correction of the upward impulse 1 from May.
The upward reversal from this support area created the clear daily Japanese candlesticks reversal pattern Morning Star.
Given the clear daily uptrend and bearish us dollar sentiment seen today, EURUSD can be expected to rise to the next resistance level 1.1755.
Range breakoutEUR/USD managed to break out of the range, and did so with relatively strong momentum. It will likely rise up to 1.17500.

EUR/USDgoing to buy,pull back from the trend line . stop loss below the trend line just in case the price reverse.

EURUSD BEARISHTechnically:
Printing LL and LH
Support became resistance
No bullish divergence
Fundamentally:
According to the COT data Big player shorting the EU Which means longing USD

EURUSD TRADING IDEA 08 05 25Here's another one:
Looking for a strong rejection in the discount zone before going long.

EUR/USD ShortEUR/USD short from H4 supply zone.
Price moved away from the zone creating huge bearish engulfing candles also leaving a huge imbalance.
To add to this price broke through a significant upward trend line.

EURUSD: July inflation shapes sentiment Two weeks ago was a quite intensive time when it comes to U.S. macro data, so investors used the previous week to digest the latest available information and adjust their positions accordingly. As for data posted during the previous week for the U.S. economy, the ISM Services PMI in July reached 50,1, which was a bit lower from forecasted 51,5.
Economic data posted for the EuroZone include the HCOB Composite PMI final for July in Germany, which was standing at 50,6 while the same indicator for the Euro Zone was at the level of 50,9. Both indicators were in line with market expectations. The Producers Price Index in the Euro Zone in June was increased by 0,8% for the month, reaching 0,6% on a yearly basis. Factory orders in June in Germany dropped by -1,0% for the month, while the market was expecting to see an increase of 0,8%. Retail Sales in the Euro Zone in June were higher by 0,3%, leading the indicator to 3,1% for the year. The figure was higher from market expectations of 2,6%. The Balance of Trade in Germany in June was standing at euro 14,6B, much lower from expected euro 17,3B. The Industrial Production in Germany in June dropped by -1,9% for the month, again significantly surpassing the expected drop of -0,5%.
In line with the market repositioning based on the latest published data, so the U.S. Dollar headed toward the levels from three weeks ago. The eurusd pair started the previous week by testing the 1,14 support line and swiftly moved to the higher grounds, reaching 1,1691 as the highest weekly level. The currency pair closed the week at 1,1640. The RSI moved from the oversold market side, and reached the level of 50 as of the weekend. It still does not provide a clear suggestion that the market is ready to head toward the overbought market side. The MA50 continued its divergence from MA200, without an indication of a potential slowdown of divergence in the coming period.
Based on current charts, there is some potential for eurusd to move to even higher grounds in the coming period, in order to test the 1,17 resistance level. At the same time, there is also some probability that a modest reversal might continue from Friday's trading session at the start of the week ahead. In this sense, support at 1,16 could be tested for one more time. Still, it should be considered that the US inflation figures for July will be posted during the week, as well as retail sales in July, in which sense, some modestly higher volatility might be implied at the release of these data.
Important news to watch during the week ahead are:
EUR: ZEW Economic Sentiment Index in August in Germany, Industrial Production in the Euro Zone in June, GDP Growth Rate second estimate for Q2 in Euro Zone,
USD: Inflation Rate in July, Producers Price Index in July, Retail Sales in July, Industrial Production in July, University of Michigan Consumer Sentiment Index preliminary for August.

EURUSD We’ve broke a resistance level, so I’m expecting price to make retest then we get to the trendline above before we continue down, until proven otherwise tho

EURUSD has broken Trendline and formed M patternEURUSD has broken Trendline and formed M pattern. Looks like out of steam now


EurusdI posted this signal few days ago if I am not mistaken am expecting price to come down break and retest the zone then I can sell more

EURUSD TODAYEURUSD chart 15m now waiting for a mitigation of POI above to take 15m swing low. but most probably a sideway could happen.

Sell EURUSD after BRD the level of 1.15This market is started the down move by forming a very
strong bearish bars
break down the level 1.15
so I opend short with RR=1:2.6
then after a 100 points in profit I added to
this short position another one with RR=1:2

The 3-Step Rocket Booster Strategy With EUR/USDThis past day has not been rosy.But let me share a story with you.I was about to buy myself some lotion in a store then a man
wearing a government uniform jumped ahead in line of me.
He was with a beautiful woman who was used to shopping in
this small scale merchant store.
When you enter these stores they is a different culture
you have to be calm.
The man was aggressive and by nature
i don't blame him he looked like money
his smart phone was huge!
Even if he jumped ahead of me.I was humbled and
kept my distance.
They needed to make a call to confirm the purchase
they wanted to buy sugar.
The call didn't go well
or the person didn't pic k up the call
at that moment
they left and i was still standing in the store
waiting for my turn to buy.
Trading is something
that you have to learn to adopt they is a culture to
to this stuff
forex trading as well. Learning to hold during the
flat market is the hallmark
of successful trading..
look at this chart
you will see that this chart is following the rocket booster strategy
So what is the rocket booster strategy?
This strategy has 3 steps:
1-The price has to be above the 50 EMA
2-The price has to be above the 200 EMA
3-The price has to gap up in an uptrend
This gap up can be measure using the MACD indicator
once the two line below zero cross that's the confirmation you will need
to buy this forex pair CAPITALCOM:EURUSD .
Rocket boost this content to learn more
Disclaimer:Trading is risky please learn risk management
and profit taking strategies.Also feel free to use a simulation trading account before you
trade with real money.

EU Scalp (wrong bias) - Trump speech Came into the day with a neutral bias looking for some kind of retracement deeper into the hourly leg.
After a bearish London with bearish H1 order flow showing (H1 wicks + rejecting the Order block) we sell our liquidity shakeout right in the middle of New York session.
It's really got me interested was how close we came to the daily DOL (or so I thought) before retracing

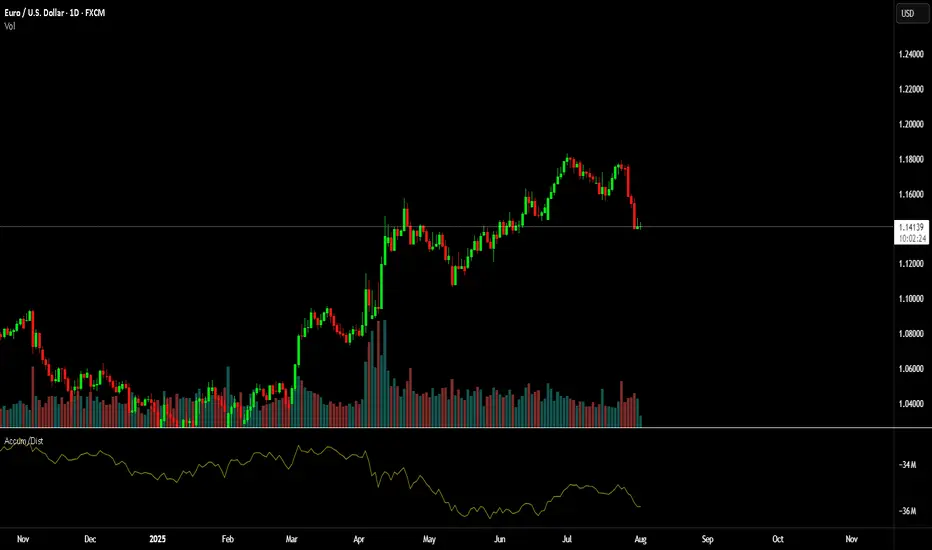
Simple Psychology Tips Using Volume for Better TradingMany newer traders assume that when someone says "psychology" in trading, they are referring to mindset.
It is also widely believed that trading is about the BEST entries.
Now, think of it this way. It is not about winning trades, it is actually about managing losses well to allow you to take the winners over and over again. You might think that a 3 to 1 risk-to-reward strategy is boring, you might have gone all in on your favourite crypto project. But what makes the difference between gambling and trading is actually very, very simple. So simple, in fact, many overlook it or simply ignore it.
Most seek a silver bullet - high win rates and perfectly timed entries, then they overleverage and move stops on the one "good trade" they are seeking to make.
Whilst doing this, they tend to overload the 6 monitors they have purchased to trade with a thousand indicators, which they don't really need.
The candlesticks tell a story, volume supports that story. When you learn any technique from Elliott Waves to Wyckoff, they all have a dependence on volume - even if the correlation is not apparent.
Look at this first image.
Price had moved down since the vertical line, the AD line also moved down - sell-off, in full swing. But then volume starts to shift before the AD line starts to increase.
Now, look at what happens next...
As we move forward and the new vertical line shows where volume spiked, the AD line starts to decrease as the price continues to rise.
This is enough of a story to start your analysis.
We then get a move with a lower high formed.
As this plays out, the sell-side volume rises, creating momentum for the short position.
Look a little closer and you will see, that the volume on the move up just before the drop was also decreasing. Making a divergence to price.
You might feel that the market is against you, or that the big players are single-handedly seeking your stops. But the truth is, the psychology in moves such as this one shown is where most retail traders either have greed that markets will only go up for ever or the fear that they are missing out on a market that only goes up forever.
It is that herd mentality that generates the liquidity for the professionals.
Losing 1% on a trade, is part of the process, risking 80%> on a single move will make you paper rich for about 10 minutes before the real losses set in.
This is where the psychology and the basic techniques such as risk management and understanding what candlesticks and volume bars are telling you, will make a world of difference to your results.
A/D line and volume are free on @TradingView and to be fair you don't need to overcomplicate it more than that!
Stay safe, have a great weekend all!!!
Disclaimer
This idea does not constitute as financial advice. It is for educational purposes only, our principal trader has over 25 years' experience in stocks, ETF's, and Forex. Hence each trade setup might have different hold times, entry or exit conditions, and will vary from the post/idea shared here. You can use the information from this post to make your own trading plan for the instrument discussed. Trading carries a risk; a high percentage of retail traders lose money. Please keep this in mind when entering any trade. Stay safe.
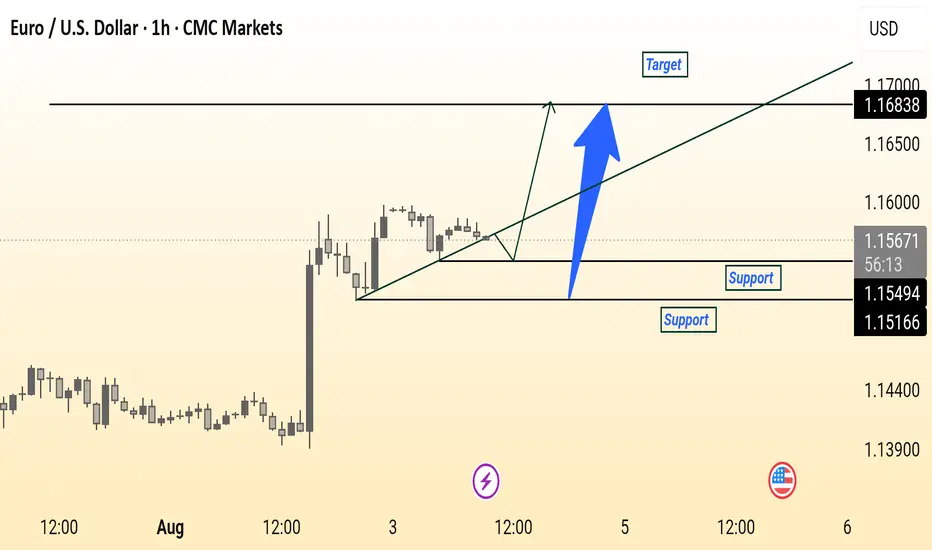
EUR/USD Bullish Setup on 1H ChartEUR/USD is forming a bullish pattern above key support levels at 1.15494 and 1.15166. A breakout above the current consolidation could push price towards the 1.16838 target, aligned with the upward trendline.
EURUSD awaiting its next moveEURUSD is still trading around the same levels as yesterday.
If you're looking for a trade opportunity, watch for a higher low forming above 1,1388.
This could happen after a pullback from the current levels, or from slightly higher if the price continues to push upward.
Use the Fibonacci tool during the correction to help identify potential entry points.
At the moment, the major currency pairs are offering the best trading setups.

#AN024: "Light" August, Heavy FOREX Data
August is unforgiving: thin liquidity, but a heavy macroeconomic environment. This week, the July US CPI (Tuesday, August 12, at 2:30 PM CET) is the event that could reshape mid-month FX flows; it comes after weak payrolls and with the "tariffs → inflation" theme once again front and center. Hello, I'm Andrea Russo, an independent Forex trader and prop trader with $200,000 in capital under management. Thank you in advance for your time.
The BLS confirms the release calendar (July to August 12), while desks and media are warning of tariff-induced inflation risk and a market pricing in Fed cuts in September.
US: CPI, Tariffs, and the Pricing of Cuts
The stock market has rebounded, but the week will hinge on CPI and PPI: if tariffs boost tradables, the "mini-stagflation" scenario (stagnant inflation and slowing growth) becomes credible and supports the USD in risk-off mode; a soft CPI, however, reinforces the Fed's pricing of a cut and could weigh on the greenback. Currently, traders are looking for a low monthly CPI but with the risk of a downturn due to tariffs.
Europe: ECB Steady, EUR "Still Anchored"
The ECB left rates unchanged on July 24, with the message: inflation at target in the medium term, domestic pressures declining, wages slowing. This "anchor" the EUR: less endogenous macro direction, more dependent on Tuesday's US data. Range-trading is likely ahead of the US CPI; a hot surprise pro-USD pushes EURUSD down, while a soft surprise rebounds it.
UK: BoE cuts to 4% — sterling more "data-dependent"
The BoE has cut by 25 bps to 4% (the fifth time this year) and in its Monetary Policy Report, it predicts a transitory inflation peak of 4% in September before returning. FX translation: GBP loses its "carry edge," becoming sensitive to labor/price data; against the USD, it remains hostage to Tuesday's CPI; against the EUR, it tends to smooth out excesses (less interest rate premium). Disciplined sell-the-rally on GBP/USD if US CPI surprises to the upside; conversely, a soft CPI could trigger short-covering on sterling.
Japan: BoJ patient, but the "more is possible" theme
The June minutes show a BoJ willing to reopen the hike discussion once the trade shocks related to US tariffs subside. In the summer, with intermittent risk-off, the JPY remains bid on negative shocks and warm US data (real yields ↑), and weakens if the CPI reinforces the Fed cut scenario (US yields ↓). USD/JPY sensitive to the term premium: it rises with a hot CPI, retreats with a soft CPI and risk-off.
Australia: RBA under dovish pressure
Consensus strengthens for an RBA cut (after the "no cut" in July): core disinflation and cooling jobs provide coverage. AUD feels the combination of Fed pricing + RBA risk: hot US CPI = AUD down twice (strong USD + dovish RBA); soft CPI = technical rebound, but capped if the RBA actually cuts.
China & commodities: PPI in deflation, lighter oil
China remains disinflated: CPI flat y/y and PPI -3.6% y/y in July. This is a cyclical headwind for FX commodities and, by extension, mitigates near-term global inflation risks. Oil is correcting on demand concerns and the OPEC+ headline; lower Brent is supporting the "soft US CPI" scenario on the sidelines.
