EURUSD: Bullish Continuation from Reclaimed Institutional ZoneGreetings Traders,
In today’s analysis of EURUSD, recent price action confirms the presence of bullish institutional order flow. As a result, we aim to align with this narrative by seeking high-probability buying opportunities at key institutional arrays.
Higher Timeframe Context:
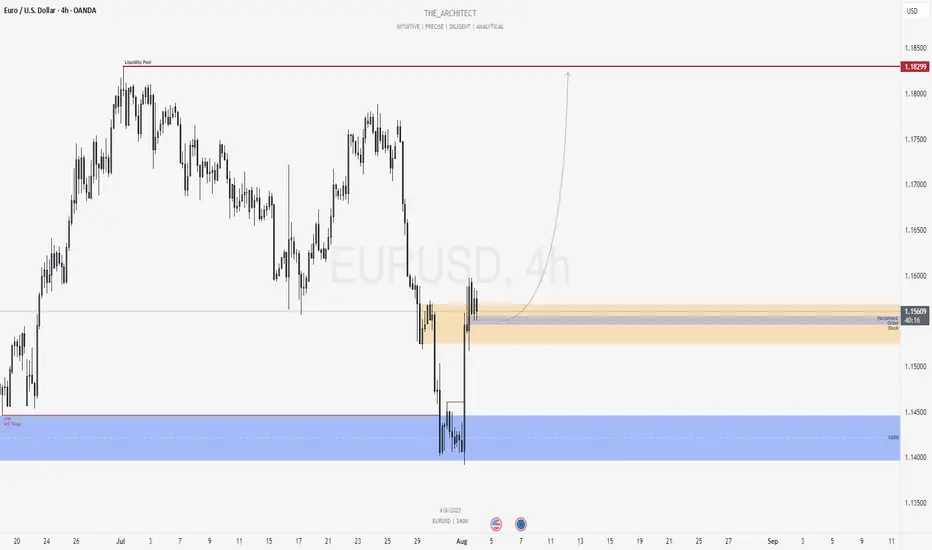
On the weekly timeframe, last week’s candle retraced into a Re-Delivered Re-Balanced (RDRB) Array—a bullish structure often associated with institutional repositioning. From this zone, we anticipate continued bullish delivery towards the weekly liquidity pool, reinforcing a bullish directional bias.
Key Observations on H4:
Bullish Market Structure Shift: Price action on the H4 has decisively shifted bullish, aligning with the higher timeframe’s narrative and confirming our bias.
Reclaimed Order Block Support: Following the bullish shift, price has pulled back into a reclaimed order block—a previously institutional selling zone that, once broken and reclaimed, now acts as a high-probability support area. This becomes a key zone for seeking lower timeframe confirmation entries.
Trading Plan:
Entry Strategy: Look for confirmation entries within the reclaimed order block on lower timeframes (M15–M5).
Target Objective: The draw on liquidity resides at the long-term high, where a cluster of buy-side liquidity is expected to attract price.
For a detailed market walkthrough and in-depth execution zones, be sure to watch this week’s Forex Market Breakdown:
Remain patient and precise in execution. Let the market confirm your bias before entering and manage risk appropriately.
Kind regards,
The Architect 🏛️📈
EURUSD trade ideas
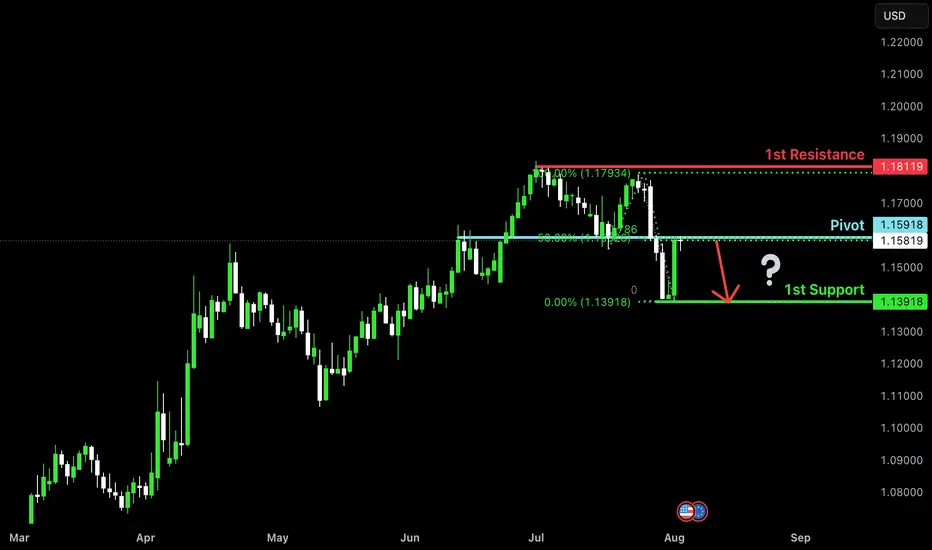
Bearish reversal off 50% Fibonacci resistance?The Fiber is reacting off the pivot, which acts as an overlap resistance that lines up with the 50% Fibonacci retracement and could reverse to the 1st support.
Pivot: 1.1691
1st Support: 1.1391
1st Resistance: 1.1811
Risk Warning:
Trading Forex and CFDs carries a high level of risk to your capital and you should only trade with money you can afford to lose. Trading Forex and CFDs may not be suitable for all investors, so please ensure that you fully understand the risks involved and seek independent advice if necessary.
Disclaimer:
The above opinions given constitute general market commentary, and do not constitute the opinion or advice of IC Markets or any form of personal or investment advice.
Any opinions, news, research, analyses, prices, other information, or links to third-party sites contained on this website are provided on an "as-is" basis, are intended only to be informative, is not an advice nor a recommendation, nor research, or a record of our trading prices, or an offer of, or solicitation for a transaction in any financial instrument and thus should not be treated as such. The information provided does not involve any specific investment objectives, financial situation and needs of any specific person who may receive it. Please be aware, that past performance is not a reliable indicator of future performance and/or results. Past Performance or Forward-looking scenarios based upon the reasonable beliefs of the third-party provider are not a guarantee of future performance. Actual results may differ materially from those anticipated in forward-looking or past performance statements. IC Markets makes no representation or warranty and assumes no liability as to the accuracy or completeness of the information provided, nor any loss arising from any investment based on a recommendation, forecast or any information supplied by any third-party.
The Hidden Cost of ActivityHow Trading Frequency Undermines Retail Investor Profitability
In the age of commission-free trading and social media-driven hype cycles, the line between investment and entertainment has blurred. Retail traders now execute millions of trades a day across global markets, empowered by sleek mobile apps and real-time alerts. Yet beneath this democratization of access lies a sobering truth: higher trading frequency among retail investors is consistently linked with lower profitability.
This article explores the academic research surrounding this paradox. Drawing from large-scale studies in Colombia, the UK, China, and India, it demonstrates that the more frequently retail investors trade, the less likely they are to outperform the market—or even earn positive returns. But this is more than a statistical quirk; it reveals deep behavioral biases, structural disadvantages, and misunderstood costs that plague the average individual investor.
Colombian Evidence: The More You Trade, the Less You Keep
One of the most comprehensive investigations into retail trading behavior comes from Colombia. Over a ten-year period, researchers analyzed more than 5.3 million trades made by over 42,000 individual investors on the Colombian Stock Exchange. The results were stark: retail investors lost between 4.0% and 4.4% annually in gross abnormal returns, depending on the asset pricing model used (CAPM, Fama-French, Carhart) (Villatoro & González, 2021). These losses persisted even before commissions and taxes were deducted.
However, the more striking pattern emerged when the researchers categorized traders by activity level. The most active traders consistently underperformed their less active counterparts. This performance gap remained even after controlling for other variables such as portfolio size, trading experience, and market conditions. In short: trading more often almost guaranteed worse outcomes.
Interestingly, when controlling for how long traders had been active in the market, a new nuance emerged. Those with longer tenure and moderate trading frequencies tended to perform better, suggesting that experience and discipline can partially offset the costs of frequent trading. But for most retail investors, especially newcomers, a high frequency of trades was a losing game.
Behavioral Pitfalls and the Illusion of Control
Why do so many retail traders engage in self-defeating behavior? Behavioral finance offers compelling answers. Overconfidence, a hallmark of retail trading behavior, leads individuals to overestimate their ability to time the market (Barber & Odean, 2001). Many traders fall victim to what’s known as the “illusion of control”—the belief that more activity translates into better outcomes. In reality, each trade introduces friction, often in the form of bid-ask spreads, slippage, and execution delays, not to mention mental fatigue and stress.
A revealing study from the UK examined 7,200 individual trading accounts. It found that the top 10% of traders accounted for over half of all trading activity. These individuals placed an average of 69 trades per year, compared to just six trades annually for the bottom 80% (Feng & Seasholes, 2005). And yet, the frequent traders substantially underperformed. Most of the losses were not due to bad stock picks, but rather to cumulative trading costs and poorly timed entries and exits.
Another study from an experimental setting demonstrated that even in a zero-commission environment with rational expectations, excessive trading reduced final wealth. Participants who traded most actively were consistently those who took the greatest risks and made the least profit (Kirchler et al., 2012). Activity, it seemed, was a poor substitute for strategy.
The Amplifying Effect of Social Trading Platforms
In China, where social trading platforms allow users to follow and copy the trades of so-called investment leaders, the relationship between frequency and performance takes an even more complex turn. A 2022 study found that when traders received more comments or likes on their trades, their trading frequency increased significantly. But rather than improving outcomes, this social reinforcement led to deteriorating performance (Wu et al., 2022).
The mechanism here is subtle but powerful. Social validation creates a feedback loop that encourages more trades, not necessarily better ones. The result is a dangerous mix of herding behavior and overconfidence, both of which are well-documented causes of underperformance in financial markets. And since these platforms often gamify trading with leaderboards and rewards, they unintentionally promote high-frequency trading behaviors that are detrimental to most participants.
India’s Derivatives Market: A Harsh Lesson in Leverage
The consequences of high-frequency trading become especially severe in leveraged markets. India’s derivatives market offers a cautionary tale. Between 2021 and 2024, retail traders lost an estimated ₹1.81 trillion (around USD 21.7 billion) trading futures and options. A staggering 93% of retail traders incurred net losses, and the median loss per participant ranged between ₹100,000 and ₹200,000 (SEBI, 2024).
These losses were not random. Regulatory analysis showed that retail traders often entered and exited positions too quickly, misjudging volatility and price momentum. Many strategies were reactive rather than analytical, driven by short-term news or social media chatter. The vast majority of losses were concentrated among high-frequency traders who overestimated their ability to anticipate market movements.
In contrast, institutional players and algorithmic trading firms profited handsomely during the same period. With better access to information, faster execution systems, and rigorous risk management, they capitalized on the very inefficiencies created by retail traders.
The Free Lunch Illusion: The True Cost of “Zero Commission” Platforms
Much of the rise in trading frequency among retail investors can be traced to platforms like Robinhood, eToro, or Trade Republic, which advertise commission-free trading. While these platforms have lowered the barrier to entry, they often obscure the true costs embedded in trade execution.
Commission-free brokers typically rely on a business model called payment for order flow (PFOF). In this setup, the broker routes retail orders to market makers or high-frequency trading firms, which pay the broker for the opportunity to execute the trade. These market makers profit from the bid-ask spread, often at the expense of retail traders. Although legal in the U.S., PFOF is banned in countries like the UK and Canada due to conflict-of-interest concerns (The Economist, 2021).
Critics argue that PFOF incentivizes brokers to maximize volume rather than execution quality. This can result in poorer price execution for the trader, even if no explicit commission is charged. A 2020 SEC report on the GameStop-Robinhood episode found that retail investors may be disadvantaged by a few cents per share—minor per trade, but substantial over thousands of trades (SEC, 2020).
The ease of access, gamified interfaces, and perceived lack of cost encourage frequent, impulsive trading—especially among young and inexperienced investors. Robinhood users, for example, were found to trade options 88 times more than Charles Schwab users, and equities 40 times more often (Barber et al., 2021). Such behavior has been linked with higher loss probabilities, particularly in volatile markets.
From Reddit to Real Life: A Personal Turnaround
On trading forums such as Reddit, anecdotal stories often mirror these empirical patterns. One day trader shared a telling experience: after months of executing 10 or more trades per day, his results were consistently negative. However, after shifting to a more selective approach—averaging around three trades per day—his performance dramatically improved. He reported a win rate of 48.8%, an average reward-to-risk ratio of 2.17, and a monthly return exceeding 20R (i.e., twenty times the risk unit per trade). While anecdotal, stories like this are common. They suggest that reducing frequency allows for better decision-making, more stringent trade selection, and improved emotional control—all of which contribute to higher profitability.
The Core Problem: Frequency Without Edge
The critical difference between successful high-frequency strategies (like those used by hedge funds) and retail trading lies in the presence of a quantifiable edge. Professional firms use complex models, co-location servers, and massive datasets to gain millisecond advantages. Retail traders, by contrast, often increase frequency without any corresponding informational edge. The result is a compounding of noise, cost, and error.
Academic consensus is clear: unless trading frequency is backed by superior information, strategy, and execution, it is more likely to erode returns than enhance them. The average retail trader is better served by thoughtful, low-frequency strategies that minimize costs, reduce emotional friction, and allow performance to compound over time (Lo et al., 2004).
Less Is More
The allure of high-frequency trading for retail investors is understandable. It promises engagement, excitement, and the illusion of control. But the data tells a more sobering story: more trades almost invariably lead to worse outcomes. From Colombia to India, from Reddit anecdotes to formal econometric studies, the verdict is consistent. The path to profitability is paved not with activity, but with restraint.
For retail traders seeking long-term success, the prescription is clear: trade less, think more, and remember that in markets, patience is often more profitable than precision timing.
References
Barber, B.M. and Odean, T., 2001. Trading is hazardous to your wealth: The common stock investment performance of individual investors. Journal of Finance, 55(2), pp.773–806. Available at: faculty.haas.berkeley.edu
Barber, B.M., Huang, X., Odean, T. and Schwarz, C., 2021. Attention induced trading and returns: Evidence from Robinhood users. NBER Working Paper No. 28906. National Bureau of Economic Research. Available at: www.nber.org
Feng, L. and Seasholes, M.S., 2005. Do investor sophistication and trading experience reduce behavioral biases?. Review of Finance, 9(3), pp.305–351. Available at: faculty.haas.berkeley.edu
Kirchler, M., Lindner, F. and Weitzel, U., 2012. Markets, bubbles, and crashes: Laboratory results on the effectiveness of circuit breakers. Journal of Economic Behavior & Organization, 83(1), pp.179–189. Available at: pubmed.ncbi.nlm.nih.gov
Lo, A.W., Repin, D.V. and Steenbarger, B.N., 2004. Fear and greed in financial markets: A clinical study of day-traders. American Economic Review, 94(2), pp.352–356. Available at: web.mit.edu
Securities and Exchange Commission (SEC), 2020. Staff Report on Equity and Options Market Structure Conditions in Early 2021. U.S. Securities and Exchange Commission. Available at: www.sec.gov
SEBI (Securities and Exchange Board of India), 2024. Retail derivatives trading losses total ₹1.81 trillion over three years. Reuters, 23 Sep. Available at: www.reuters.com
The Economist, 2021. The future of retail broking: Zero-commission trading has a hidden cost. The Economist, 4 Feb. Available at: www.economist.com
Villatoro, D.I. and González, M.A., 2021. Retail investors’ behavior and performance: Evidence from the Colombian stock market. Heliyon, 7(12), p.e08535. Available at: www.sciencedirect.com
Wu, Y., Duan, Y., Xu, G. and Shen, H., 2022. The impact of social interaction on retail investors’ trading behavior in social trading platforms. Financial Innovation, 8(1), Article 39. Available at: link.springer.com

EURUSD: The Euro's Rally Stalls at a Critical Inflection PointEURUSD: The Euro's Rally Stalls at a Critical Inflection Point
The EURUSD market has undergone a significant shift in momentum, transitioning from a clear uptrend to a more bearish structure. The market has recently broken below a long-term trendline and is now in a pivotal phase, re-testing a crucial former support level. The outcome of this re-test will likely determine the asset's trajectory for the coming weeks.
The Major Breakdown 💔📉
The most significant event was the recent decisive break below the multi-month rising trendline that had been guiding the price since late March. The market's inability to maintain support on this trendline is a strong signal of a shift in market sentiment from bullish to bearish.
The Deciding Area: A Critical Retest 🚦
Following the breakdown, price found temporary support before making a move higher. The current price is now engaging with a Deciding Area—a key zone that previously acted as support but is now being tested as resistance from below. This is a classic "support-turned-resistance" scenario. A firm rejection from this gray box would serve as confirmation of the bearish breakdown.
The Resistance & Support Levels
Above the current price, a potential 1st Resistance zone (red box) looms as the area that initiated the initial breakdown from the previous high. Below the current price, the Key Support (green box) represents the last attempt by the bulls to hold the line before the final breakdown.
The Ultimate Target: Long-term Support 🌊
If the market is indeed rejected from the "Deciding Area," the most likely target for bears would be the Long-term Support zone (blue box). This wide area has proven to be a major demand zone in the past and would be the next major battleground for a potential rebound.
Potential Scenarios for EURUSD ⚖️
• Bearish Continuation ⬇️: The most probable scenario involves a clear rejection from the Deciding Area. A move back down from this level would confirm the new bearish structure and likely lead to a move towards the Long-term Support zone.
• Bullish Reversal 🐂: A less likely scenario would be a sustained break and close above the Deciding Area. This would suggest that the recent breakdown was a "fakeout" or a false move, and could lead to a re-test of the 1st Resistance zone.
Conclusion:
EURUSD is at a critical juncture. The price action at the current Deciding Area is of utmost importance and will provide the confirmation needed to project the next major move. The path of least resistance appears to be to the downside, but traders should watch for a clear rejection before committing to a bearish bias.
Disclaimer:
The information provided in this chart is for educational and informational purposes only and should not be considered as investment advice. Trading and investing involve substantial risk and are not suitable for every investor. You should carefully consider your financial situation and consult with a financial advisor before making any investment decisions. The creator of this chart does not guarantee any specific outcome or profit and is not responsible for any losses incurred as a result of using this information. Past performance is not indicative of future results. Use this information at your own risk. This chart has been created for my own improvement in Trading and Investment Analysis. Please do your own analysis before any investments.

Bullish rise?EUR/USD has reacted off the support level and could potentially rise from this level to our takeprofit.
Entry: 1.1535
Why we like it:
There is a pullback support.
Stop loss: 1.1405
Why we like it:
There is a swing low support.
Take profit: 1.1684
Why we like it:
There is a pullback resistance that is slightly below the 78.6% Fibonacci retracement.
Enjoying your TradingView experience? Review us!
Please be advised that the information presented on TradingView is provided to Vantage (‘Vantage Global Limited’, ‘we’) by a third-party provider (‘Everest Fortune Group’). Please be reminded that you are solely responsible for the trading decisions on your account. There is a very high degree of risk involved in trading. Any information and/or content is intended entirely for research, educational and informational purposes only and does not constitute investment or consultation advice or investment strategy. The information is not tailored to the investment needs of any specific person and therefore does not involve a consideration of any of the investment objectives, financial situation or needs of any viewer that may receive it. Kindly also note that past performance is not a reliable indicator of future results. Actual results may differ materially from those anticipated in forward-looking or past performance statements. We assume no liability as to the accuracy or completeness of any of the information and/or content provided herein and the Company cannot be held responsible for any omission, mistake nor for any loss or damage including without limitation to any loss of profit which may arise from reliance on any information supplied by Everest Fortune Group.

EURUSD - Counter trend idea.-In the monthly (higher timeframes), EURUSD is bullish.
-In the weekly timeframe, the was a momentous price reaction at the 1w BoS, making it a very strong area of liquidity and unlikely to be broken further in the short term period but maybe tested.
In the the daily and timeframe EU is bearish, but it is just a possible higher timeframe retracement, but still we are looking for opportunities in that retracement too.
-Above is our low probability low risk idea. We are only risking 10 Pips.

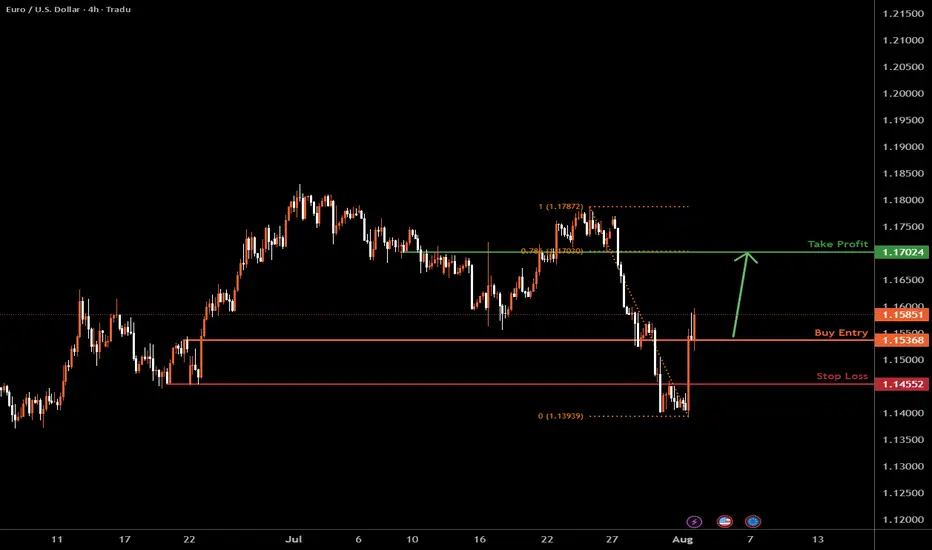
The Fiber H4 | Bullish riseEUR/USD has bounced off the support level, which serves as a pullback support and could potentially rise from this level to our take-profit target.
Buy entry is at 1.1585, which is a pullback support.
Stop loss is at 1.1455, which is a pullback support.
Take profit is at 1.1702, which is a pullback resistance that aligns with the 78.6% Fibonacci retracement.
High Risk Investment Warning
Trading Forex/CFDs on margin carries a high level of risk and may not be suitable for all investors. Leverage can work against you.
Stratos Markets Limited (tradu.com ):
CFDs are complex instruments and come with a high risk of losing money rapidly due to leverage. 65% of retail investor accounts lose money when trading CFDs with this provider. You should consider whether you understand how CFDs work and whether you can afford to take the high risk of losing your money.
Stratos Europe Ltd (tradu.com ):
CFDs are complex instruments and come with a high risk of losing money rapidly due to leverage. 66% of retail investor accounts lose money when trading CFDs with this provider. You should consider whether you understand how CFDs work and whether you can afford to take the high risk of losing your money.
Stratos Global LLC (tradu.com):
Losses can exceed deposits.
Please be advised that the information presented on TradingView is provided to Tradu (‘Company’, ‘we’) by a third-party provider (‘TFA Global Pte Ltd’). Please be reminded that you are solely responsible for the trading decisions on your account. There is a very high degree of risk involved in trading. Any information and/or content is intended entirely for research, educational and informational purposes only and does not constitute investment or consultation advice or investment strategy. The information is not tailored to the investment needs of any specific person and therefore does not involve a consideration of any of the investment objectives, financial situation or needs of any viewer that may receive it. Kindly also note that past performance is not a reliable indicator of future results. Actual results may differ materially from those anticipated in forward-looking or past performance statements. We assume no liability as to the accuracy or completeness of any of the information and/or content provided herein and the Company cannot be held responsible for any omission, mistake nor for any loss or damage including without limitation to any loss of profit which may arise from reliance on any information supplied by TFA Global Pte Ltd.
The speaker(s) is neither an employee, agent nor representative of Tradu and is therefore acting independently. The opinions given are their own, constitute general market commentary, and do not constitute the opinion or advice of Tradu or any form of personal or investment advice. Tradu neither endorses nor guarantees offerings of third-party speakers, nor is Tradu responsible for the content, veracity or opinions of third-party speakers, presenters or participants.
EURUSD Trading Opportunity! SELL!
My dear followers,
This is my opinion on the EURUSD next move:
The asset is approaching an important pivot point 1.1585
Bias - Bearish
Technical Indicators: Supper Trend generates a clear short signal while Pivot Point HL is currently determining the overall Bearish trend of the market.
Goal - 1.1497
About Used Indicators:
For more efficient signals, super-trend is used in combination with other indicators like Pivot Points.
Disclosure: I am part of Trade Nation's Influencer program and receive a monthly fee for using their TradingView charts in my analysis.
———————————
WISH YOU ALL LUCK

EURUSD targeting 1.10 after breaking key supportEURUSD has finally broken below the key 1.15 level, triggering a move lower in line with earlier expectations. The drop follows the US imposing fresh tariffs on European goods, a move that traditionally strengthens the currency of the tariff-imposing nation.
Supporting the dollar further, the latest ADP and GDP reports came in stronger than forecast, while the Fed remains hawkish despite pressure from President Trump to cut rates. Inflation is expected to rise as tariffs take effect, giving the Fed reason to stay firm.
Technically, EURUSD may still bounce short term but the overall bias is lower. As long as it stays below 1.1653, the bearish case holds. Target zones include 1.10 or even 1.0950, offering a risk-reward ratio close to 3 to 1.
This content is not directed to residents of the EU or UK. Any opinions, news, research, analyses, prices or other information contained on this website is provided as general market commentary and does not constitute investment advice. ThinkMarkets will not accept liability for any loss or damage including, without limitation, to any loss of profit which may arise directly or indirectly from use of or reliance on such information

Sell eurusdOur last selling idea already running 300+ pips
Now we looks more selling, more bearish correction expected
Daily support trend broken
Previous support level now becomes the resistance level and almost ready to respect it
Minimum 509+ selling pips expected

Week of 8/3/25: EURUSD AnalysisPrice was bearish all of last week until NFP, resulting in a shift in 4h and 1h market structure to be bullish.
Focus this week is being bullish and following 1h order flow until it reaches the extreme of the daily bearish structure to then be cautious and seeing where price wants to go from there.
Major News:
Tuesday: PMI
Thursday: Unemployment Claims

EURUSD Trade Plan 03/08/2025Dear Trader,
The price was propelled upwards from the 1.14 range on Friday. I expect the price to rise in a corrective wave towards the 1.16500-1.17000 area. From there, after confirming a rejection, I will enter a sell position with a target at 1.14 and then 1.11
Regards,
Alireza!

EURUSD: Support & Resistance Analysis For Next Week 🇪🇺🇺🇸
Here is my latest structure analysis and important
supports & resistances for EURUSD for next week.
Consider these structures for pullback/breakout trading.
❤️Please, support my work with like, thank you!❤️
I am part of Trade Nation's Influencer program and receive a monthly fee for using their TradingView charts in my analysis.

EURUSD Down Trend As dxy is bullish Eurusd will be bearish. I need price to go to my eyeing level in the next couple weeks. we wait and see what price we want to do next week, Wednesday.

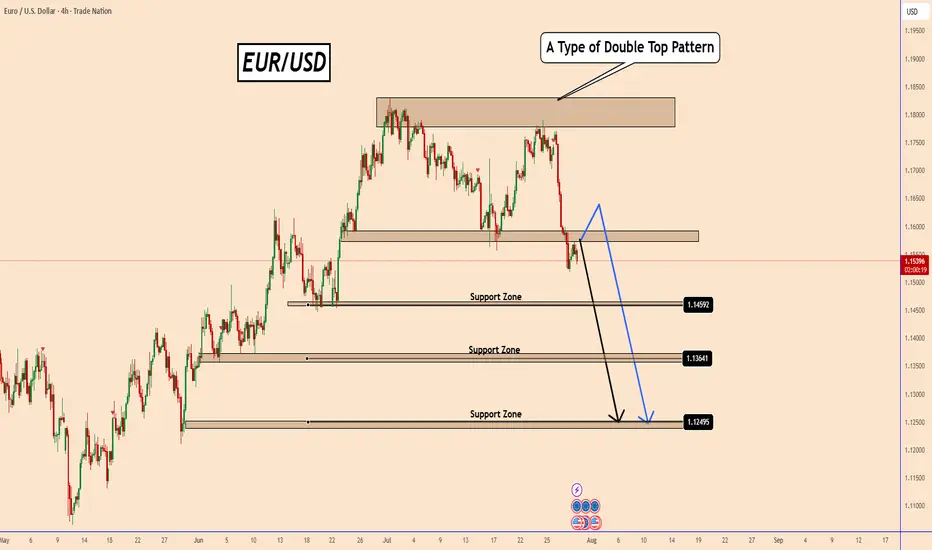
EURUSD: Double Top Pattern Ahead of FOMC MeetingEURUSD: Double Top Pattern Ahead of FOMC Meeting
EURUSD has formed a possible double top, and price action is now trading below the neckline - an indication of increasing bearish probability.
All eyes are on today's FOMC and the interest rate decision. If the Fed signals a rate cut or hints at future easing, this could trigger a sell-off, further validating the bearish scenario.
Although the USD has been weak for an extended period, the market may be changing its positioning this time. Even if EURUSD moves higher during the event, the broader setup favors a decline.
⚠️ Trading around major news events is very risky. It's better to wait for clarity after the FOMC before taking any action.
You may find more details in the chart!
Thank you and Good Luck!
PS: Please support with a like or comment if you find this analysis useful for your trading day
Disclosure: I am part of Trade Nation's Influencer program and receive a monthly fee for using their TradingView charts in my analysis.
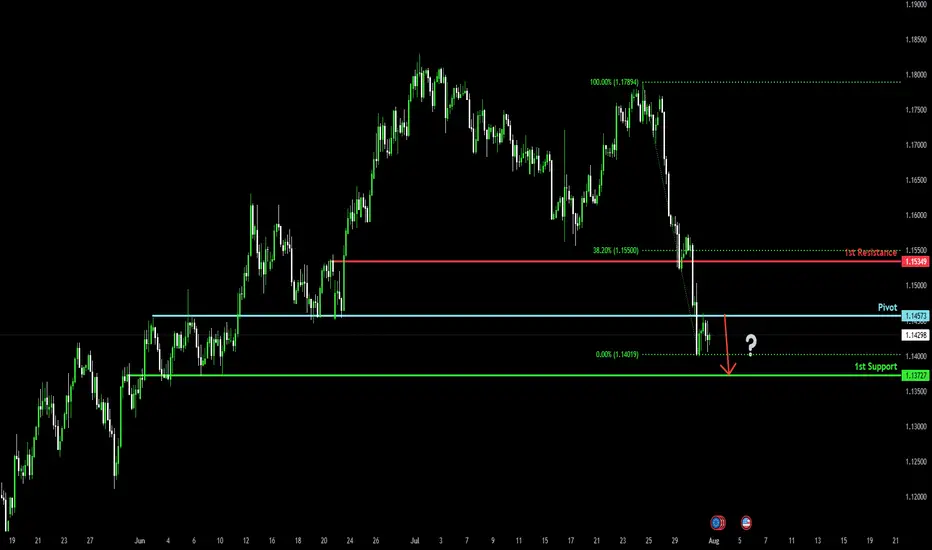
DeGRAM | EURUSD dropped below the support level📊 Technical Analysis
● EURUSD confirmed a double rejection below long-term resistance with two lower highs and broke channel support at 1.1567.
● Price is now trending within a descending channel toward 1.1363, with lower targets pointing into the 1.12–1.11 demand zone.
💡 Fundamental Analysis
● US Q2 GDP surprised to the upside, reinforcing the Fed’s hawkish tone, while Eurozone CPI inflation cooled below forecast.
● Diverging central bank trajectories continue to widen yield differentials in favor of the dollar, sustaining bearish euro flows.
✨ Summary
Short bias confirmed below 1.1567. Break of 1.1450 opens path to 1.1363 ➜ 1.1200 zone. Watch for rallies to fade below trendline.
-------------------
Share your opinion in the comments and support the idea with a like. Thanks for your support!

Bearish drop?The Fiber (EUR/USD) has rejected off the pivot and could potentially drop to the 1st support, which acts as an overlap support.
Pivot: 1.1457
1st Support: 1.1372
1st Resistance: 1.1534
Risk Warning:
Trading Forex and CFDs carries a high level of risk to your capital and you should only trade with money you can afford to lose. Trading Forex and CFDs may not be suitable for all investors, so please ensure that you fully understand the risks involved and seek independent advice if necessary.
Disclaimer:
The above opinions given constitute general market commentary, and do not constitute the opinion or advice of IC Markets or any form of personal or investment advice.
Any opinions, news, research, analyses, prices, other information, or links to third-party sites contained on this website are provided on an "as-is" basis, are intended only to be informative, is not an advice nor a recommendation, nor research, or a record of our trading prices, or an offer of, or solicitation for a transaction in any financial instrument and thus should not be treated as such. The information provided does not involve any specific investment objectives, financial situation and needs of any specific person who may receive it. Please be aware, that past performance is not a reliable indicator of future performance and/or results. Past Performance or Forward-looking scenarios based upon the reasonable beliefs of the third-party provider are not a guarantee of future performance. Actual results may differ materially from those anticipated in forward-looking or past performance statements. IC Markets makes no representation or warranty and assumes no liability as to the accuracy or completeness of the information provided, nor any loss arising from any investment based on a recommendation, forecast or any information supplied by any third-party.
EURUSD - New Bearish Move!Hello Traders !
The EURUSD broke the support level (1.14810 - 1.14463).
This key level becomes new resistance!
So, I expect a bearish move📉
_______________
TARGET: 1.12955🎯

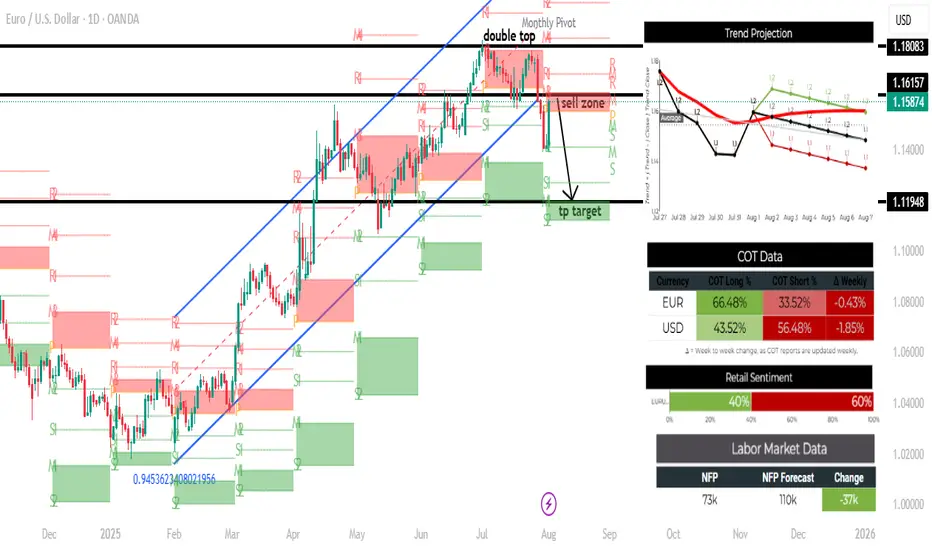
EURUSD SWING SHORT DAILY CHART SETUP - 4 AUGUST 2025📊 Trade Plan: EUR/USD – August 2025
🧠 Summary:
EUR/USD has recently broken a strong ascending channel, confirmed a double top, and dropped into a sell zone. Fundamentals, sentiment, and projection data align for further downside potential targeting the 1.11948 area.
1. Technical Analysis
Pattern: Double Top at ~1.18 with a confirmed neckline break.
Channel: Uptrend channel broken to the downside.
Sell Zone: Between 1.1587–1.1615 (marked on chart).
TP Target: 1.11948 support (next major demand zone).
Indicators:
Price is below pivot level and in bearish structure.
Strong rejection from R1 and monthly pivot.
🔔 Technical Bias: Bearish
2. COT (Commitment of Traders) Sentiment
EUR:
66.48% long, but slightly declined (-0.43%).
USD:
56.48% short, which increased (bullish for USD).
This shows institutions are still net long EUR, but that conviction is weakening. Meanwhile, bearish positions on USD are reducing, signaling a shift in favor of USD strength.
🔔 COT Bias: Shifting in favor of USD (bearish for EUR/USD)
3. Retail Sentiment
Retail:
60% are long EUR/USD, 40% short.
Retail traders are often on the wrong side of the market, so this contrarian signal supports a short bias.
🔔 Retail Bias: Bearish
4. Labor Market Data (NFP)
Actual: 73k vs Forecast: 110k → -37k miss
This is bad for the USD, but the market has already priced in weakness (seen in past days’ movement).
Short-term reaction could be bullish EUR, but broader trend still supports downside.
🔔 NFP Bias: Mixed (short-term bounce possible, but not trend-changing)
5. Trend Projection
All trend projections suggest:
August 3–7: EUR/USD heads lower towards 1.1–1.12, with strongest bearish scenarios reaching 1.1 by Aug 7.
Only the most optimistic scenario keeps it around 1.2, which is now technically invalidated after the neckline break.
🔔 Projection Bias: Bearish
✅ Trade Setup
Primary Trade (Swing Short)
Entry: 1.1587–1.1615 (sell zone)
Stop Loss: 1.1808 (above double top)
Take Profit: 1.1195
Risk:Reward Ratio: ~1:2
Alternative Setup (if missed entry):
Re-entry on pullback: Look for bearish rejection on retest of 1.1580–1.1600 zone.
Confirmation: Bearish engulfing candle or pivot level rejection.
⚠️ Risk Factors:
Unexpected USD weakness due to further poor economic data.
Possible short-term retracement due to oversold conditions post-NFP.
Intervention from ECB or Fed comments.
📌 Final Bias:
Short EUR/USD from resistance zones targeting 1.1195, based on a confluence of bearish technicals, sentiment, and projections.
14-Day Mindset Challenge: Become a Top Trader — Day 114 Days. Challenge: How to Become a Mindset-Strong Trader
Day 1: The Power of Physical Exercise in Enhancing Trading Performance
Embarking on a trading journey demands more than just technical knowledge and market analysis; it requires a resilient and focused mindset. One often overlooked but incredibly powerful tool to develop this mental strength is physical exercise. Regular movement not only benefits your body but also profoundly influences your mental clarity, emotional stability, and overall performance as a trader.
When you engage in physical activity, your brain releases a cascade of chemicals that improve mood, focus, and resilience—crucial qualities for navigating the volatile world of trading. Think of your body and mind as interconnected systems: by strengthening your physical health, you lay a solid foundation for a sharper, more disciplined trading mindset. Over the next 14 days, committing to a simple, consistent exercise routine can transform how you approach your trading sessions, helping you stay calm under pressure, make better decisions, and recover quickly from setbacks.
Let's start!
How Physical Exercise Improves Your Trading Results
1. Boosts Endorphin Production for Positive Feelings
One of the most immediate benefits of exercise is the release of endorphins—natural chemicals that promote feelings of happiness and reduce stress and pain. This positive mood boost helps traders maintain a calm and focused mindset, even amidst market volatility. Scientific studies have shown that regular physical activity increases endorphin levels, which can combat anxiety and improve overall emotional resilience.
2. Enhances Insulin Activity and Energy Levels
Exercise improves insulin sensitivity, enabling your body to more efficiently process glucose for energy. This increased metabolic efficiency helps combat fatigue and sustains mental alertness during prolonged trading sessions. Research indicates that physically active individuals experience higher energy levels and better stamina, which are vital for maintaining attention and decision-making capacity.
3. Reduces Disease Risk and Promotes Long-Term Health
Regular physical activity reduces the risk of cardiovascular disease, diabetes, and other chronic health issues. By maintaining good health, traders are less likely to experience unexpected absences due to illness and can trade consistently over time. Scientific evidence supports that healthier individuals have better cognitive function and emotional stability, both crucial for trading success.
4. Boosts Brain Health and Cognitive Function
Exercise increases heart rate and blood flow, delivering more oxygen and nutrients to the brain. Numerous studies have demonstrated that physical activity stimulates the growth of new neural connections and enhances neuroplasticity—the brain’s ability to adapt and learn. This leads to improved memory, concentration, and problem-solving skills, all essential for analyzing markets and executing trades efficiently.
5. Enhances Stress Regulation and Emotional Control
Research shows that regular exercise helps regulate the hypothalamic-pituitary-adrenal (HPA) axis, which controls stress responses. By improving your body’s ability to handle stress, exercise reduces the likelihood of emotional reactions such as impulsivity or panic during trading. This emotional regulation is key to maintaining discipline and sticking to your trading plan under pressure.
6. Improves Sleep Quality
Quality sleep is fundamental for cognitive performance and emotional regulation. Scientific studies have consistently shown that physical activity, especially aerobic exercise, improves sleep quality and duration. Better sleep enhances focus, decision-making, and emotional resilience—traits that directly impact trading performance.
7. Promotes Neurotransmitter Balance
Exercise influences the production and regulation of neurotransmitters such as dopamine, serotonin, and norepinephrine. These chemicals play a vital role in mood, motivation, and alertness. Balanced neurotransmitter levels support a positive mindset, resilience to setbacks, and sustained motivation—key ingredients for consistent trading.
8. Increases Resilience to Market Stressors
Finally, regular physical activity builds overall resilience—both physically and mentally. This resilience helps traders recover quickly from losses, handle unexpected market shocks, and stay committed to their strategies without succumbing to frustration or panic.
Incorporating these scientifically-backed points emphasizes how exercise not only benefits physical health but also fundamentally enhances the mental and emotional capacities critical for successful trading.
Taking Action: Your 14-Day Exercise Implementation Plan
1. Decide Your Exercise Routine
Choose activities that you enjoy and can commit to every day for the next two weeks. Whether it’s walking, jogging, weightlifting, yoga, Pilates, push-ups, mountain climbers, or any other physical activity—what matters is consistency. Pick something that makes you feel energized and motivated.
2. Set a Daily Time Commitment
Determine how much time you can dedicate each day—start with 30 minutes to 1 hour. Make it a non-negotiable part of your daily schedule. For example, you might decide to go for a brisk walk in the morning, do bodyweight exercises at home, or hit the gym. The goal is to establish a routine that becomes a natural part of your day.
3. Use Reminders and Push Through Initial Discomfort
Especially during the first two weeks, it’s normal to feel some resistance or emotional stress about starting new habits. Set reminders on your phone or calendar to prompt you. Be patient and persistent—initial discomfort will fade as your body adapts. Once exercise becomes a habit, it will feel less like a chore and more like a source of strength.
Final Tips for Success
Start Small, Progress Gradually: Don’t overcommit at the beginning; build gradually to avoid burnout.
Stay Consistent: Consistency beats intensity—daily effort compounds over time.
Track Your Progress: Keep a journal or use an app to monitor your activity and observe how you feel over the days.
Enjoy the Process: Find joy in the movement itself. As it becomes part of your routine, you'll notice improvements not only physically but also in your trading mindset.
Conclusion
A 14-day commitment to physical exercise can be a game-changer for your trading mindset. By boosting endorphins, increasing energy, enhancing brain function, and reducing health risks, you set the stage for more disciplined, confident, and resilient trading. Embrace this challenge—your mind and your portfolio will thank you.
✅ Follow me and save this educational post: "14-Day Mindset Challenge: Become a Top Trader — Day 1". Tomorrow, I'll be releasing Day 2 of the transformation... Stay tuned!
✅ Please share your thoughts about this article in the comments section below and HIT LIKE if you appreciate my post. Don't forget to FOLLOW ME; you will help us a lot with this small contribution.

EURUSD – Retest Failed, Bearish Pressure RemainsHello, what’s your take on FX:EURUSD ?
After breaking the trendline, EURUSD attempted a retest but failed. The price is now hovering around 1.142, with selling pressure still evident.
This setup targets the 1.618 Fibonacci extension zone around 1.114. In the short term, a correction based on Dow Theory may unfold — the marked area could offer a perfect selling opportunity.
💡 Priority: SELL on RETEST – strict risk management with clear TP and SL.
Now it’s your turn — what’s your view? Share it in the comments below.
Good luck!

Buy EUR/USD ( correction or continuation of the trend. )After last weeks EUR/USD massive drop into Daily strong support area around 1.1450 I believe this week will start a correction or continuation of the trend.
Buy : 1.1490
Stop : 1.1406
Profit : 1.1700
Risk : 1/2.5

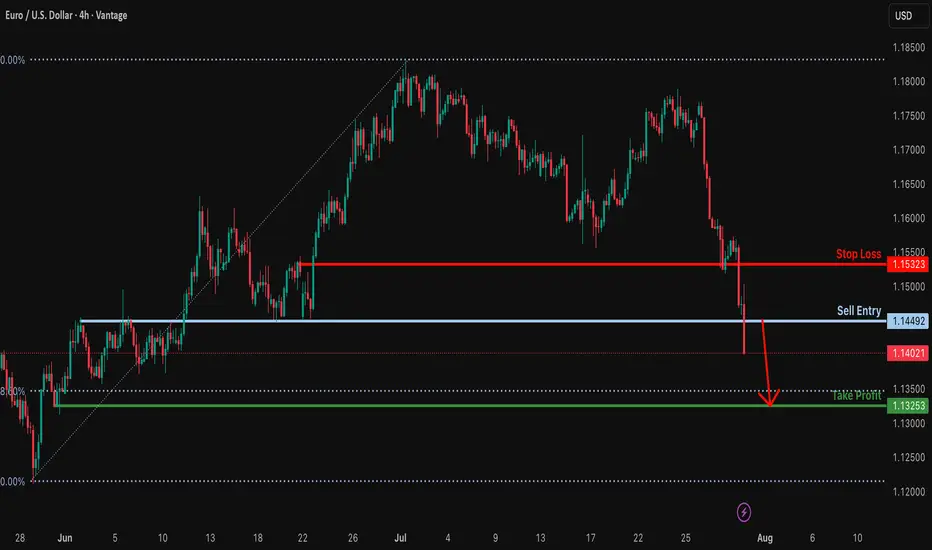
Bearish drop?EUR/USD has broken out of the support level, which is an overlap support. A potential pullback to the sell entry followed by a reversal could lead the price to drop from this level to our take-profit.
Entry: 1.1449
Why we like it:
There is an overlap resitance level.
Stop loss: 1.1532
Why we like it:
There is a pullback resitance level.
Take profit: 1.1325
Why we like it:
There is a swing low support that is slghtly below the 78.6% Fibonacci retracement.
Enjoying your TradingView experience? Review us!
Please be advised that the information presented on TradingView is provided to Vantage (‘Vantage Global Limited’, ‘we’) by a third-party provider (‘Everest Fortune Group’). Please be reminded that you are solely responsible for the trading decisions on your account. There is a very high degree of risk involved in trading. Any information and/or content is intended entirely for research, educational and informational purposes only and does not constitute investment or consultation advice or investment strategy. The information is not tailored to the investment needs of any specific person and therefore does not involve a consideration of any of the investment objectives, financial situation or needs of any viewer that may receive it. Kindly also note that past performance is not a reliable indicator of future results. Actual results may differ materially from those anticipated in forward-looking or past performance statements. We assume no liability as to the accuracy or completeness of any of the information and/or content provided herein and the Company cannot be held responsible for any omission, mistake nor for any loss or damage including without limitation to any loss of profit which may arise from reliance on any information supplied by Everest Fortune Group.