EURUSD long position 04/08/2025English : According to our analysis, we anticipate a bullish scenario.
Morocan Darija : kanchofo d'apres l'analyse dyalna antsanaw tloo3
ATENTION : I only share my ideas, not signals
EURUSD trade ideas

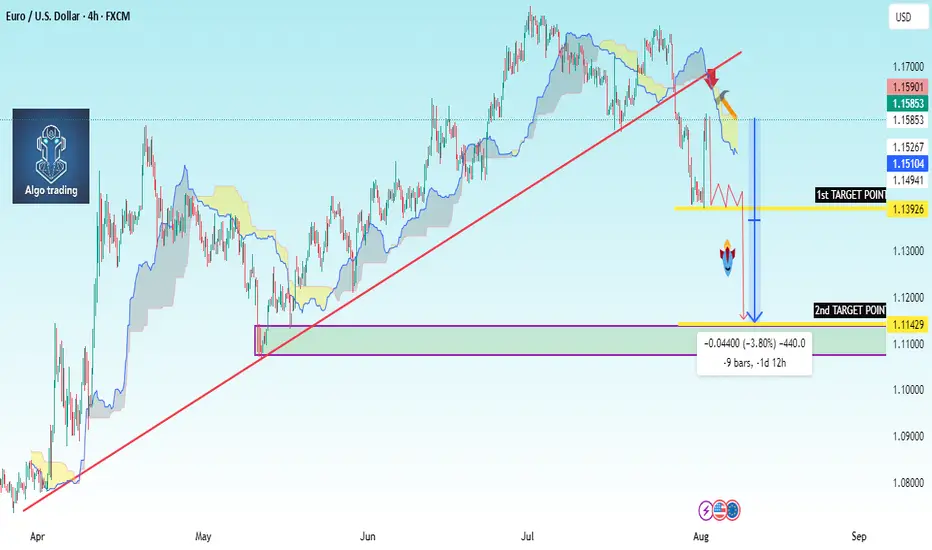
EUR/USD Chart Summary (Bearish Setup):Trendline Break: A long-term bullish trendline has been broken.
Price below Ichimoku Cloud: Indicates bearish momentum.
Bearish Retest: Price pulled back to retest the broken trendline and is now forming a bearish continuation pattern.
Double Target Zones Identified:
1st Target Point: ~1.1329
2nd Target Point: ~1.1144
---
🟠 Suggested Trade Setup:
🔹 Entry (Sell):
Around 1.1585 (where price is hovering now; or on a small pullback).
🔻 Take Profit (TP):
🎯 TP1: 1.1329 (short-term target)
🎯 TP2: 1.1144 (main target if bearish momentum continues)
🛑 Stop Loss (SL):
Place above the recent swing high or cloud resistance — around 1.1670
---
📊 Risk-Reward:
TP1 = ~250 pips
TP2 = ~440 pips
SL = ~85 pips
This gives you a favorable risk-reward (1:3+ to TP
100% Guaranteed EURUSD Long time buy Position .Eur Usd long time buy position . Next profit will be 50 to 100 pips .
Take 1st tp 50 pips and wait for next 100 pips
If you have any question fell free ask my any question

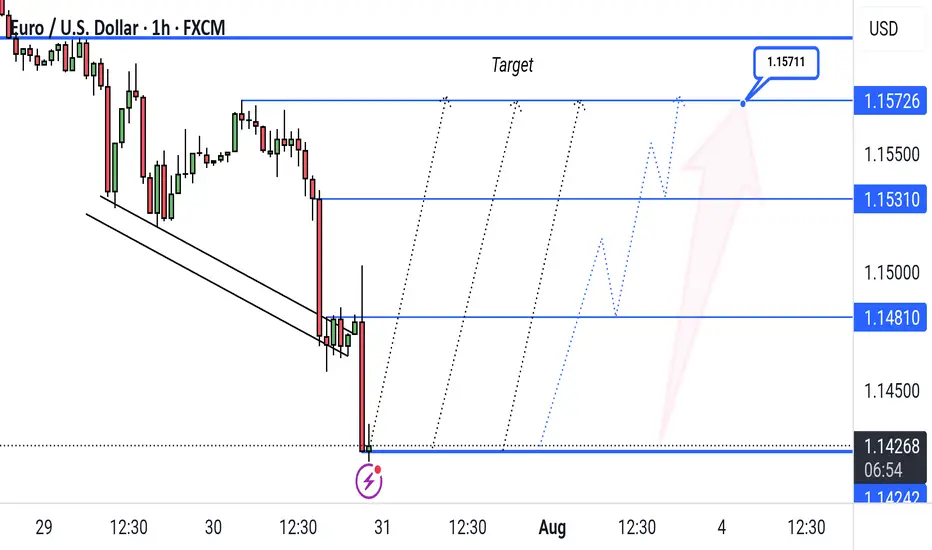
"EUR/USD Bullish Reversal Setup with Key Resistance Targets"This EUR/USD 1-hour chart shows a potential bullish reversal setup. Price recently bounced from the 1.14257 support level, and the chart outlines a projected upward move with key resistance targets at 1.14810, 1.15310, and 1.15726. The final target is marked at 1.15711.
EURUSD Sell Explained...+100 pips, 3 TPS, 1 StrategyHey Rich Friends,
Happy Wednesday. I wanted to updated you on the EURUSD sell idea I posted a few days ago:
All of my TPs were hit and I was able to secure more than 100 pips in this trade.
Here is a synopsis of my strategy:
- Draw support and resistance lines on 2-3 time frames
- Wait for a break of structure above or below previous support or resistance to enter
- Check confirmations on the stochastic (buy = if stoch is facing up and the blue line is on top. sell = if stoch is facing down and the orange line is on top)
I will make a full strategy video soon, but that is basically it. I follow the same process over and over again because it works.
If this video was helpful or you have any questions, let me know below in the comments.
Peace and Profits,
Cha

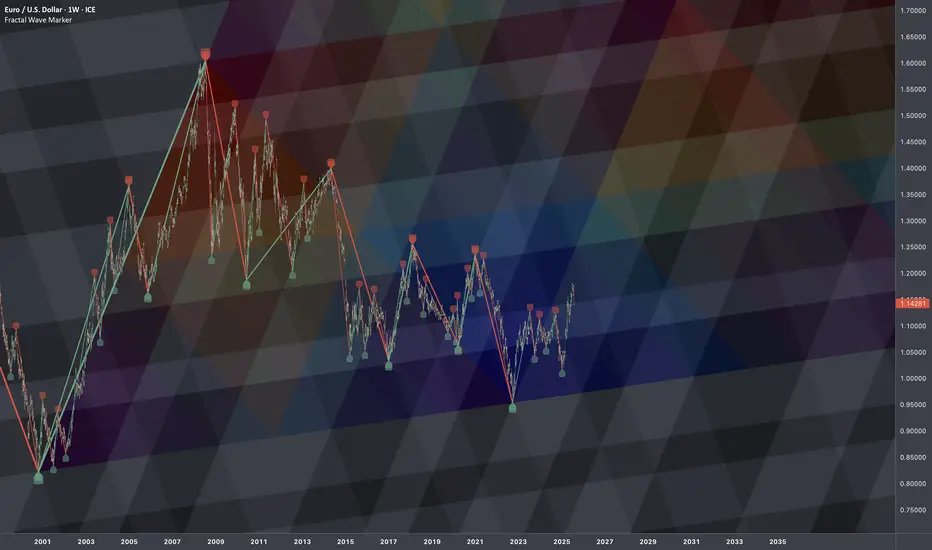
€/$: Fractal Geometry (Cycle 2000-2022)🏛️ Research Notes
Research on order in chaos using scaling laws and math sequences found in nature.
Sierpinski triangle will be used as basic heatmap layer - orienteer for next buildups.
Cross-cycle interconnection 3 cycle knot
Considering the fact that structurally current price is in a new cycle, the core structure which is previous cycle can be extended with another layer that emphasizes phase of the cycle in its angle.
Extended Fibonacci Sierpinski Triangle should look like this:
EURUSD Upcoming sell??? FX:EURUSD Mmm..🤔 Looking at price right now and see what looks like a H&S PATTEN forming will this mean sellers are now taking over? Do let me know what you think on the comment session.

My opinion on the euro to dollarI think the trend is bearish in the medium term, although we may have an upward correction first, so you can wait to enter when shorting.

EURUSD TRADING IDEA 08 05 25Here's another one:
Looking for a strong rejection in the discount zone before going long.

EURUSD SELL SHORTEURUSD in Daily TF Market will bearish , In Daily TF mss in LTF after valid MSS then Entry short in LTF
Target to Monthly BISI / Monthly OBI / OB
enjoYYYYYYYYYYYYYYYYYYYYYYYYYYYYYYYYYYYYYYYYYYYYYYYYYYYYYYYYYYYYYYYYYYYY

EURUSD: POTENTIAL SELLING OPPORTUNITYThe EURUSD pair rebounded from the 1.160 resistance level after the NFP report last Friday, forming a Double Top pattern on the 4-hour chart. This pattern is a strong indication of a potential bearish reversal. With the price having broken below the neckline, it's now approaching a retest of this level and the previously broken trendline.
Key areas to watch include:
1. The neckline around 1.1600, which is expected to act as resistance.
2. The trendline between 1.1670-1.1700, which could provide additional resistance to confirm the bearish outlook.
Possible scenarios include:
Bearish Outlook (Preferred): If the price encounters resistance at these levels and fails to break higher, it may lead to a decline.
This setup suggests a potential selling opportunity, with traders looking to short the pair near the resistance zones.

#EURUSD - Pivot Point is 1.174Date: 22-07-2025
#EURUSD - Current Price: 1.175
Pivot Point: 1.174 Support: 1.162 Resistance: 1.185
Upside Targets:
Target 1: 1.190
Target 2: 1.195
Target 3: 1.203
Target 4: 1.211
Downside Targets:
Target 1: 1.157
Target 2: 1.152
Target 3: 1.144
Target 4: 1.136
#TradingView #Forex #Currency #StockMarket #Investing #Trading #EURUSD
#TechnicalAnalysis #SotockCharts #Finance
#PivotPoints #SupportResistance

EURUSDEURUSD needs a correction and another push up this week.
Disclosure: We are part of Trade Nation's Influencer program and receive a monthly fee for using their TradingView charts in our analysis.

EURUSD--LONG--02_08_25--strong reaction from monthly support around 1.14142
--price will move higher towards 1.17019
--best entry is between 1.15585 and 1.15619

EURUSD: Bearish Continuation
Remember that we can not, and should not impose our will on the market but rather listen to its whims and make profit by following it. And thus shall be done today on the EURUSD pair which is likely to be pushed down by the bears so we will sell!
Disclosure: I am part of Trade Nation's Influencer program and receive a monthly fee for using their TradingView charts in my analysis.
❤️ Please, support our work with like & comment! ❤️

Idea on a zone We have a great zone on EU he Euro to Dollar (EUR/USD) exchange rate dipped to just below 1.14 this week before a recovery to the 1.1550 after the latest US jobs data.
On a long-term view, Berenberg expects fiscal deterioration will be a key element undermining the dollar and it considers that EUR/USD gains to 1.50 are realistic over the longer term.
Berenberg notes that the US has registered a budget deficit every year since the 1960s, but there has been a notable shift in trends over the past few years with substantial deficits even when growth is solid.
Following the latest Budget Bill, the bank estimates that the US will run a deficit of over 7% of GDP next fiscal year. There would also be severe consequences if the US economy slides into recession.

EURUSD BullishAfter exiting a correction, the first impulse (Wave 1) appears. I expect a retracement of at least 50% of the Fibonacci.
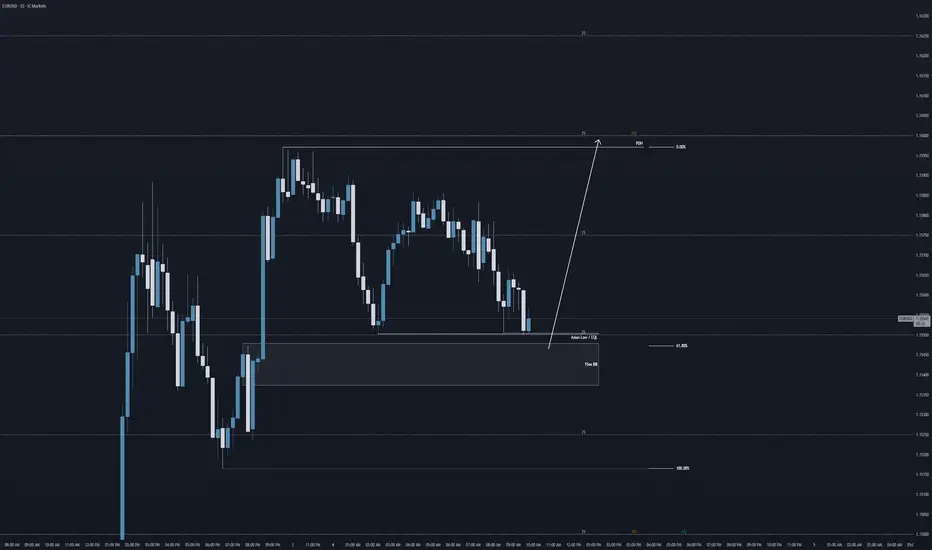
Bullish to sweep PDH (1.16)Good morning traders,
here is a bullish take on EURUSD for today.
I have my eyes set on the previous day high (PDH), and a sweep into key price level of 1.16.
Looking at an interim sell side liquidity sweep of the Asian lows into a 15m breaker block @ 61.8% FIB retracement.
Will of course wait for LTF structure confirmations before getting involved into the markets.
Kind regards,
Aman
SMC Wolf FX
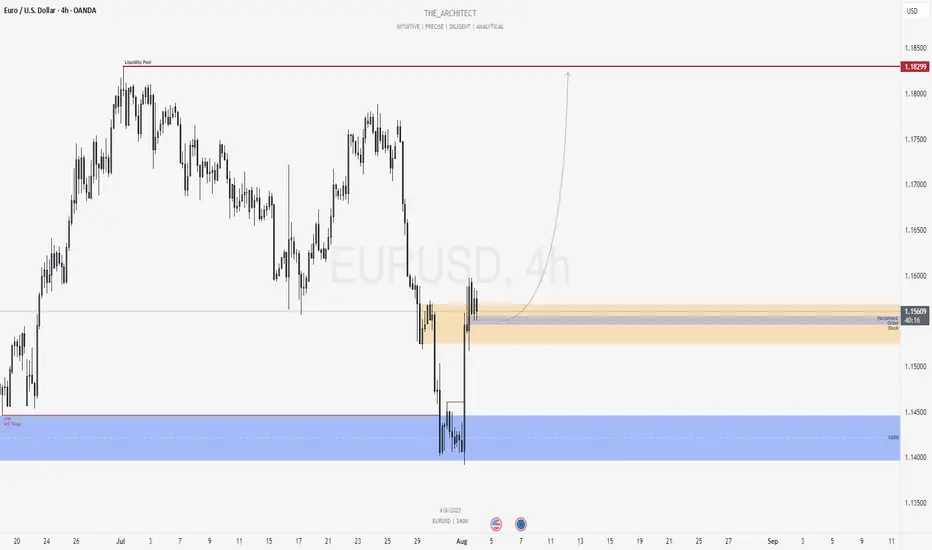
EURUSD: Bullish Continuation from Reclaimed Institutional ZoneGreetings Traders,
In today’s analysis of EURUSD, recent price action confirms the presence of bullish institutional order flow. As a result, we aim to align with this narrative by seeking high-probability buying opportunities at key institutional arrays.
Higher Timeframe Context:
On the weekly timeframe, last week’s candle retraced into a Re-Delivered Re-Balanced (RDRB) Array—a bullish structure often associated with institutional repositioning. From this zone, we anticipate continued bullish delivery towards the weekly liquidity pool, reinforcing a bullish directional bias.
Key Observations on H4:
Bullish Market Structure Shift: Price action on the H4 has decisively shifted bullish, aligning with the higher timeframe’s narrative and confirming our bias.
Reclaimed Order Block Support: Following the bullish shift, price has pulled back into a reclaimed order block—a previously institutional selling zone that, once broken and reclaimed, now acts as a high-probability support area. This becomes a key zone for seeking lower timeframe confirmation entries.
Trading Plan:
Entry Strategy: Look for confirmation entries within the reclaimed order block on lower timeframes (M15–M5).
Target Objective: The draw on liquidity resides at the long-term high, where a cluster of buy-side liquidity is expected to attract price.
For a detailed market walkthrough and in-depth execution zones, be sure to watch this week’s Forex Market Breakdown:
Remain patient and precise in execution. Let the market confirm your bias before entering and manage risk appropriately.
Kind regards,
The Architect 🏛️📈
#AN023: US Tariffs and Jobs Data Sinking the Dollar
Today I want to talk to you about the latest relevant news of the week, focusing on US tariffs and the jobs data sinking the dollar and their overall impact on forex. Hello, I'm Forex Trader Andrea Russo, an independent trader and prop trader with $200,000 in capital under management. Thank you in advance for your time.
Let's get started:
1. Disappointing US jobs & new Trump tariffs
The Non-Farm Payrolls report (July) shows only 73,000 new jobs (+unemployment rates at 4.2%), with negative revisions for May-June: -258,000 jobs.
President Trump immediately signed executive orders imposing reciprocal tariffs (10–41%) on 68 countries, including Canada, Switzerland, India, and Taiwan.
The US dollar has lost ground, Treasury yields have fallen sharply, and the market is now pricing in a 90% rate cut as early as September.
FOREX Impact:
USD weak across all major crosses (EUR/USD, GBP/USD, AUD/USD).
Emerging currencies such as MXN, TRY, and INR could stabilize or gain against the USD.
JPY and CHF gain safe-haven appeal; USD/JPY and USD/CHF face possible reversals.
2. Return of $5 billion RBI swap, impact on Indian liquidity
RBI swap expiration of ₹43,000 cr (~$5 billion) scheduled for August 4: possible drain of liquidity from the Indian banking system.
FOREX Impact:
Potential downside pressure on the INR, volatility on USD/INR.
Monitor capital flows: USD/INR gains possible if trade roles remain balanced.
3. IMF Improves Forecasts but Beware of Tariff Risks
The IMF revised global growth for 2025 to 3.0%, but warns of persistent risks from high tariffs and geopolitical tensions.
FOREX Impact:
Commodity currencies (AUD, CAD, NZD) benefit from a moderately positive tone.
USD weak, but emerging markets vulnerable if growth weakens further.
4. 🇺🇸 Fed Maintains High Rates and Delays Cuts
The FOMC left Fed rates at 4.25–4.50%, adopting a wait-and-see approach. Internal disagreements on potential anticipated cuts.
FOREX Impact:
USD gains limited in the short term.
If Powell remains wait-and-see, the dollar will tend to remain weak or stagnant.
5. 📉 Correct Treasury rise and rate cut expectations
2-year bond yields -25 bps, pricing in 65–100 bps of cuts by the end of the year. Markets are losing confidence in jobs data, and the credibility of the BLS is being questioned.
FOREX Impact:
USD under pressure, especially on EUR/USD and GBP/USD.
Higher-yielding currencies such as AUD and NZD may gain carry trade flows.
6. 🌏 Asia-Pacific markets nervous on US pressure and strong yen
Asian stocks mixed: Nikkei -2%, MSCI Asia +0.3%. Strong yen penalizes Japanese exports.
FOREX Impact:
JPY strengthens, USD/JPY may compress below 150.
AUD/JPY and NZD/JPY are sensitive to risk-on/off flows into the JPY.
7. Rising country risk, emerging markets under stress
Experts recommend currency and sovereign hedging due to US volatility, impacting international portfolios.
Strengthening CHF, JPY, and possible weakness in less liquid thermal currencies.
Interest remains high in the USD compared to high-risk emerging currencies.
8. Key events expected: Jackson Hole Symposium (August 21–23)
Powell and other regulators expected to deliver a speech. No Fed/ECB meeting soon, increasing the importance of Jackson Hole as a catalyst.
FOREX Impact:
Potential flash volatility in the USD, EUR, and GBP following forward guidance.

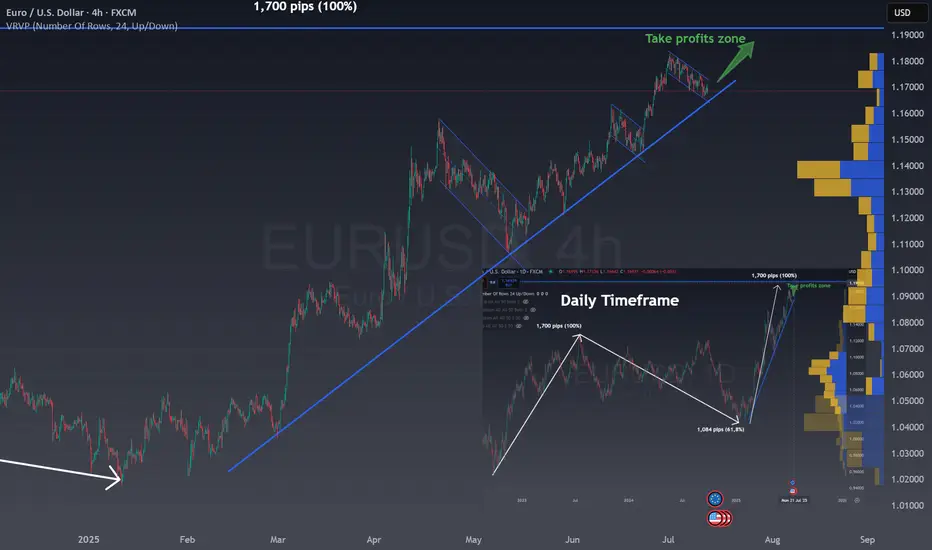
One last rally in EUR/USDIn the right bottom you can see the Daily chart for EUR/USD:
The chart shows the EUR/USD on a daily timeframe.
There was an initial strong rise of 1,700 pips, marked as a 100% move.
After this, the price corrected downward by 1,084 pips, which is 61.8% of the previous rise.
The 61.8% retracement is a common Fibonacci level, often signaling a reversal or pause.
Now, the price is moving up again, following a similar path as the first rise.
The chart suggests a possible new upward move of another 1,700 pips (100%).
A "take profits zone" is marked at the top, indicating a target area for traders.
This pattern reflects how markets often move in waves: trend, correction, and trend continuation.
Fibonacci levels help traders identify potential reversal points.
The chart is used to project future moves based on past price behavior.
The MAIN CHART shows a clear uptrend for EURUSD and the current correction with a flag.
The combination of both patterns give us a clear BUY zone in the channel and using the trend as support or once the channel break upwards.
This is a very good risk reward ratio trade situation where all traders should be!
Pullback tradeThe price has been rejected off a pullback multiple times and now the price looks to continue its downward trend
WE ONLY TRADE PULLBACKS

EURUSD FORMED BEARISH PENNANT. THE PRICE IS READY TO DROP.EURUSD FORMED BEARISH PENNANT. THE PRICE IS READY TO DROP.
EURUSD has been trading sideways within the last day, showing lower highs and higher lows. Eventually, the price has formed the pennant chart pattern.
What is a pennant?
A pennant chart pattern is a short-term continuation pattern in technical analysis, resembling a small symmetrical triangle, formed after a strong price movement (flagpole). It consists of converging trendlines, indicating a brief consolidation before the trend resumes. Bullish pennants form after an uptrend, bearish pennants after a downtrend.
The price is expected to decline towards 1.14500 support level
