EURUSD Breakout Trade PossibleWe can see that after NFP Bullish Move, EU is Holding and consolidating in rectangle, if we observe a breakout of 1.1600 on 1 Hour TF we can Expect it to move till 1.1700-1.17500.
Although, we can see a consolidation for 1-2 days longs cause market always takes breaks after major economic event, and if any DXY affecting news comes from P. Trump or any other factor that can affect Dollar then we can also expect a fast movement as well.
EURUSD needs to trap the sellers first and grab fuel to give next sniper move. Current EURUSD is at Fib Level 50% and Holding their which is a good sign and increase our possibilities that it can trap seller and go up.
What's Happening here; those who are beginner I would like to teach you that when any pair comes to fib level 38%, 50%, 68%, or 78% what most of trader or beginners do, they start short or go long at these levels and in most of case it works. I would say 6/10 times, but if we go deeper and understand the price behaviour what we get to see it is making a normal pattern which any one can understand it when they get start to trap those. that's why their are 65% possibilities of going up and rest is down.
Trading is all about possibilities and observation, do you research as well and risk management is the key to success.
EURUSD trade ideas

Idea on a zone We have a great zone on EU he Euro to Dollar (EUR/USD) exchange rate dipped to just below 1.14 this week before a recovery to the 1.1550 after the latest US jobs data.
On a long-term view, Berenberg expects fiscal deterioration will be a key element undermining the dollar and it considers that EUR/USD gains to 1.50 are realistic over the longer term.
Berenberg notes that the US has registered a budget deficit every year since the 1960s, but there has been a notable shift in trends over the past few years with substantial deficits even when growth is solid.
Following the latest Budget Bill, the bank estimates that the US will run a deficit of over 7% of GDP next fiscal year. There would also be severe consequences if the US economy slides into recession.

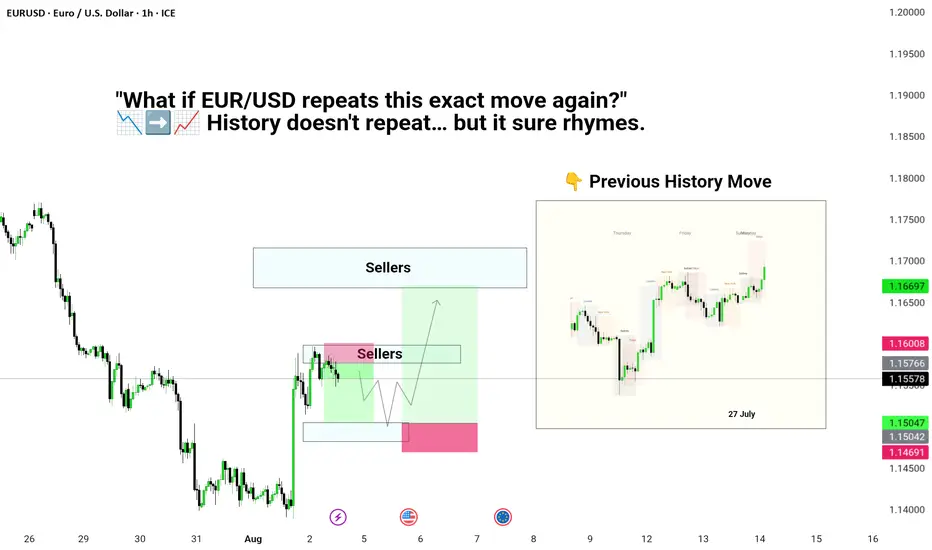
"What if EUR/USD repeats this exact move again?"“Mark this zone before it explodes 🚀📍
Drop 🔥 if you’re watching EUR/USD this week!”
"EUR/USD preparing for a potential bullish reversal 🐂! Watch for that W pattern formation and entry near 1.15600 with targets towards the 1.16600 resistance zone! Just like history repeated itself last week! 📈🔥
👉 #SmartMoney #ForexAnalysis #EURUSD"
EU|Bullish Structure Holding| 4H OB + Inducement Sweep Lining Up(Refined & Structured):
• Pair: EURUSD
• Bias: Bullish
• 4H Overview: Clean bullish structure is intact with bullish intent already shown. After breaking a recent high, price swept sell-side liquidity and inducement, tapping directly into a 4H order block.
• 30M Structure: Watching for a clear change of character—specifically a break of a 30M lower high. Once that happens and price sweeps internal liquidity into the 30M OB, I’ll begin hunting confirmation.
• Entry Zone: After internal OB mitigation, I’ll drop to the 5M for a strong church-level confirmation. Execution follows once the story completes.
• Targets: 5M to 30M highs depending on delivery.
• Mindset Note: Right now it’s analysis mode. Structure is unfolding beautifully. Patience, precision, and price reading—this is where the game’s won.

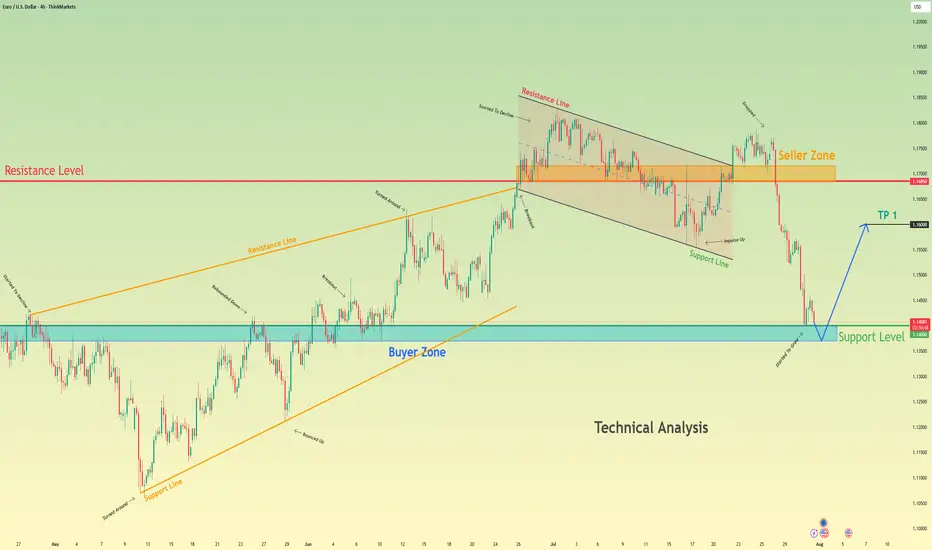
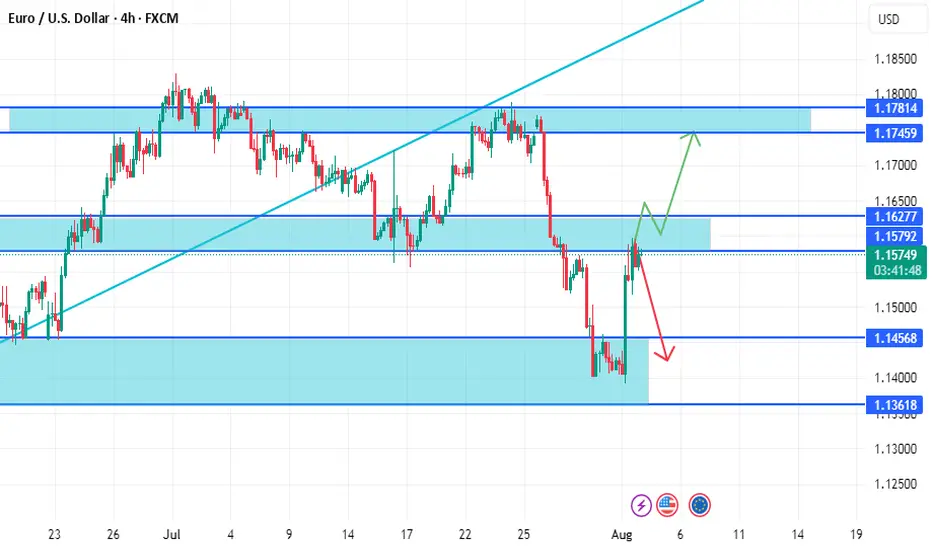
Euro bounce from buyer zone and start to move upHello traders, I want share with you my opinion about Euro. After a prolonged upward trend which formed a large rising wedge, the EURUSD faced a significant rejection from the seller zone near the 1.1685 resistance level. This failure to continue higher marked a key turning point, exhausting the bullish momentum and initiating a new bearish market phase. This new phase has since taken the form of a well-defined downward channel, within which the price has been undergoing a series of downward corrections and impulses. The most recent market action has been a sharp downward fall, accelerating the price's descent towards a critical area of historical significance. Currently, the pair is approaching the major support level at 1.1400, which also constitutes a strong buyer zone where demand has previously stepped in. The primary working hypothesis is a long, counter-trend scenario, which anticipates that the current bearish momentum will be absorbed by the strong demand within this buyer zone. A confirmed and strong rebound from this 1.1400 support area would signal a potential temporary bottom and the start of a significant upward correction. Therefore, the tp for this rebound is logically set at the 1.1600 level, a key psychological and technical point that represents a realistic first objective for a bounce of this nature. Please share this idea with your friends and click Boost 🚀
Disclaimer: As part of ThinkMarkets’ Influencer Program, I am sponsored to share and publish their charts in my analysis.
Thoughts on EU/USHave some ideas bout this chart. Dont want talk too much& If ur interested in. Just read previous takes in my acc. Feel to cozy, might delete later >/>
EURUSD: Move Down Expected! Short!
My dear friends,
Today we will analyse EURUSD together☺️
The price is near a wide key level
and the pair is approaching a significant decision level of 1.15337 Therefore, a strong bullish reaction here could determine the next move up.We will watch for a confirmation candle, and then target the next key level of 1.15208.Recommend Stop-loss is beyond the current level.
❤️Sending you lots of Love and Hugs❤️

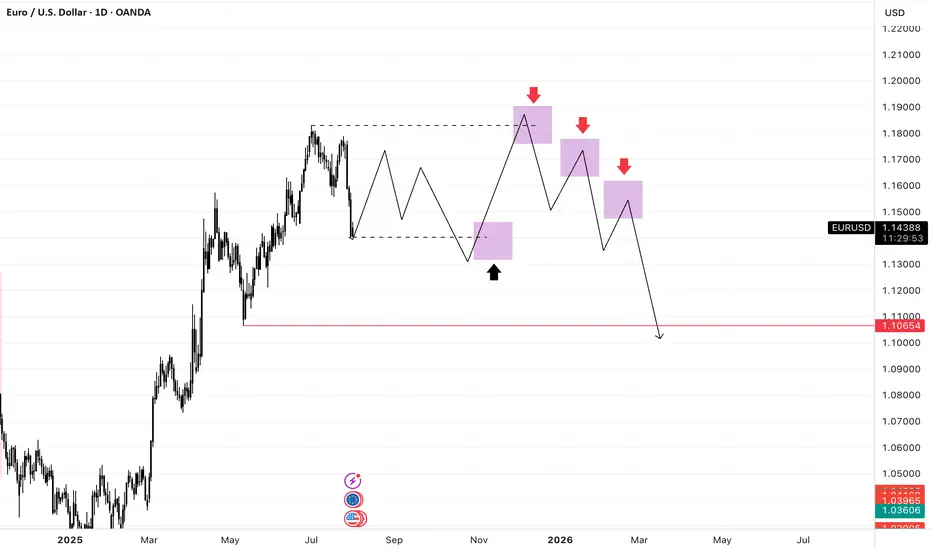
EURUSD: NEW WEEK TECHNICAL BIAS (MARKET OPEN)CONTEXT
The Monthly and Weekly timeframes still maintain a valid Ascend Sequence, with no confirmed trend breakdown yet.
However, the Daily has signaled a down Trend Shift, which I currently interpret as a correctional move—likely a pause before a continuation toward the primary HTF target zone.
📈 Expecting a rally toward 1.16439 or further into the 1.17031 zone.
📉 From there, a pullback into the 1.15727, 1.3524 and 1.12421 price levels.
This retracement could:
1. Extend toward or beyond the Range Low (RH)
2. OR form a Bid Accumulation Zone (BAZ) for a fresh leg in the HTF bullish narrative.
⚠️ There’s also a slim probability of 1.15727 acting as an early base to launch the rally.
● This projection is based purely on technical structure. No fundamental overlays.
📌 This is a strategic directional bias, not financial advice. Execute only with confirmation and proper risk management.

EURUSD long position 05/08/2025English : According to our analysis, we anticipate a bullish scenario.
Morocan Darija : kanchofo d'apres l'analyse dyalna antsanaw tloo3
ATENTION : I only share my ideas, not signals

EURUSDPrice rejecting supply; structure showing lower highs/lows. COT supports USD strength — expecting further downside.
EUR/USD (Bearish)
Price rejecting supply; lower highs/lows forming with COT backing USD strength. Bias remains bearish toward next support.
Eurusd sell, short termprice is still in a bearish market structure and the spike caused by non-farm payroll is very weak, we can expert sellers to step in and push this down at least below the spike or even lower.

EURUSD – DAILY FORECAST Q3 | W32 | D5 | Y25📊 EURUSD – DAILY FORECAST
Q3 | W32 | D5 | Y25
Daily Forecast 🔍📅
Here’s a short diagnosis of the current chart setup 🧠📈
Higher time frame order blocks have been identified — these are our patient points of interest 🎯🧭.
It’s crucial to wait for a confirmed break of structure 🧱✅ before forming a directional bias.
This keeps us disciplined and aligned with what price action is truly telling us.
📈 Risk Management Protocols
🔑 Core principles:
Max 1% risk per trade
Only execute at pre-identified levels
Use alerts, not emotion
Stick to your RR plan — minimum 1:2
🧠 You’re not paid for how many trades you take, you’re paid for how well you manage risk.
🧠 Weekly FRGNT Insight
"Trade what the market gives, not what your ego wants."
Stay mechanical. Stay focused. Let the probabilities work.
FX:EURUSD
CHART UPDATE !!!!!

EURUSD POSSIBLE SELL OPPORTUNITY!Price is reacting at a major o key level of broken support turn resistance. I anticipate a sell off from the current market price with my target profit situated at 1.13962 A sell opportunity is envisaged.

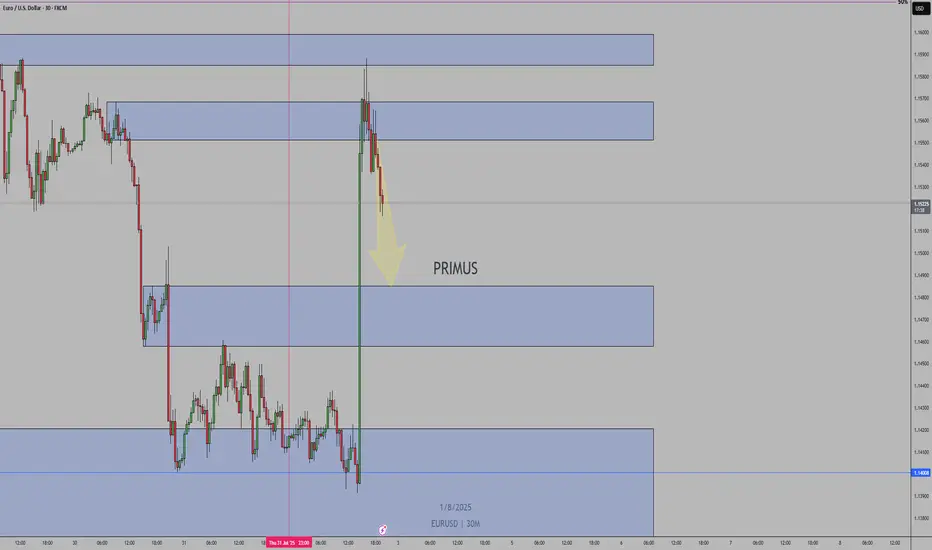
EURUSD - 31/7/25Price has reached a zone that broke the structure - see BoS on the left. Now that price is here in the zone, im not comfortable entering a buy order yet. The full bearish candle into the zone, leaves me with an indication that price may go lower.
+ve:
1. Big bearish candle in to the BoS zone - price may drop lower
2. There is equal low liquidity on the left which sits just below the zone which is expected to be taken out
4. HTF direction is still bullish
-ve:
1. below the equal low liquidity is an efficient zone before some imbalance
2. that imbalance may draw price to it and stop me out
Second trade idea:
Assuming that the first trade does not hold, then my focus will be the extreme zone where i will place a buy limit.
TP: 8.86R

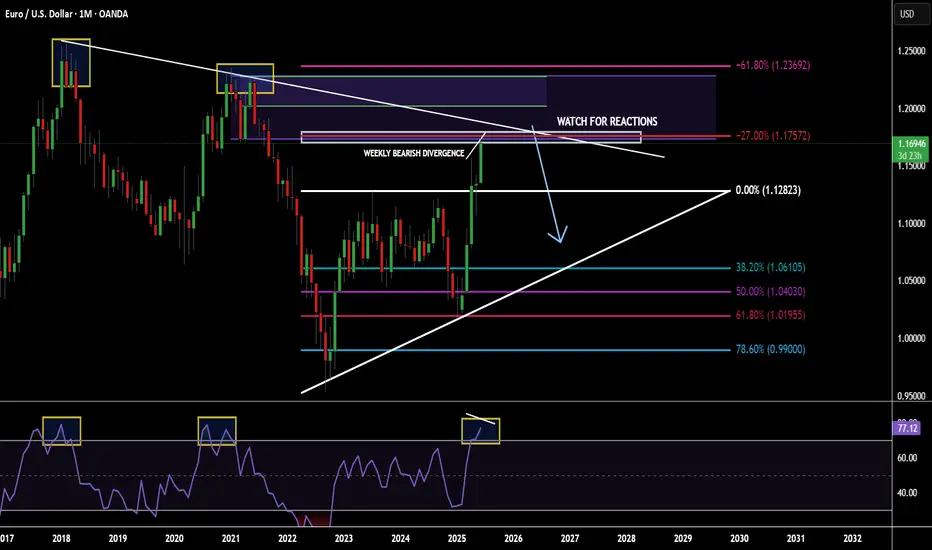
POTENTIAL EURUSD SHORT OPPORTUNITY...POSITION TRADEHello hello TradingView family! Hope you guys are doing amazingly well! Just wanted to come on here and make another post for a potential longer term opportunity I am seeing on the major currency pair EURUSD. So put your seat belts on and let's dive in!!
OK so I'm going to keep this very very simple. Not because I don't want to go in depth but because my trading is very simple and I'm just going to give it to you straight. So here are the points
1. Price is @ monthly supply
2. Price has made new highs & sitting at a monthly fib extension
3. Monthly RSI overbought conditions
4. Weekly has bearish divergence forming
5. Weekly/Daily buyer is slowing down
Make sense? If not..then I know you will figure it out. Watch for price to potentially poke a little higher but nice confluences for a fall in price. Appreciate you all!
EURUSD - 4-Hour Chart with Order Block Reversal StrategyThe EUR/USD 4-hour chart shows a significant bearish retracement approaching a well-defined order block zone, which represents a potential strong support area where major buyers may step in.
Price has experienced a clear downtrend following a break of structure (BOS) from the recent high near 1.18000 into the order block area around 1.13900 - 1.14150. This order block acts as a demand zone where smart money is anticipated to accumulate buy orders, making it a critical level to watch for potential market reversal.
The trading plan anticipates price will test this order block support and generate bullish reversal signals such as price rejection candlesticks or increased buying volume. Confirmation at this zone sets up a potential long trade aiming for a significant retracement to the previous weak high near 1.19200, targeting a strong risk-to-reward opportunity.
Risk management is vital, placing stop losses just below the lower boundary of the order block to protect against false breakouts or further downside continuation.
This plan combines market structure analysis, smart money concepts of order blocks, and technical confirmation to capture a high-probability reversal trade. Traders should patiently wait for clear reversal signals before entry and monitor price action closely within the order block for optimal trade timing.

EURUSD Outlook – From Bias to Execution Previous day closed bearish from a known demand zone no bias for now until price either breaks demand cleanly or reclaims with bullish intent, Narrowing down to the 1H timeframe, I identified a familiar Bullish pennant under supply price action pattern, On the 45M timeframe, I then looked for possible entry and exit zones.

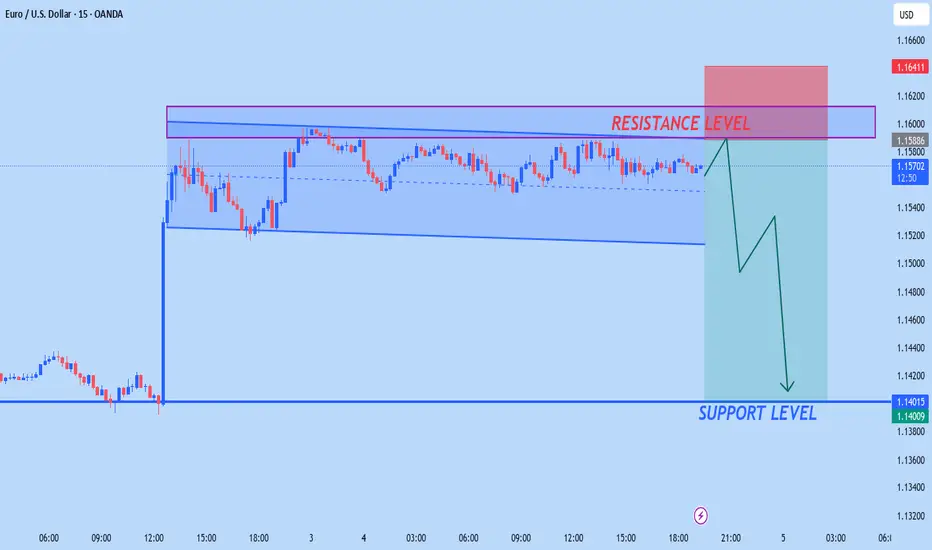
EUROUSD WILL FALLING SOONaccording to M15 analysis EUROUSD market running in side wave from today now market is almost is resistance level
if you want to sell you have good opportunity to go sell from RESISTANCE ZONE
TRADE AT YOUR OWN RISK
EURUSD: Bears Will Push Lower
Remember that we can not, and should not impose our will on the market but rather listen to its whims and make profit by following it. And thus shall be done today on the EURUSD pair which is likely to be pushed down by the bears so we will sell!
Disclosure: I am part of Trade Nation's Influencer program and receive a monthly fee for using their TradingView charts in my analysis.
❤️ Please, support our work with like & comment! ❤️

EUR/USD DAILY CHART ANALYSIS - 4TH AUG 2025EUR/USD Daily Trade Setup – August 4, 2025
Anticipating a move in EUR/USD into the yellow imbalance zone between 1.16991 and 1.16025, for short positions.
Final take-profit target for these sells is the red zone between 1.10120 and 1.08126. If price does not reach the yellow zone, then no entry for short positions. PATIENCE

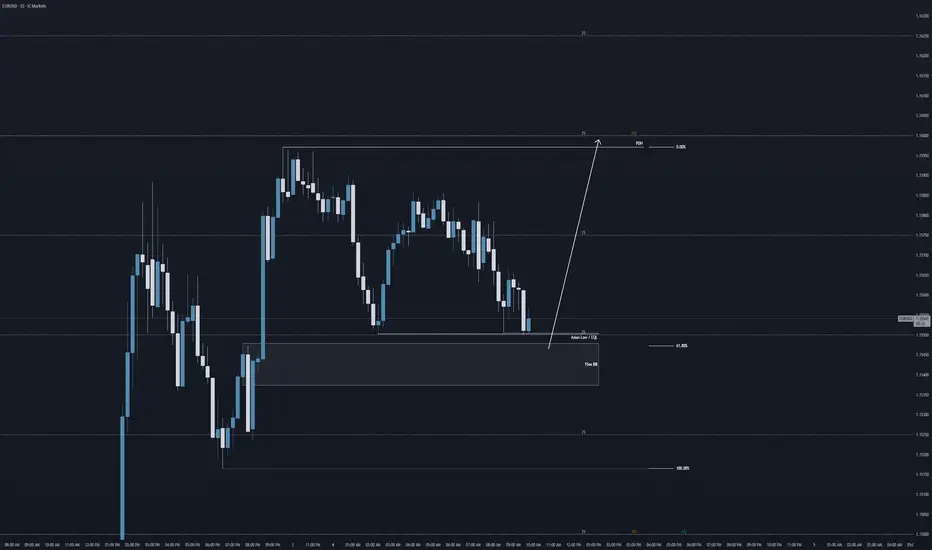
Bullish to sweep PDH (1.16)Good morning traders,
here is a bullish take on EURUSD for today.
I have my eyes set on the previous day high (PDH), and a sweep into key price level of 1.16.
Looking at an interim sell side liquidity sweep of the Asian lows into a 15m breaker block @ 61.8% FIB retracement.
Will of course wait for LTF structure confirmations before getting involved into the markets.
Kind regards,
Aman
SMC Wolf FX
EURUSD consider on support and resistance zone togetherEURUSD now on resistance area i expect the price will break and form head and shoulder
on the other hand, may this area is strong and the price make down trend ,but we should wait candle pattern on this area to take sell
you must wait price action to take good trade with risk to reward 1:3
good luck
EURUSD shows bullish momentumLast week’s price signals pointed to bullish momentum, setting the tone for this week’s market action.
EURUSD broke and closed above our reversal zone, indicating a likely continuation to the upside.
As long as the price stays above 1,1388, we’ll be watching for a higher low and potential buying opportunities.
You can easily spot the next target levels by checking previous highs and using the Fibonacci expansion tool.
